
This article is based on publicly available IR materials and is not a recommendation to buy or sell any specific securities.
Keio Corporation reported operating revenues of 496.9 billion yen for FY2025, up 44.0 billion yen year on year and a new record, with growth across all segments driven by increased sales in Real Estate Sales, higher completed construction volume in Construction and Civil Engineering, and higher-priced bookings in Hotels. Operating profit totaled 52.3 billion yen, down 1.8 billion yen year on year, due to factors such as an increase in investments, including railway safety investments. Profit attributable to owners of parent totaled 42.9 billion yen, also setting a new record, due to factors such as the sale of cross-shareholdings. The annual dividend for FY2025 is scheduled to be 110.0 yen per share, up 10.0 yen from the previous year.
Consolidated Results (Full-Year Actual)
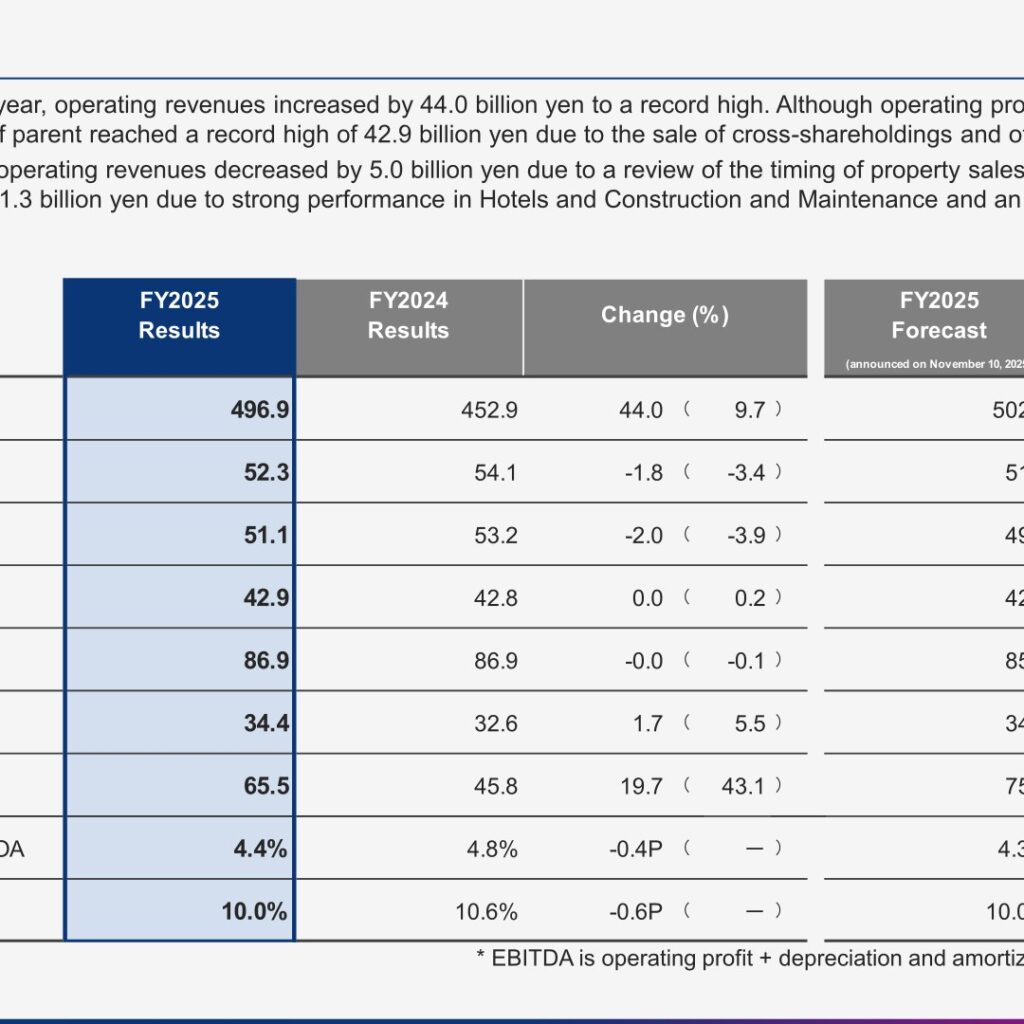
Compared with the previous year, operating revenues increased by 44.0 billion yen to a record high. Although operating profit decreased by 1.8 billion yen, profit attributable to owners of parent reached a record high of 42.9 billion yen due to the sale of cross-shareholdings and other factors. Compared with the forecast announced on November 10, 2025, operating revenues decreased by 5.0 billion yen due to a review of the timing of property sales in Real Estate Sales, while operating profit increased by 1.3 billion yen due to strong performance in Hotels and Construction and Maintenance and an increase in variable rents in Real Estate Leasing. EBITDA is defined in the materials as operating profit plus depreciation and amortization plus amortization of goodwill.
| Item (¥ billion) | FY2025 Results | FY2024 Results | Change (%) | FY2025 Forecast (announced Nov. 10, 2025) | Change (%) |
|---|---|---|---|---|---|
| Operating Revenues | 496.9 | 452.9 | 44.0 (9.7) | 502.0 | -5.0 (-1.0) |
| Operating Profit | 52.3 | 54.1 | -1.8 (-3.4) | 51.0 | 1.3 (2.6) |
| Ordinary Profit | 51.1 | 53.2 | -2.0 (-3.9) | 49.7 | 1.4 (3.0) |
| Profit Attributable to Owners of Parent | 42.9 | 42.8 | 0.0 (0.2) | 42.0 | 0.9 (2.2) |
| EBITDA | 86.9 | 86.9 | -0.0 (-0.1) | 85.7 | 1.1 (1.3) |
| Depreciation and Amortization | 34.4 | 32.6 | 1.7 (5.5) | 34.6 | -0.1 (-0.5) |
| Capital Expenditures | 65.5 | 45.8 | 19.7 (43.1) | 75.9 | -10.3 (-13.7) |
| Consolidated Ordinary Profit ROA | 4.4% | 4.8% | -0.4P (—) | 4.3% | 0.1P (—) |
| Consolidated ROE | 10.0% | 10.6% | -0.6P (—) | 10.0% | — (—) |
On the balance sheet, total assets stood at 1,199.8 billion yen against 1,122.5 billion yen a year earlier, liabilities at 755.6 billion yen and net assets at 444.2 billion yen. Interest-bearing debt rose by 22.1 billion yen to 469.0 billion yen and net interest-bearing debt was 421.3 billion yen against 398.7 billion yen. The company states that although the balance of interest-bearing debt increased due to factors including increases in bonds payable and short-term borrowings, financial leverage and financial soundness remained at appropriate levels: net interest-bearing debt/EBITDA of 4.8x (4.6x a year earlier), a D/E ratio of 1.1x (1.1x) and an equity ratio of 37.0% (36.9%).
Segment Results
Revenue increased year on year in all five segments — Transportation, Real Estate, Hotels, Construction and Maintenance, and Life Services — due to higher sales in Real Estate Sales and an increase in completed construction work in Construction and Civil Engineering. On profit, although Construction and Maintenance and Life Services grew, profit decreased in Transportation, Hotels and Real Estate due to increased investment, including railway safety investments. In Railways, both commuter-pass and non-commuter-pass passenger numbers were up year on year, but increases in depreciation associated with new rolling stock and personnel expenses from improved compensation resulted in higher revenues but lower profit; in Bus Services, highway bus revenues were strong, supported by increased demand from inbound travelers.
| Segment (¥ billion) | Operating Revenues FY2025 | Operating Revenues FY2024 | Operating Profit FY2025 | Operating Profit FY2024 |
|---|---|---|---|---|
| Transportation | 133.2 | 130.1 | 13.2 | 15.6 |
| Real Estate | 120.7 | 91.5 | 17.1 | 17.6 |
| Hotels | 60.0 | 56.4 | 10.1 | 10.8 |
| Construction and Maintenance | 87.6 | 77.4 | 7.4 | 5.6 |
| Life Services | 146.0 | 144.2 | 5.8 | 5.3 |
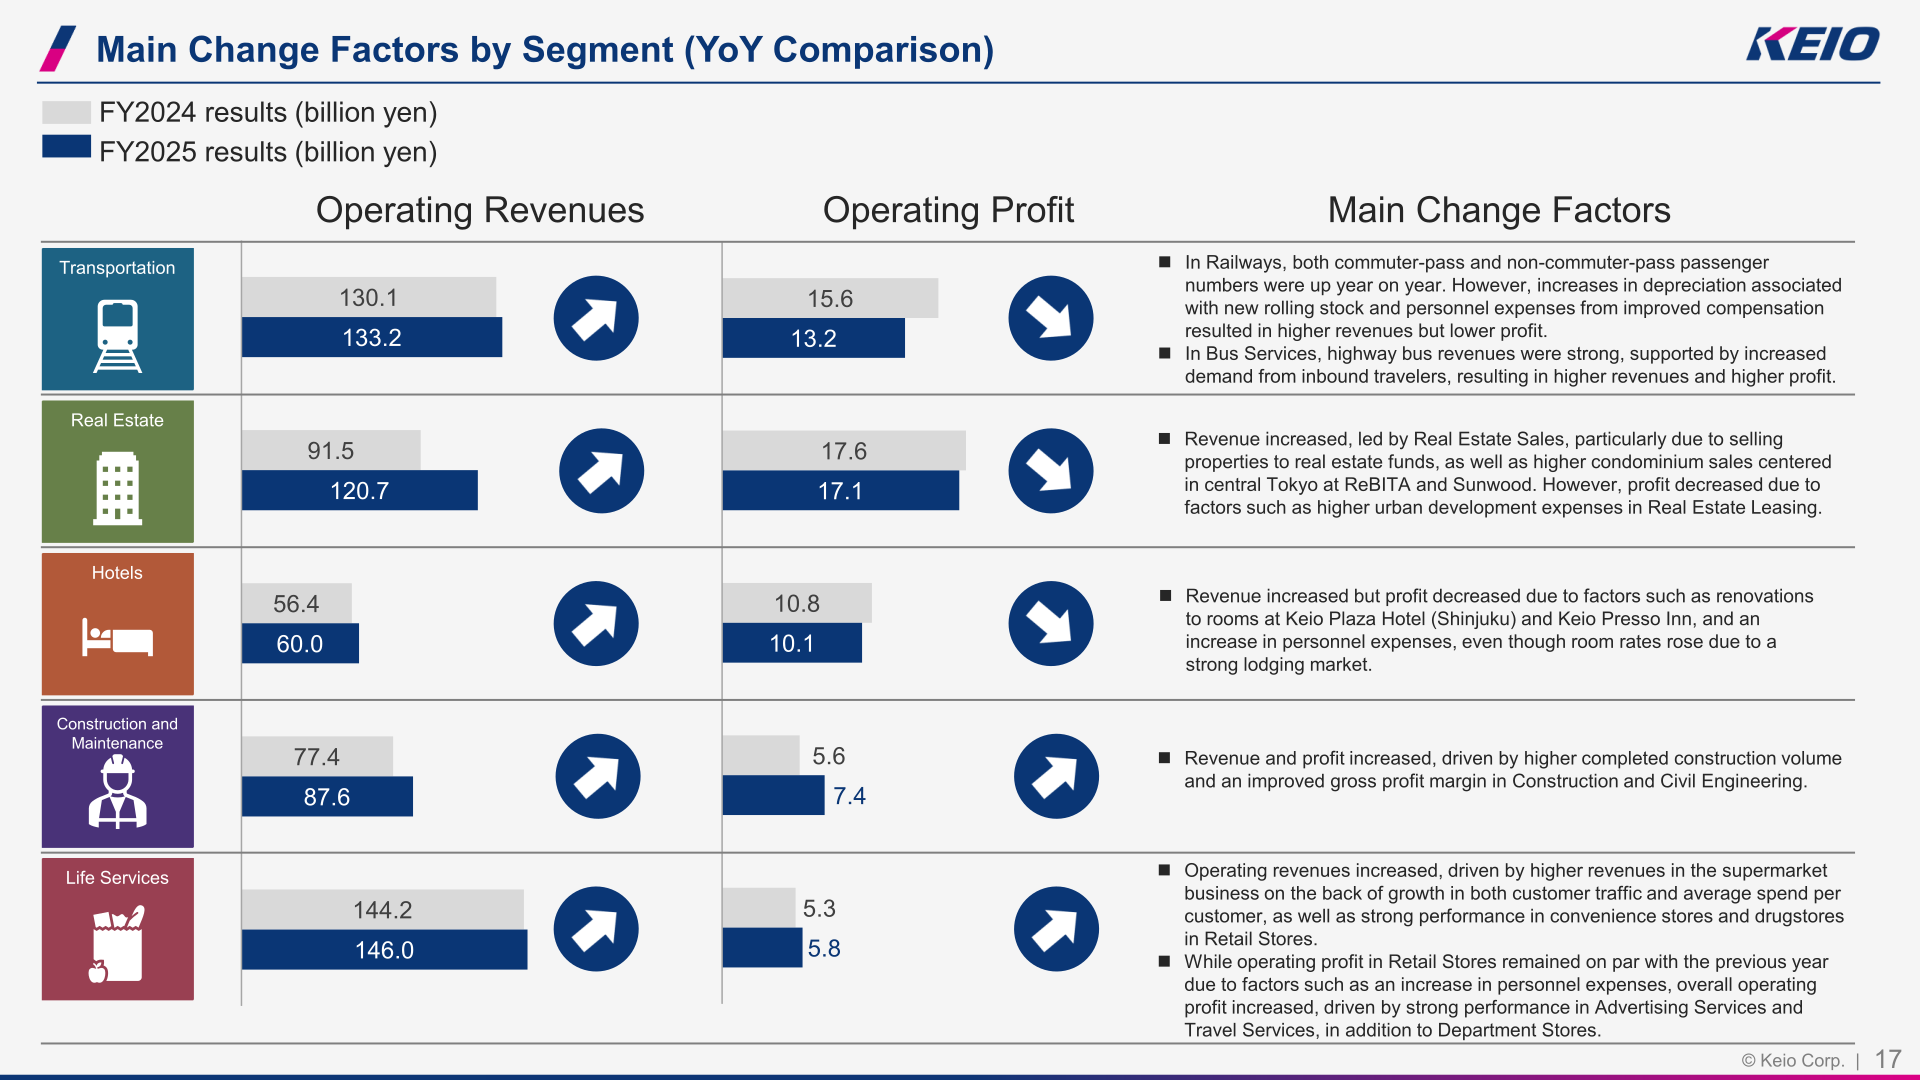
Operating revenue change factors versus FY2024 were Real Estate +29.2 billion yen, Construction and Maintenance +10.1 billion yen, Hotels +3.5 billion yen, Transportation +3.1 billion yen and Life Services +1.7 billion yen, with Elimination at -3.7 billion yen. Operating profit change factors were Construction and Maintenance +1.8 billion yen and Life Services +0.5 billion yen, against Real Estate -0.4 billion yen, Hotels -0.7 billion yen, Transportation -2.4 billion yen and Elimination -0.4 billion yen. In Railways, the number of passengers transported was 605 million (commuter pass 333 million, non-commuter pass 272 million) versus 593 million in FY2024 (328 million and 265 million). At Keio Plaza Hotel (Shinjuku) the average daily rate was 39,206 yen with a guest room occupancy rate of 67.5%, and at Keio Presso Inn (all locations) the average daily rate was 14,658 yen with an occupancy rate of 87.1%.
FY2026 Forecast
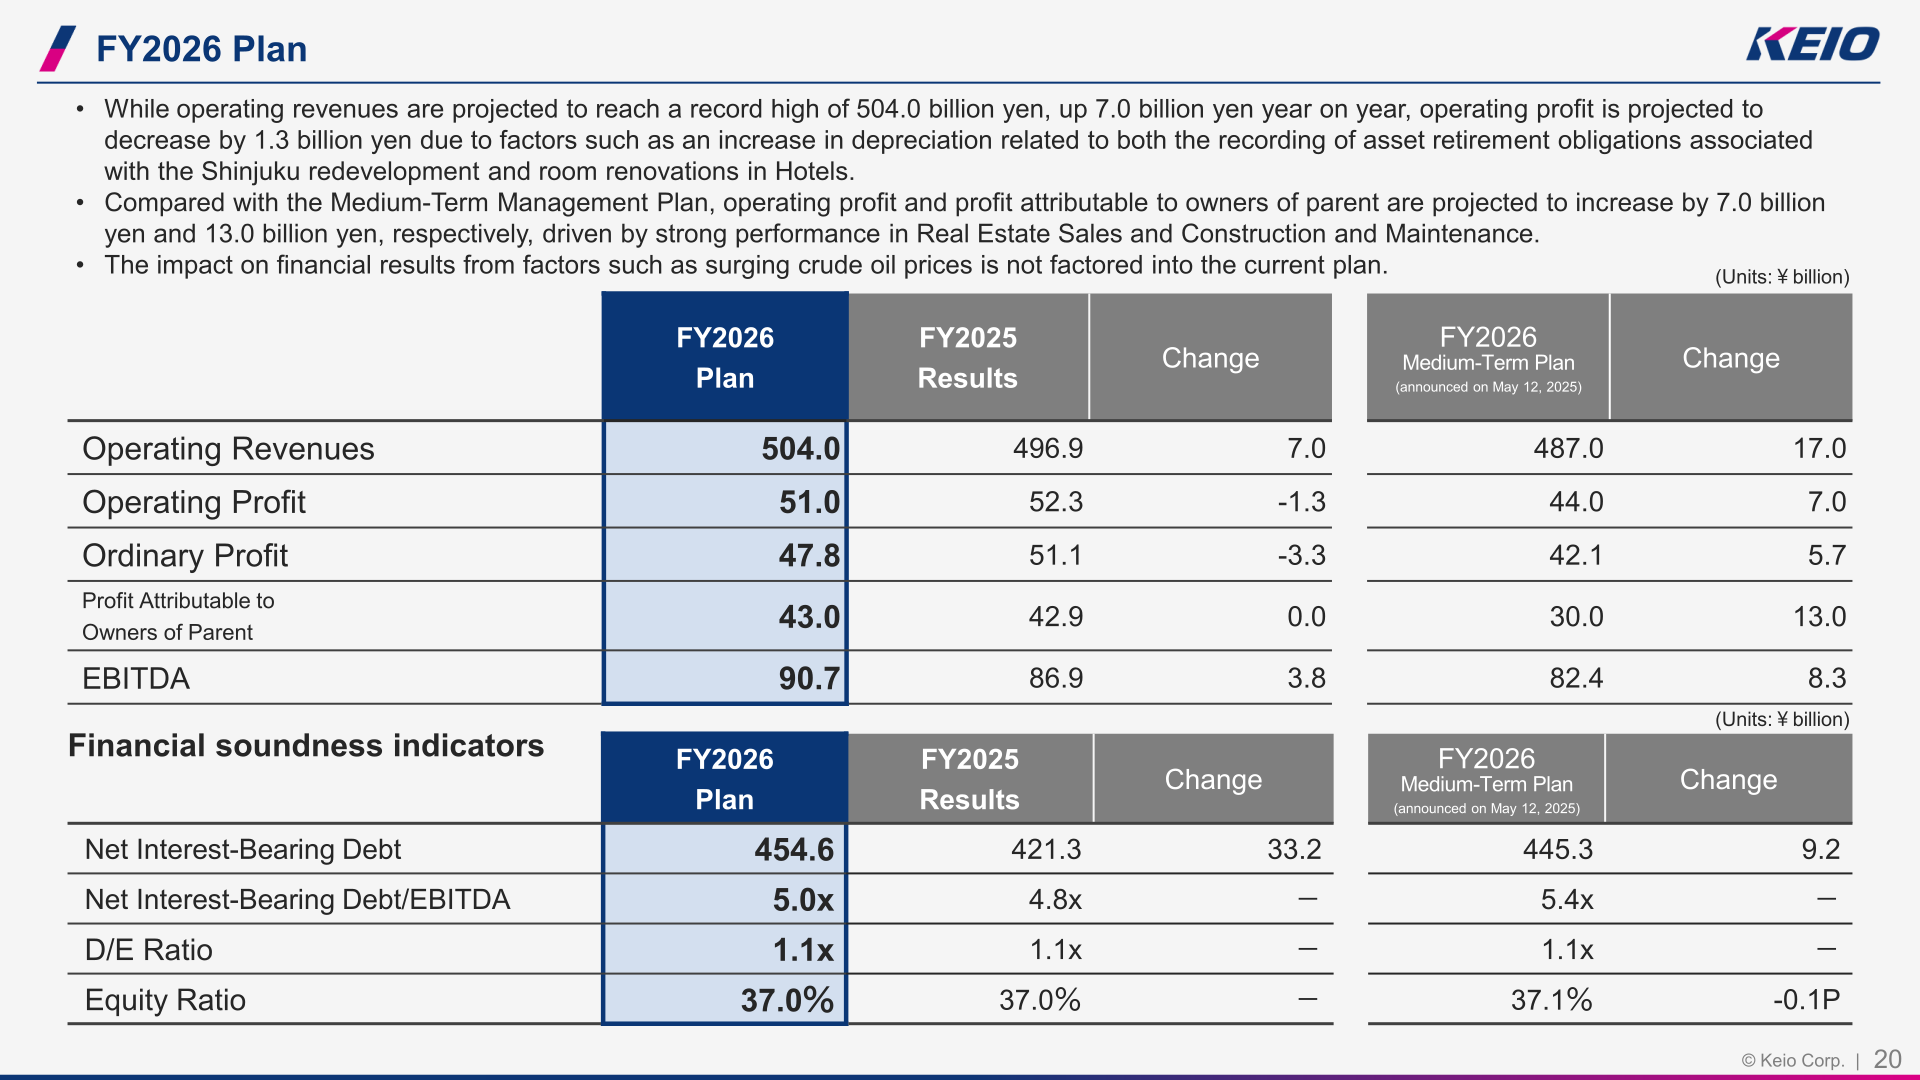
Operating revenues are projected to total 504.0 billion yen, up 7.0 billion yen year on year and a record high, due to factors such as higher property sales in Real Estate Sales and increased passenger numbers in Railways. Operating profit is projected to total 51.0 billion yen, down 1.3 billion yen, due to factors such as an increase in depreciation related to both the recording of asset retirement obligations associated with the Shinjuku redevelopment and room renovations in Hotels. Profit attributable to owners of parent is expected to be 43.0 billion yen. Compared with the Medium-Term Management Plan announced on May 12, 2025, operating profit and profit attributable to owners of parent are projected to increase by 7.0 billion yen and 13.0 billion yen respectively. The materials note that the impact on financial results from factors such as surging crude oil prices is not factored into the current plan.
| Item (¥ billion) | FY2026 Plan | FY2025 Results | Change | FY2026 Medium-Term Plan (announced May 12, 2025) | Change |
|---|---|---|---|---|---|
| Operating Revenues | 504.0 | 496.9 | 7.0 | 487.0 | 17.0 |
| Operating Profit | 51.0 | 52.3 | -1.3 | 44.0 | 7.0 |
| Ordinary Profit | 47.8 | 51.1 | -3.3 | 42.1 | 5.7 |
| Profit Attributable to Owners of Parent | 43.0 | 42.9 | 0.0 | 30.0 | 13.0 |
| EBITDA | 90.7 | 86.9 | 3.8 | 82.4 | 8.3 |
| Net Interest-Bearing Debt | 454.6 | 421.3 | 33.2 | 445.3 | 9.2 |
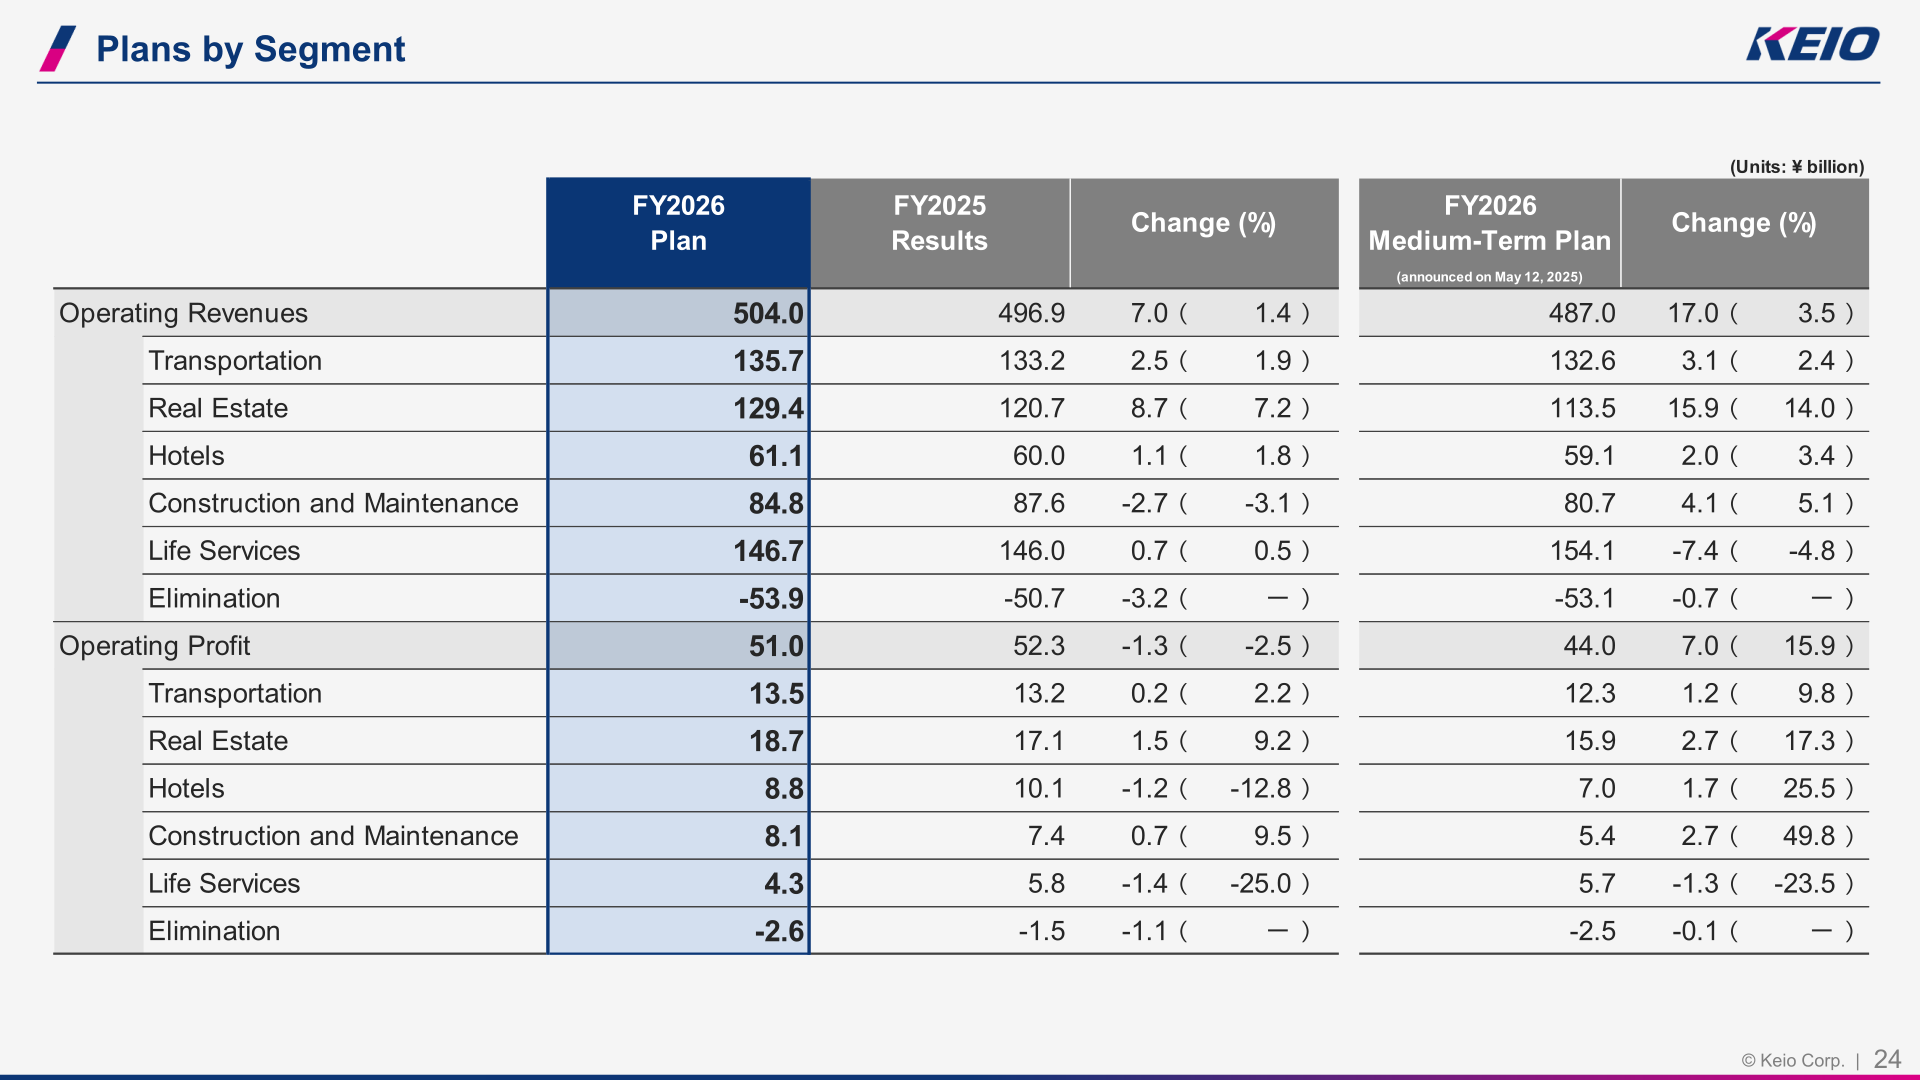
| Segment (¥ billion) | Operating Revenues FY2026 Plan | Operating Revenues FY2025 Results | Operating Profit FY2026 Plan | Operating Profit FY2025 Results |
|---|---|---|---|---|
| Transportation | 135.7 | 133.2 | 13.5 | 13.2 |
| Real Estate | 129.4 | 120.7 | 18.7 | 17.1 |
| Hotels | 61.1 | 60.0 | 8.8 | 10.1 |
| Construction and Maintenance | 84.8 | 87.6 | 8.1 | 7.4 |
| Life Services | 146.7 | 146.0 | 4.3 | 5.8 |
| Elimination | -53.9 | -50.7 | -2.6 | -1.5 |
| Total | 504.0 | 496.9 | 51.0 | 52.3 |
ROE is expected to be 9.6% in FY2026 against 10.0% in FY2025, and ROA 4.0% against 4.4%, both down 0.4 points on lower profit; versus the Medium-Term Management Plan, ROA is 0.4 points higher and ROE 2.8 points higher, further driven by the expected sale of cross-shareholdings and leasehold assets. Segment ROA plans, which are based on operating profit, are Transportation 2.7%, Real Estate 4.6%, Hotels 7.9%, Construction and Maintenance 10.5% and Life Services 7.0%, against FY2025 results of 2.7%, 4.4%, 10.3%, 9.5% and 9.8% respectively. In Railways, the number of passengers transported is planned at 613 million (commuter pass 336 million, non-commuter pass 276 million), and depreciation and amortization is expected to increase by 2.5 billion yen year on year due to increased capital investment, including the introduction of new Series 2000 railcars and enhanced functionality of automatic ticket gates.
Shareholder Returns
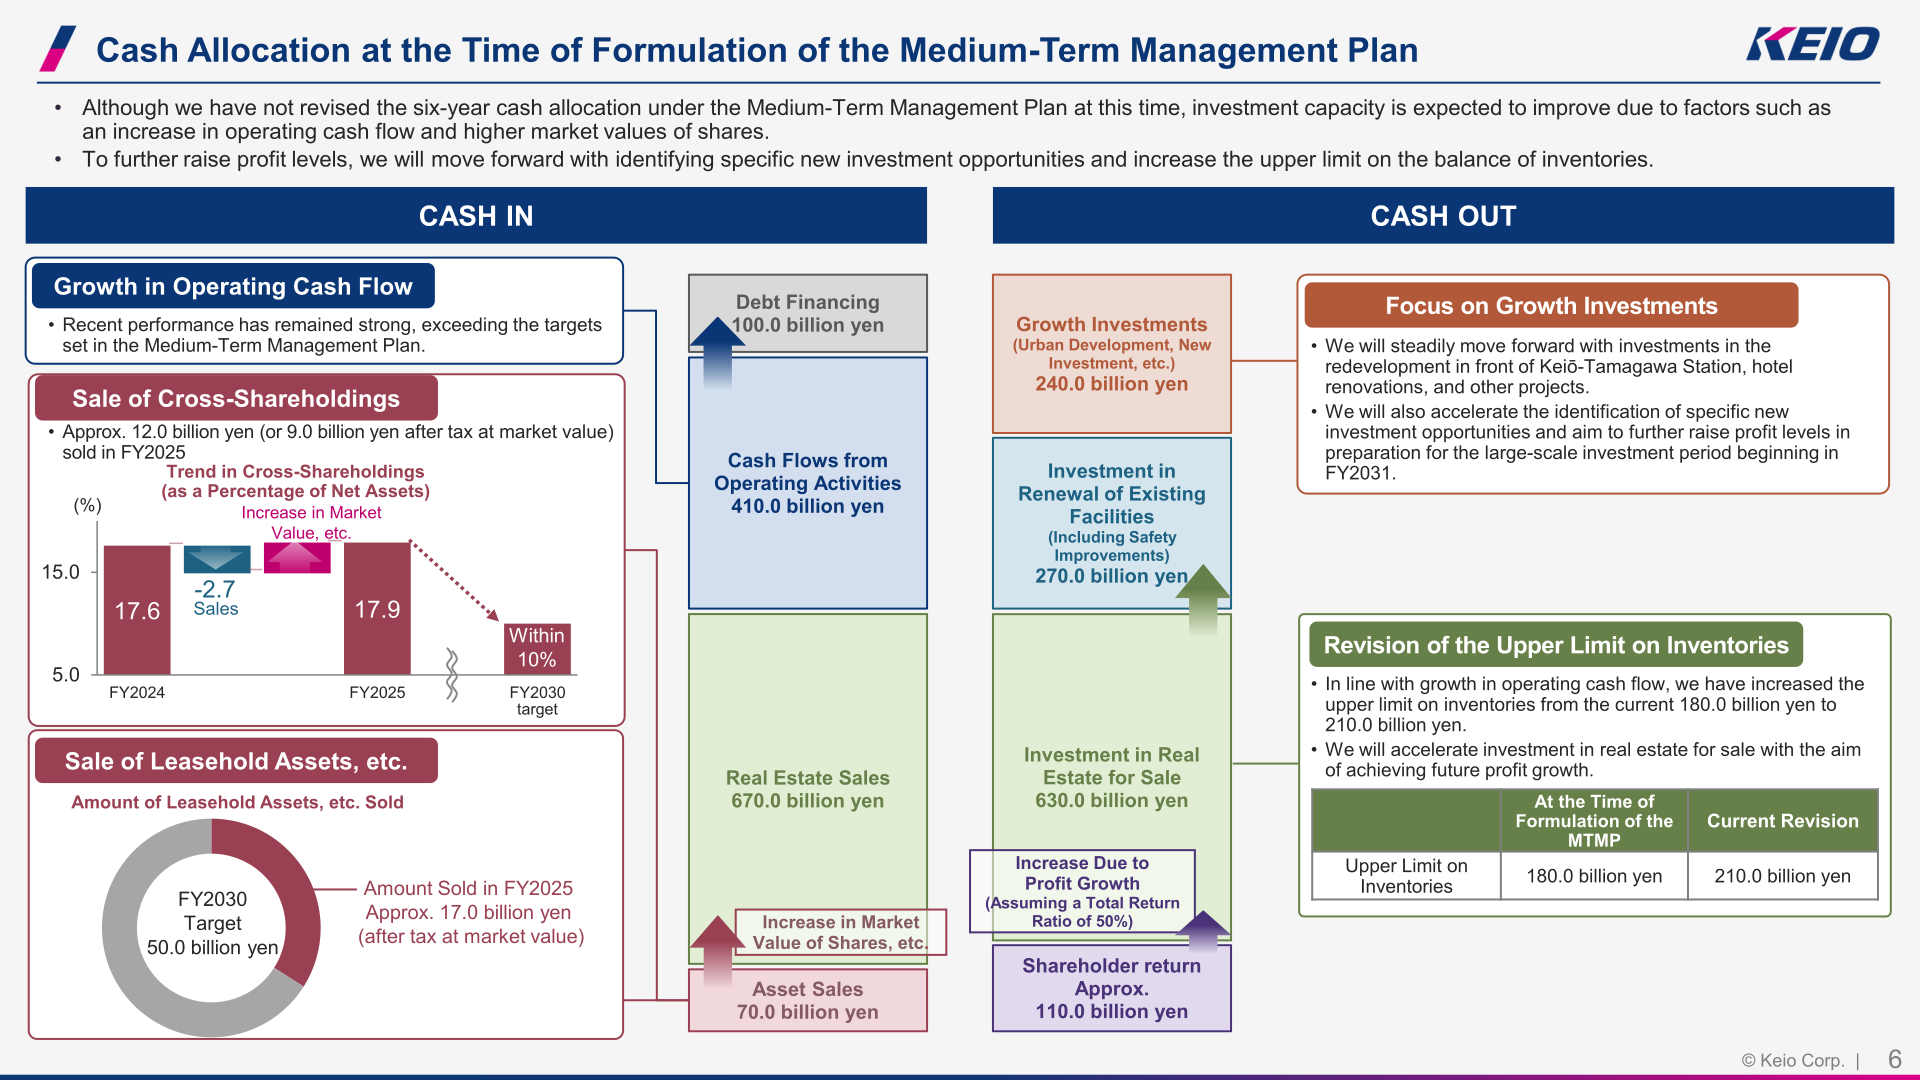
The annual dividend for FY2025 is scheduled to be 110.0 yen per share, up 10.0 yen from the previous year. For FY2026 the annual dividend is scheduled to be 22.0 yen per share (110.0 yen, pre-split basis). Under the cash allocation set at the time of formulation of the Medium-Term Management Plan, shareholder return is set at approximately 110.0 billion yen of cash out, with the accompanying chart noting an assumed total return ratio of 50% for the increase due to profit growth.
Medium-Term Plan and Topics
Under the Keio Group Medium-Term Management Plan “HIRAKU2030”, the company has not revised the six-year cash allocation at this time, but states that investment capacity is expected to improve due to factors such as an increase in operating cash flow and higher market values of shares. The upper limit on inventories has been raised from 180.0 billion yen to 210.0 billion yen to accelerate investment in real estate for sale. Cash in comprises cash flows from operating activities of 410.0 billion yen, debt financing of 100.0 billion yen, real estate sales of 670.0 billion yen and asset sales of 70.0 billion yen; cash out comprises growth investments of 240.0 billion yen, investment in renewal of existing facilities including safety improvements of 270.0 billion yen, investment in real estate for sale of 630.0 billion yen and shareholder return.
On cross-shareholdings, approximately 12.0 billion yen (or 9.0 billion yen after tax at market value) was sold in FY2025, while the ratio to net assets moved from 17.6% in FY2024 to 17.9% in FY2025 against an FY2030 target of within 10%. Leasehold assets and similar assets of approximately 17.0 billion yen (after tax at market value) were sold in FY2025 against an FY2030 target of 50.0 billion yen. Other initiatives include the start of sales scheduled for mid-June 2026 for Keio Tamagawa HAMMONS, the condominium building in the “itonami” development in front of Keio-Tamagawa Station, with 265 units and gross floor area of approximately 24,086 square meters; the formation of three new private funds in FY2025 taking assets under management to approximately 50.0 billion yen against a FY2030 target of 150.0 billion yen, and consideration of establishing a private REIT around 2028; the establishment of the Keio Rail Fund corporate venture capital fund with an expected size of 8.0 billion yen and a 10-year investment period; a platform door installation rate of 29% in FY2025 with a 39% plan for FY2026 and 100% targeted by the early 2030s; and a 5.6% increase in annual income on a non-consolidated monthly salary basis in the 2026 spring wage negotiations.
This article is an analysis based on publicly available information and is not a recommendation to buy or sell any specific securities. Investment decisions are your own responsibility.
![[Obayashi] Investors’ Guide 2026 — The Complete 24-Article Breakdown](https://japan-equity.com/wp-content/uploads/2026/07/hub_cover-1024x1024.png)
![[Obayashi] IR & SR Policy — Feeding Dialogue Back into Management](https://japan-equity.com/wp-content/uploads/2026/07/p32_sq-1024x1024.jpg)
![[Obayashi] Real Estate Development — 18.7% Margin, ¥287.7bn Unrealized Gains](https://japan-equity.com/wp-content/uploads/2026/07/p20_sq-1024x1024.jpg)
![[Obayashi] Domestic Civil Engineering — Resilience Spending Supports 9.6% Margin](https://japan-equity.com/wp-content/uploads/2026/07/p11_sq-1024x1024.jpg)
![[Obayashi] Share Price & External Ratings — vs TOPIX, ESG Index Inclusion](https://japan-equity.com/wp-content/uploads/2026/07/p40_sq-1024x1024.jpg)
![[Construction] ¥75.5tn Investment, Shrinking Workforce — Big-5 Market Share](https://japan-equity.com/wp-content/uploads/2026/07/p12_sq-1024x1024.jpg)



![[Obayashi] Capital Policy & Shareholder Returns — ROE 10%+, DOE ~5%, ¥100bn Buyback](https://japan-equity.com/wp-content/uploads/2026/07/p27_sq-1024x1024.jpg)
![[Obayashi] Reducing Cross-Shareholdings — ¥285.2bn Sold in Five Years](https://japan-equity.com/wp-content/uploads/2026/07/p29_sq-1024x1024.jpg)
![[Obayashi] ¥750bn Investment Plan — ¥300bn to Development, ¥190bn to Tech/DX](https://japan-equity.com/wp-content/uploads/2026/07/p30_sq-1024x1024.jpg)
![[Obayashi] MTP2022 KPIs — Operating Profit ~2x Target, ROE 14.4%](https://japan-equity.com/wp-content/uploads/2026/07/p25_sq-1024x1024.jpg)
![[Obayashi] Cash Allocation — ¥420bn Investment CF Over Five Years](https://japan-equity.com/wp-content/uploads/2026/07/p26_sq-1024x1024.jpg)
![[Obayashi] Green Energy — 44 Plants, 344MW, and the Green Hydrogen Challenge](https://japan-equity.com/wp-content/uploads/2026/07/p21_sq-1024x1024.jpg)
![[Obayashi] Tackling the Labor Shortage — Robotics Construction®](https://japan-equity.com/wp-content/uploads/2026/07/p14_sq-1024x1024.jpg)
