
This article is based on publicly available IR materials and is not a recommendation to buy or sell any specific securities.
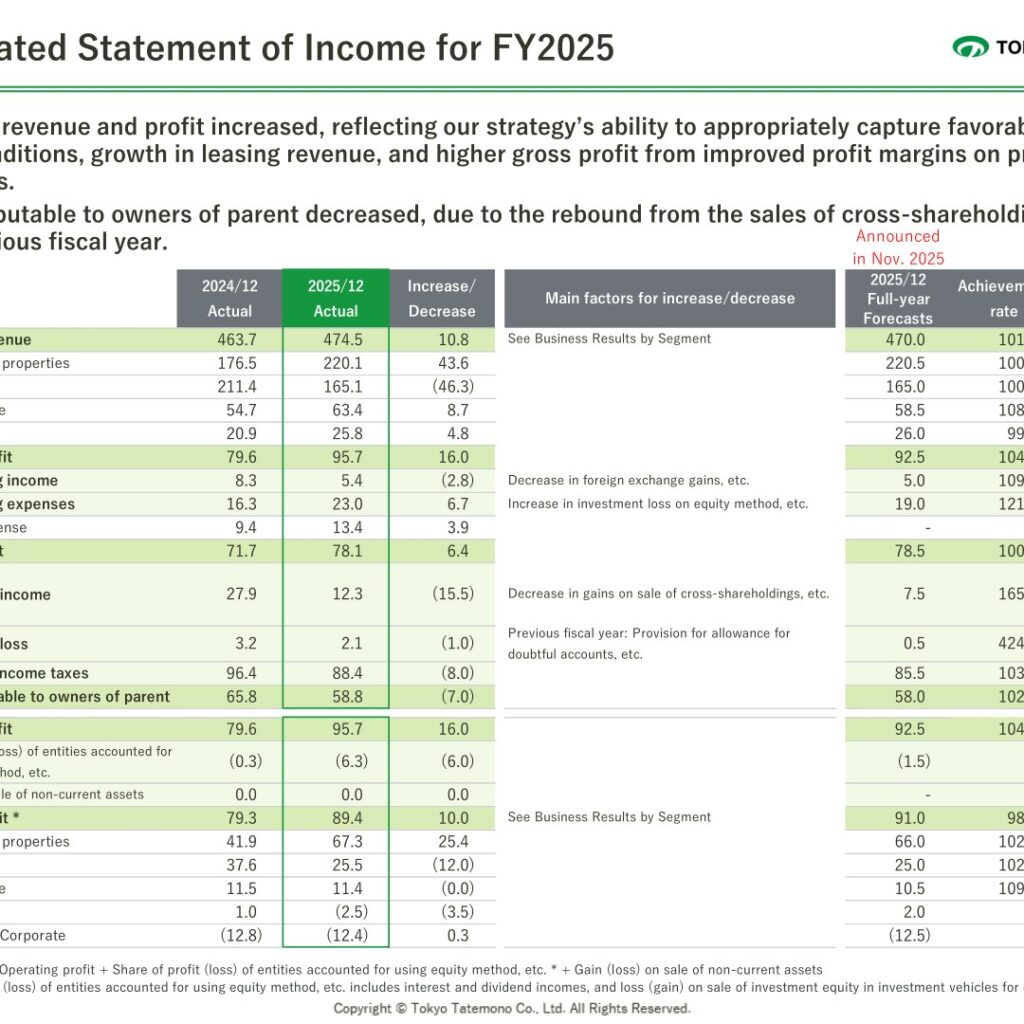
Tokyo Tatemono reported operating revenue of ¥474.5 billion for FY2025 (ended December 31, 2025), up ¥10.8 billion year on year, with operating profit of ¥95.7 billion (up ¥16.0 billion), ordinary profit of ¥78.1 billion (up ¥6.4 billion) and business profit of ¥89.4 billion (up ¥10.0 billion). According to the presentation material, revenue and profit increased, reflecting the company’s strategy’s ability to appropriately capture favorable real estate market conditions, growth in leasing revenue, and higher gross profit from improved profit margins on property sales to investors. Profit attributable to owners of parent was ¥58.8 billion, down ¥7.0 billion, due to the rebound from the sales of cross-shareholdings recorded in the previous fiscal year. Operating revenue, operating profit, business profit and ordinary profit all reached new highs, and operating profit achieved year-on-year growth of over 20%.
Consolidated Results (Full-Year Actual)
The table below follows the consolidated statement of income disclosed in the presentation material, together with the FY2025 full-year forecasts announced in November 2025 and the achievement rate against them. Business profit is defined in the material as operating profit plus share of profit (loss) of entities accounted for using equity method, etc. plus gain (loss) on sale of non-current assets.
| Item (¥ billion) | 2024/12 Actual | 2025/12 Actual | Increase/Decrease | 2025/12 Full-year Forecasts | Achievement rate |
|---|---|---|---|---|---|
| Operating revenue | 463.7 | 474.5 | 10.8 | 470.0 | 101% |
| Operating profit | 79.6 | 95.7 | 16.0 | 92.5 | 104% |
| Non-operating income | 8.3 | 5.4 | (2.8) | 5.0 | 109% |
| Non-operating expenses | 16.3 | 23.0 | 6.7 | 19.0 | 121% |
| Interest expense | 9.4 | 13.4 | 3.9 | – | – |
| Ordinary profit | 71.7 | 78.1 | 6.4 | 78.5 | 100% |
| Extraordinary income | 27.9 | 12.3 | (15.5) | 7.5 | 165% |
| Extraordinary loss | 3.2 | 2.1 | (1.0) | 0.5 | 424% |
| Profit before income taxes | 96.4 | 88.4 | (8.0) | 85.5 | 103% |
| Profit attributable to owners of parent | 65.8 | 58.8 | (7.0) | 58.0 | 102% |
| Share of profit (loss) of entities accounted for using equity method, etc. | (0.3) | (6.3) | (6.0) | (1.5) | – |
| Gain (loss) on sale of non-current assets | 0.0 | 0.0 | 0.0 | – | – |
| Business profit | 79.3 | 89.4 | 10.0 | 91.0 | 98% |
On the balance sheet, total assets increased by ¥191.4 billion to ¥2,272.7 billion, driven by factors such as an increase in real estate for sale from investments in properties sales to investors and an increase in non-current assets from investments in large-scale redevelopment projects. Real estate for sale stood at ¥612.1 billion and interest-bearing debt at ¥1,345.4 billion. The capital adequacy ratio was 26.0% (up 0.2p), the debt equity ratio 2.3 (net debt equity ratio: 2.0x) and the interest-bearing debt / EBITDA multiple 11.4. Cash and cash equivalents at the end of the period were ¥152.2 billion, up ¥41.1 billion year on year.
Segment Results
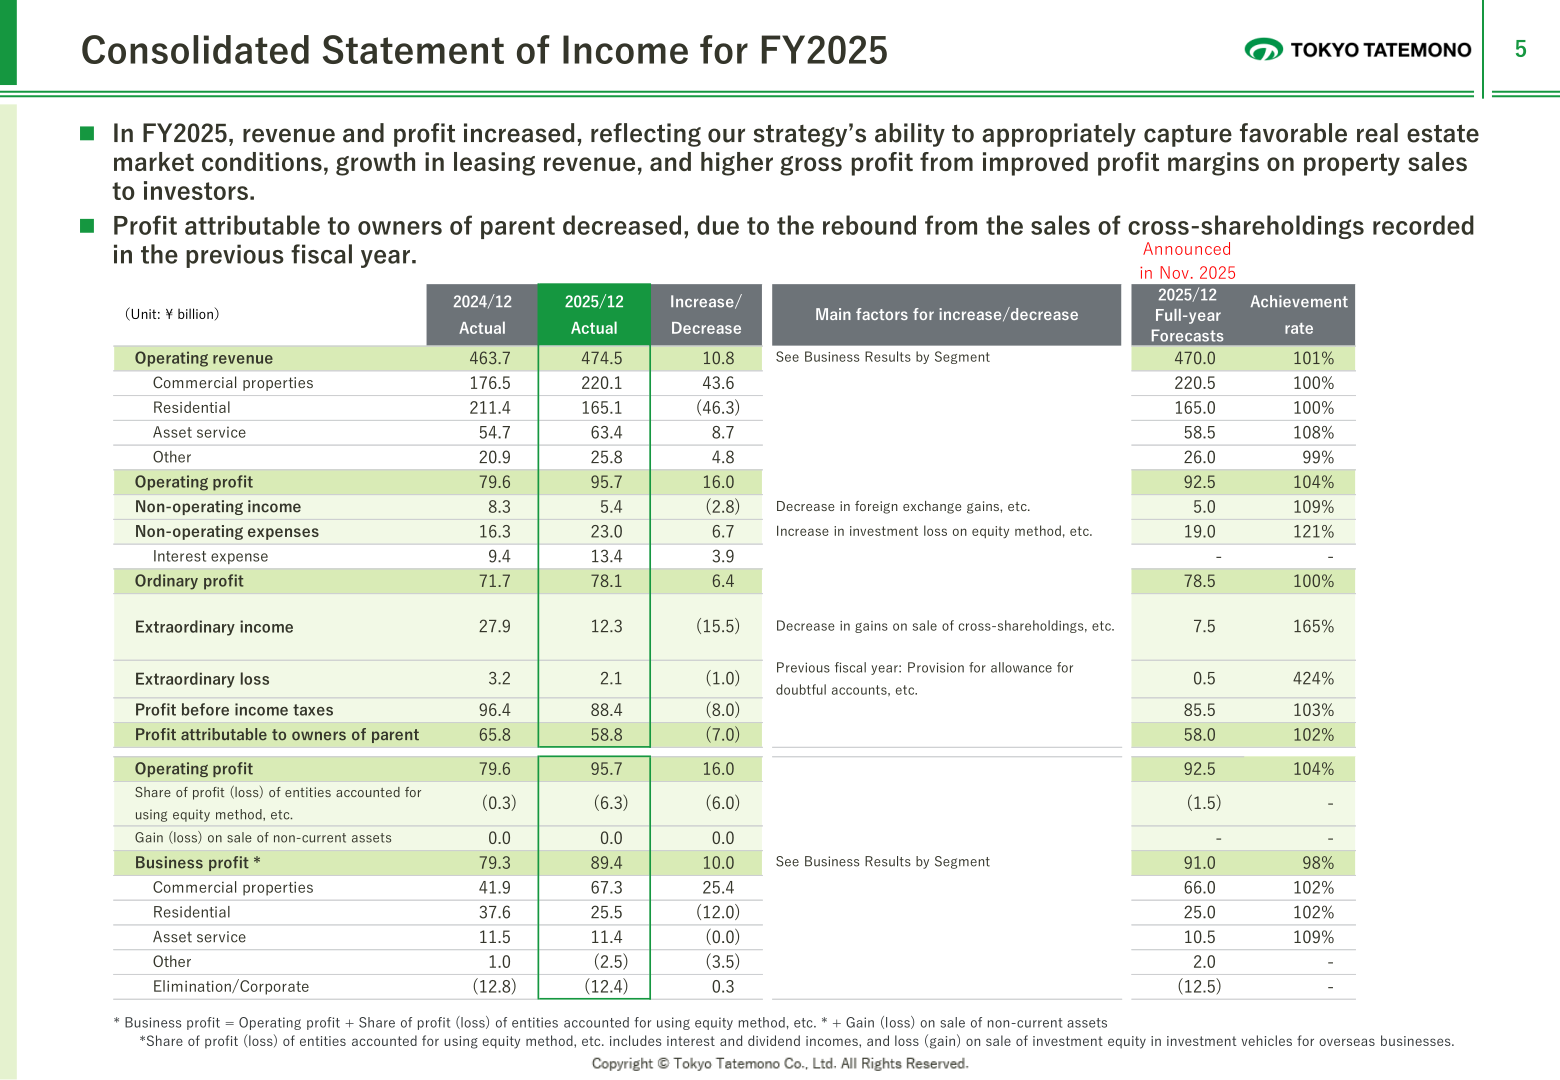
By segment, Commercial Properties operating revenue rose to ¥220.1 billion from ¥176.5 billion and business profit to ¥67.3 billion from ¥41.9 billion, driven by higher property sales to investors and steady performance in the leasing of buildings and operating of facilities. Residential operating revenue fell to ¥165.1 billion from ¥211.4 billion and business profit to ¥25.5 billion from ¥37.6 billion, following a reduction in the number of sales of condominium posted and the average unit price; the number of condo sales posted was 1,287 units, the condo unit price ¥75.51 million and the gross margin 29.4%. Asset Service revenue rose to ¥63.4 billion from ¥54.7 billion while business profit was ¥11.4 billion versus ¥11.5 billion, due to the absence of segment-to-segment transaction profits recorded in the previous fiscal year. Other revenue rose to ¥25.8 billion from ¥20.9 billion, but business profit was a loss of ¥2.5 billion against a profit of ¥1.0 billion, due to the loss of entities accounted for using equity method in the overseas business.
| Segment (¥ billion) | Metric | 2024/12 Actual | 2025/12 Actual | 2026/12 Full-year Forecasts |
|---|---|---|---|---|
| Commercial properties | Operating revenue | 176.5 | 220.1 | 284.0 |
| Residential | Operating revenue | 211.4 | 165.1 | 139.0 |
| Asset service | Operating revenue | 54.7 | 63.4 | 77.0 |
| Other | Operating revenue | 20.9 | 25.8 | 24.0 |
| Commercial properties | Business profit | 41.9 | 67.3 | 83.0 |
| Residential | Business profit | 37.6 | 25.5 | 22.0 |
| Asset service | Business profit | 11.5 | 11.4 | 12.0 |
| Other | Business profit | 1.0 | (2.5) | (1.0) |
| Elimination/Corporate | Business profit | (12.8) | (12.4) | (14.0) |
| Total | Business profit | 79.3 | 89.4 | 102.0 |
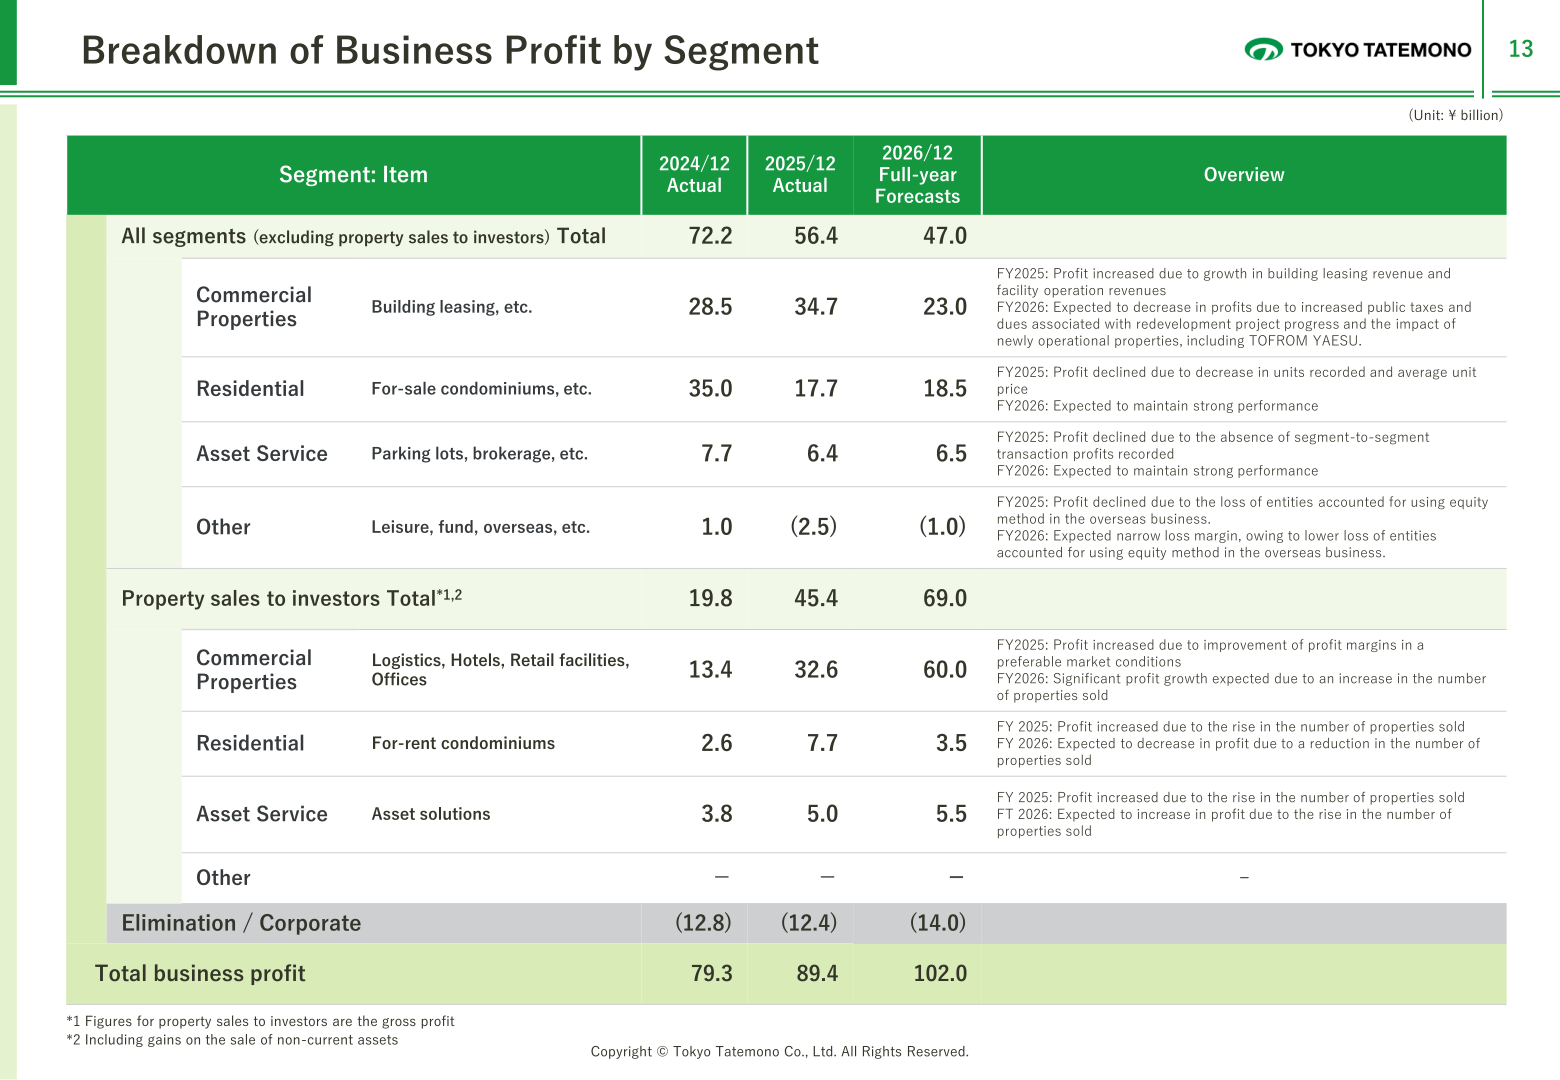
The material also breaks business profit into the businesses excluding property sales to investors and property sales to investors. All segments excluding property sales to investors totaled ¥56.4 billion in FY2025 against ¥72.2 billion in FY2024, while property sales to investors totaled ¥45.4 billion against ¥19.8 billion, with Commercial Properties (logistics, hotels, retail facilities, offices) at ¥32.6 billion, Residential (for-rent condominiums) at ¥7.7 billion and Asset Service (asset solutions) at ¥5.0 billion. Figures for property sales to investors are the gross profit and include gains on the sale of non-current assets.
Full-Year Earnings Forecast for FY2026
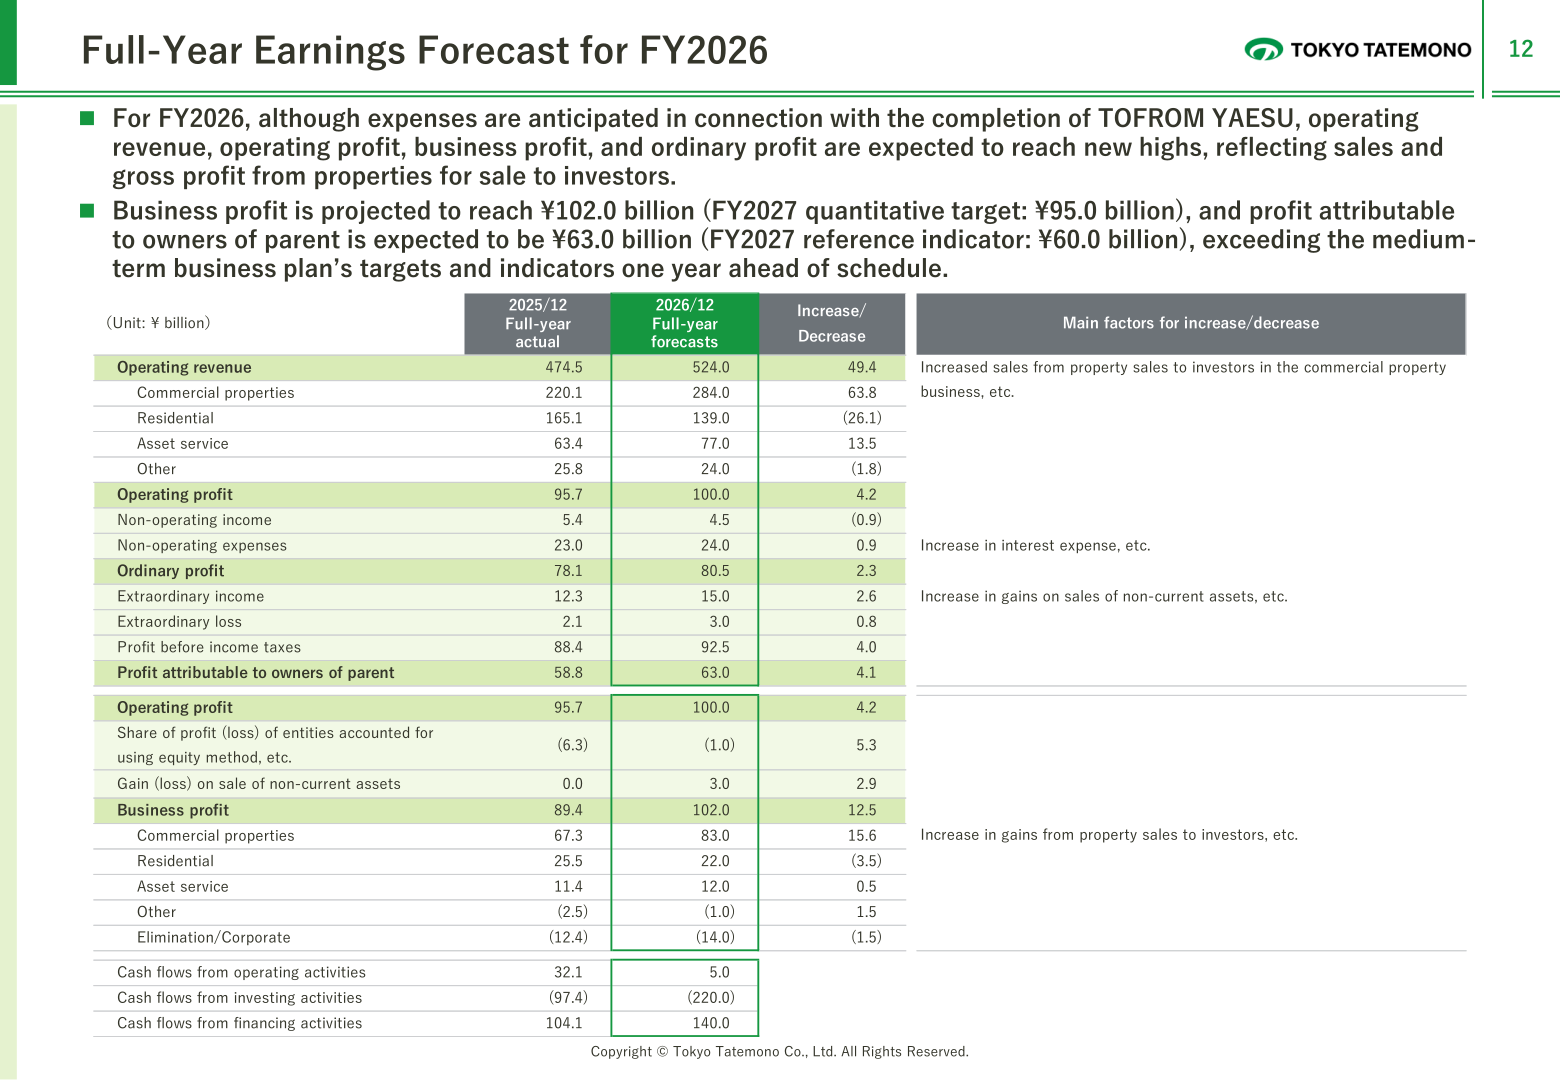
For FY2026, although expenses are anticipated in connection with the completion of TOFROM YAESU, operating revenue, operating profit, business profit and ordinary profit are expected to reach new highs, reflecting sales and gross profit from properties for sale to investors. Business profit is projected to reach ¥102.0 billion (FY2027 quantitative target: ¥95.0 billion) and profit attributable to owners of parent is expected to be ¥63.0 billion (FY2027 reference indicator: ¥60.0 billion), exceeding the medium-term business plan’s targets and indicators one year ahead of schedule.
| Item (¥ billion) | 2025/12 Full-year actual | 2026/12 Full-year forecasts | Increase/Decrease |
|---|---|---|---|
| Operating revenue | 474.5 | 524.0 | 49.4 |
| Operating profit | 95.7 | 100.0 | 4.2 |
| Non-operating income | 5.4 | 4.5 | (0.9) |
| Non-operating expenses | 23.0 | 24.0 | 0.9 |
| Ordinary profit | 78.1 | 80.5 | 2.3 |
| Extraordinary income | 12.3 | 15.0 | 2.6 |
| Extraordinary loss | 2.1 | 3.0 | 0.8 |
| Profit before income taxes | 88.4 | 92.5 | 4.0 |
| Profit attributable to owners of parent | 58.8 | 63.0 | 4.1 |
| Business profit | 89.4 | 102.0 | 12.5 |
| Cash flows from operating activities | 32.1 | 5.0 | – |
| Cash flows from investing activities | (97.4) | (220.0) | – |
| Cash flows from financing activities | 104.1 | 140.0 | – |
For FY2026, the plan is to deliver ¥580.0 billion of gross investment, reflecting investments in large-scale redevelopments and construction costs for ongoing projects, including for-sale condominium and logistics property developments, with ¥375.0 billion in gross recoveries driven by accelerated sales in asset-turnover businesses. A recovery of ¥55.0 billion is expected through the active sales of non-current assets and cross-shareholdings. New operations planned for 2026 comprise TOFROM YAESU, one logistics property, two hotels, two retail facilities and two offices.
Shareholder Returns
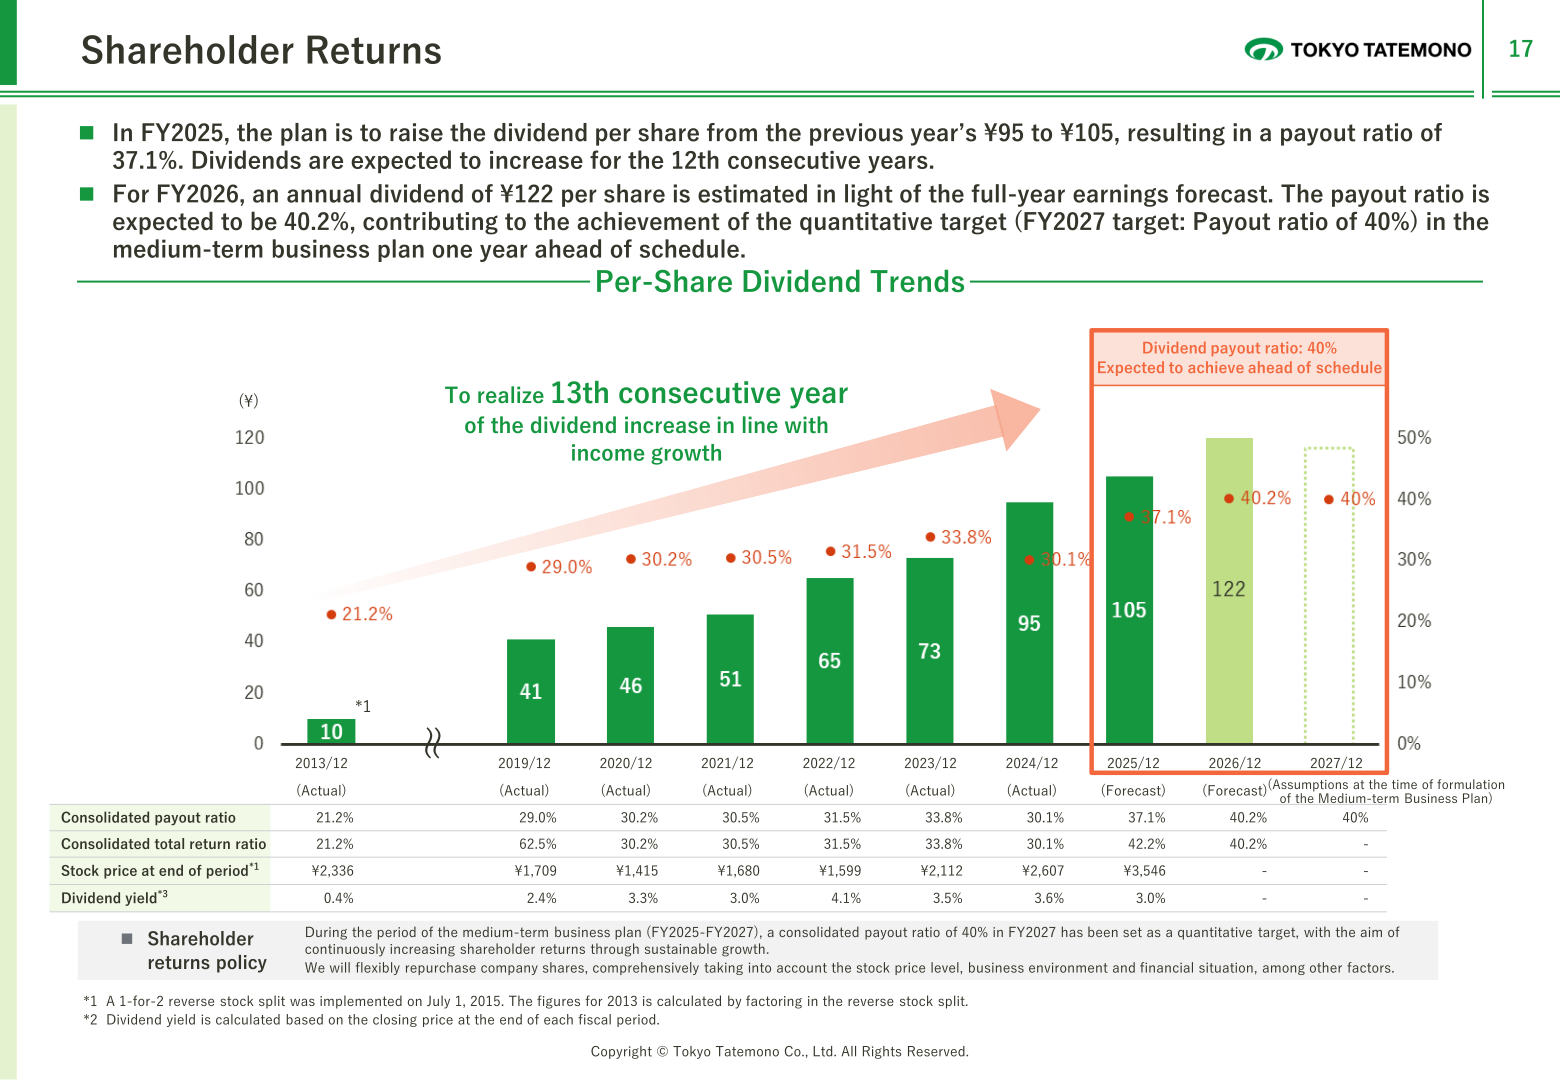
In FY2025, the plan is to raise the dividend per share from the previous year’s ¥95 to ¥105, an increase of ¥10, resulting in a payout ratio of 37.1%. Dividends are expected to increase for the 12th consecutive year. For FY2026, an annual dividend of ¥122 per share (an increase of ¥17) is estimated in light of the full-year earnings forecast; the payout ratio is expected to be 40.2%, contributing to the achievement of the quantitative target (FY2027 target: payout ratio of 40%) in the medium-term business plan one year ahead of schedule. Under the shareholder returns policy, a consolidated payout ratio of 40% in FY2027 has been set as a quantitative target during the medium-term business plan period (FY2025-FY2027), and the company will flexibly repurchase company shares, comprehensively taking into account the stock price level, business environment and financial situation, among other factors.
| Item | 2023/12 (Actual) | 2024/12 (Actual) | 2025/12 (Forecast) | 2026/12 (Forecast) | 2027/12 |
|---|---|---|---|---|---|
| Dividend per share (¥) | 73 | 95 | 105 | 122 | – |
| Consolidated payout ratio | 33.8% | 30.1% | 37.1% | 40.2% | 40% |
| Consolidated total return ratio | 33.8% | 30.1% | 42.2% | 40.2% | – |
| Stock price at end of period | ¥2,112 | ¥2,607 | ¥3,546 | – | – |
| Dividend yield | 3.5% | 3.6% | 3.0% | – | – |
Medium-Term Business Plan and Topics
The company expects to achieve all key quantitative targets set in its medium-term business plan (FY2025-2027) one year ahead of schedule in its full-year earnings forecast for FY2026 (FY2027 targets: business profit of ¥95.0 billion, ROE of 10%, payout ratio of 40%; business profit expected to exceed the target). Based on changes in the business environment since the plan’s formulation and progress toward quantitative targets, the company will accelerate discussions to further refine its growth strategy, including quantitative targets for FY2027 and beyond, and plans to announce the next management plan in February 2027. The fundamental policies are “Accelerating and expanding asset-turnover business” and “strengthening the stable revenue base.”
On management mindful of equity costs and stock prices, ROE in FY2025 was 10.4% and remains at a level exceeding shareholders’ equity costs (CAPM estimate: approx. 8%). PER has generally trended upward throughout FY2025, at 12.69x as of December 30, 2025, with PBR at the end of December 2025 standing at approximately 1.4 times (1.37x as of December 30, 2025).
On the asset-turnover business, the total investment amount (based on decisions made) in properties for sale to investors increased by ¥95.0 billion to approximately ¥790.0 billion, with an estimated gain on sale of approximately ¥145.0 billion. For-sale condominiums of approximately 7,300 units of land bank were secured. On financing, the JCR long-term issuer rating is A, the average interest rate 1.05%, average remaining years 6.2 years, the ratio of long-term debt 100.0% and the ratio of fixed-interest rate 97.5%.
This article is an analysis based on publicly available information and is not a recommendation to buy or sell any specific securities. Investment decisions are your own responsibility.
![[Obayashi] Investors’ Guide 2026 — The Complete 24-Article Breakdown](https://japan-equity.com/wp-content/uploads/2026/07/hub_cover-1024x1024.png)
![[Obayashi] IR & SR Policy — Feeding Dialogue Back into Management](https://japan-equity.com/wp-content/uploads/2026/07/p32_sq-1024x1024.jpg)
![[Obayashi] Real Estate Development — 18.7% Margin, ¥287.7bn Unrealized Gains](https://japan-equity.com/wp-content/uploads/2026/07/p20_sq-1024x1024.jpg)
![[Obayashi] Domestic Civil Engineering — Resilience Spending Supports 9.6% Margin](https://japan-equity.com/wp-content/uploads/2026/07/p11_sq-1024x1024.jpg)
![[Obayashi] Share Price & External Ratings — vs TOPIX, ESG Index Inclusion](https://japan-equity.com/wp-content/uploads/2026/07/p40_sq-1024x1024.jpg)
![[Construction] ¥75.5tn Investment, Shrinking Workforce — Big-5 Market Share](https://japan-equity.com/wp-content/uploads/2026/07/p12_sq-1024x1024.jpg)



![[Obayashi] Capital Policy & Shareholder Returns — ROE 10%+, DOE ~5%, ¥100bn Buyback](https://japan-equity.com/wp-content/uploads/2026/07/p27_sq-1024x1024.jpg)
![[Obayashi] Reducing Cross-Shareholdings — ¥285.2bn Sold in Five Years](https://japan-equity.com/wp-content/uploads/2026/07/p29_sq-1024x1024.jpg)
![[Obayashi] ¥750bn Investment Plan — ¥300bn to Development, ¥190bn to Tech/DX](https://japan-equity.com/wp-content/uploads/2026/07/p30_sq-1024x1024.jpg)
![[Obayashi] MTP2022 KPIs — Operating Profit ~2x Target, ROE 14.4%](https://japan-equity.com/wp-content/uploads/2026/07/p25_sq-1024x1024.jpg)
![[Obayashi] Cash Allocation — ¥420bn Investment CF Over Five Years](https://japan-equity.com/wp-content/uploads/2026/07/p26_sq-1024x1024.jpg)
![[Obayashi] Green Energy — 44 Plants, 344MW, and the Green Hydrogen Challenge](https://japan-equity.com/wp-content/uploads/2026/07/p21_sq-1024x1024.jpg)
![[Obayashi] Tackling the Labor Shortage — Robotics Construction®](https://japan-equity.com/wp-content/uploads/2026/07/p14_sq-1024x1024.jpg)
