
This article is based on publicly available IR materials and is not a recommendation to buy or sell any specific securities.
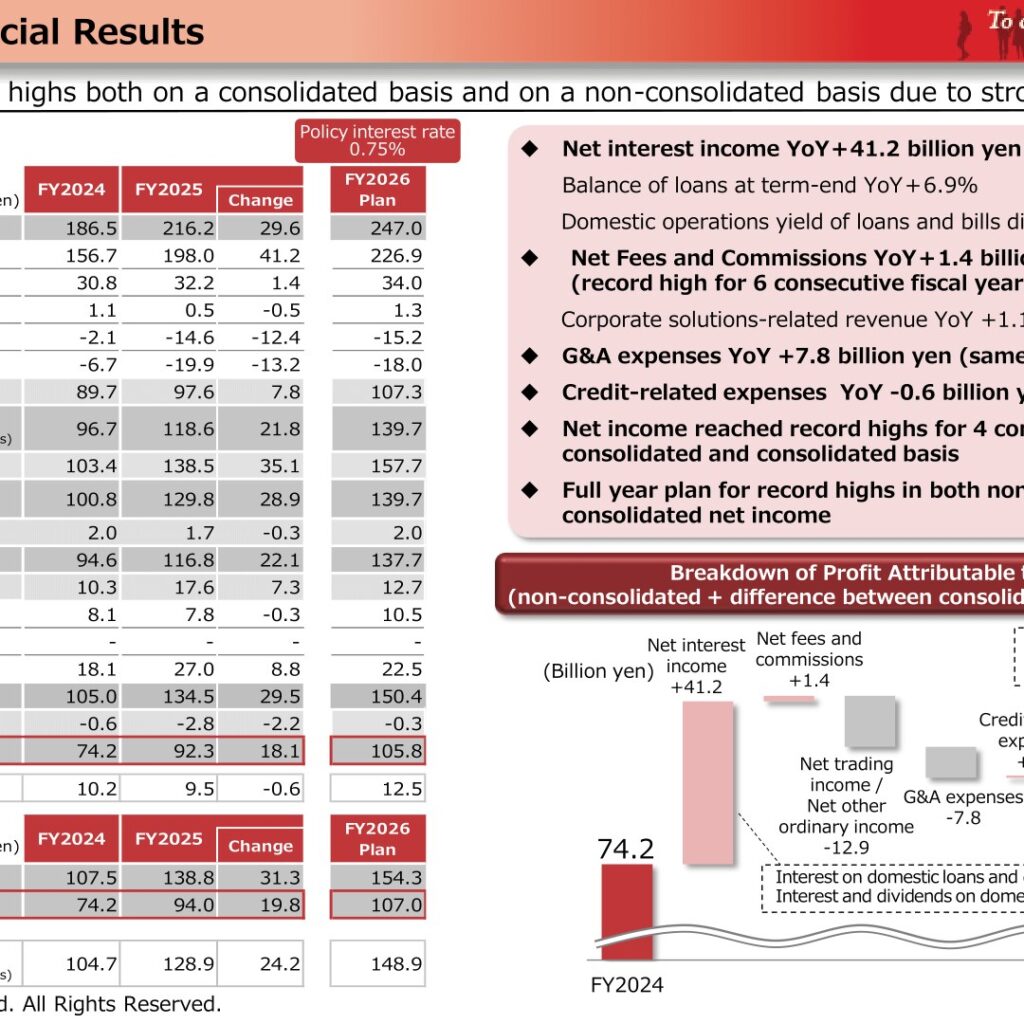
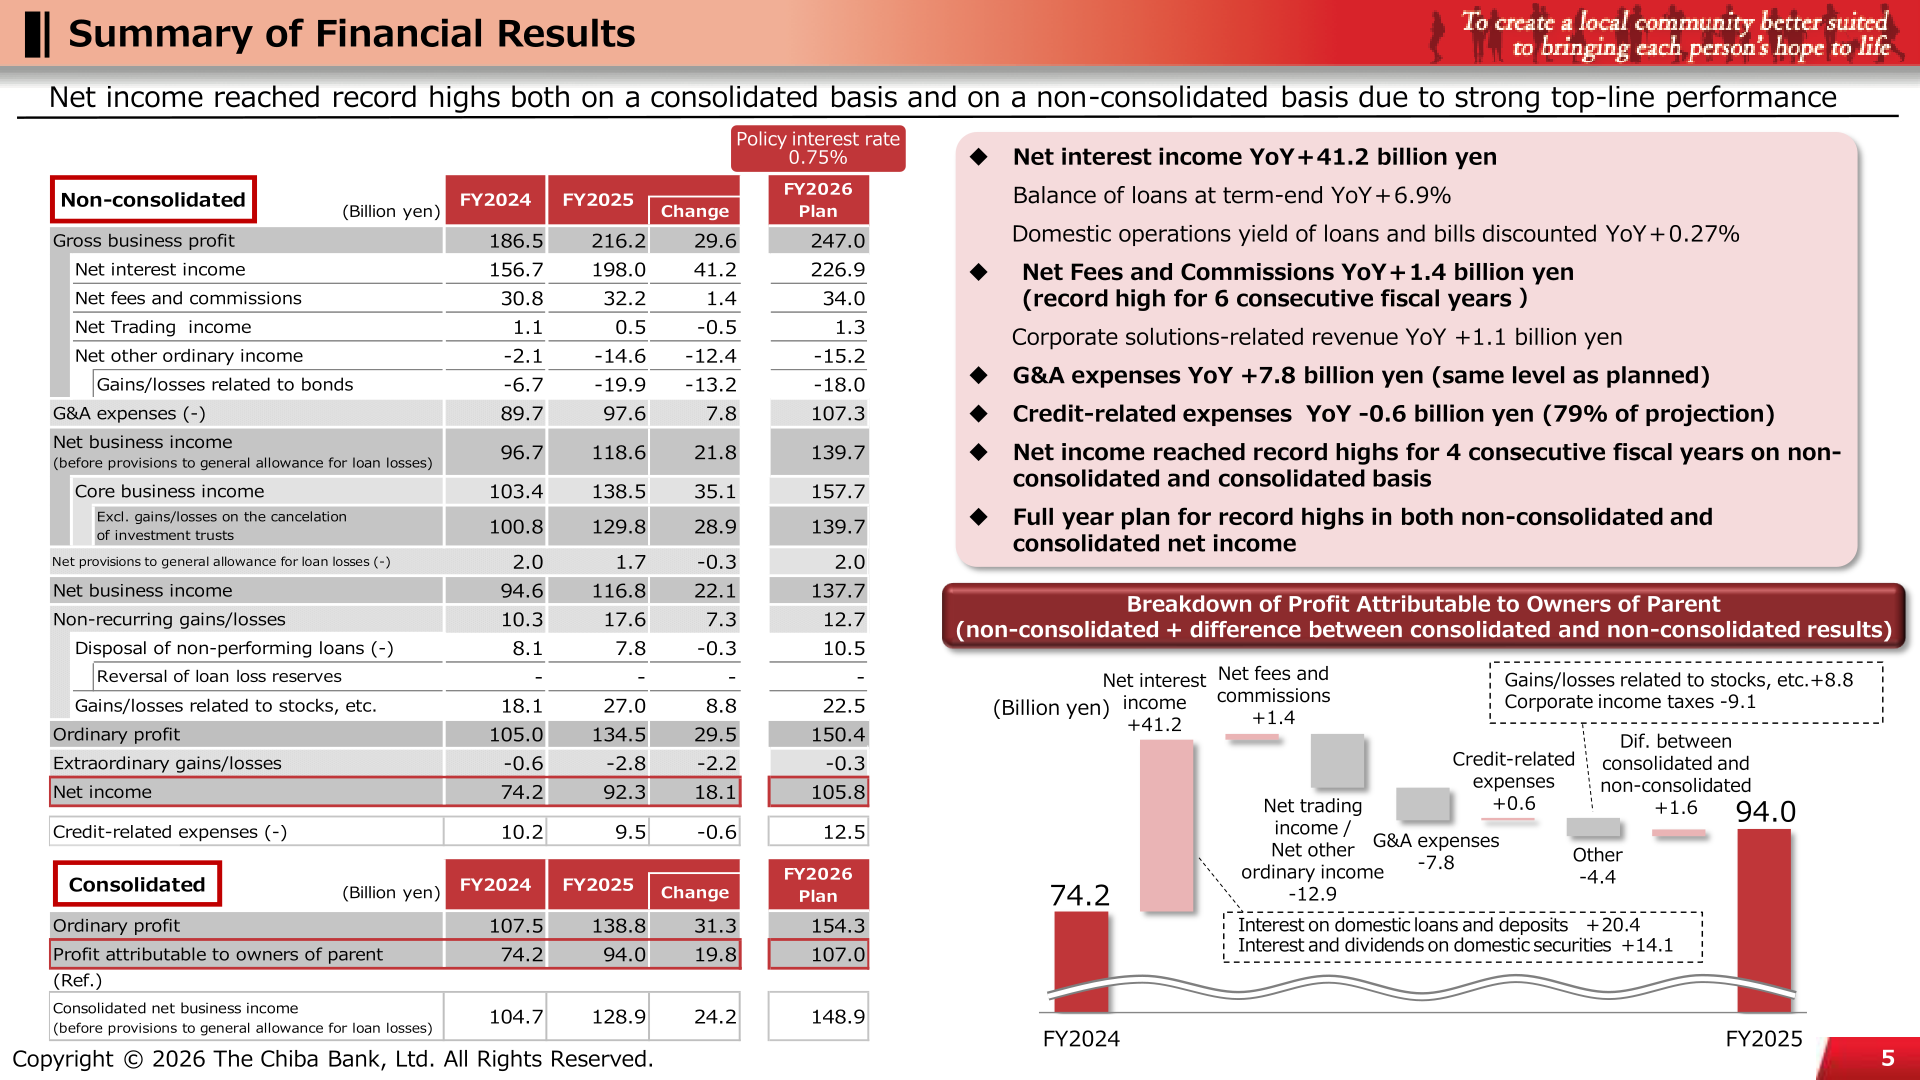
The Chiba Bank reported record net income for FY2025 (the fiscal year ended March 2026) on both a consolidated and a non-consolidated basis, the fourth consecutive fiscal year of record highs. Consolidated ordinary profit rose 31.3 billion yen year on year to 138.8 billion yen, and profit attributable to owners of parent rose 19.8 billion yen to 94.0 billion yen. The main driver was net interest income, which increased 41.2 billion yen on a non-consolidated basis as the balance of loans at term-end grew 6.9% and the domestic operations yield of loans and bills discounted rose 0.27% year on year. For FY2026 the Bank plans record highs again, with consolidated profit attributable to owners of parent of 107.0 billion yen.
Consolidated Results (Full-Year Actual)
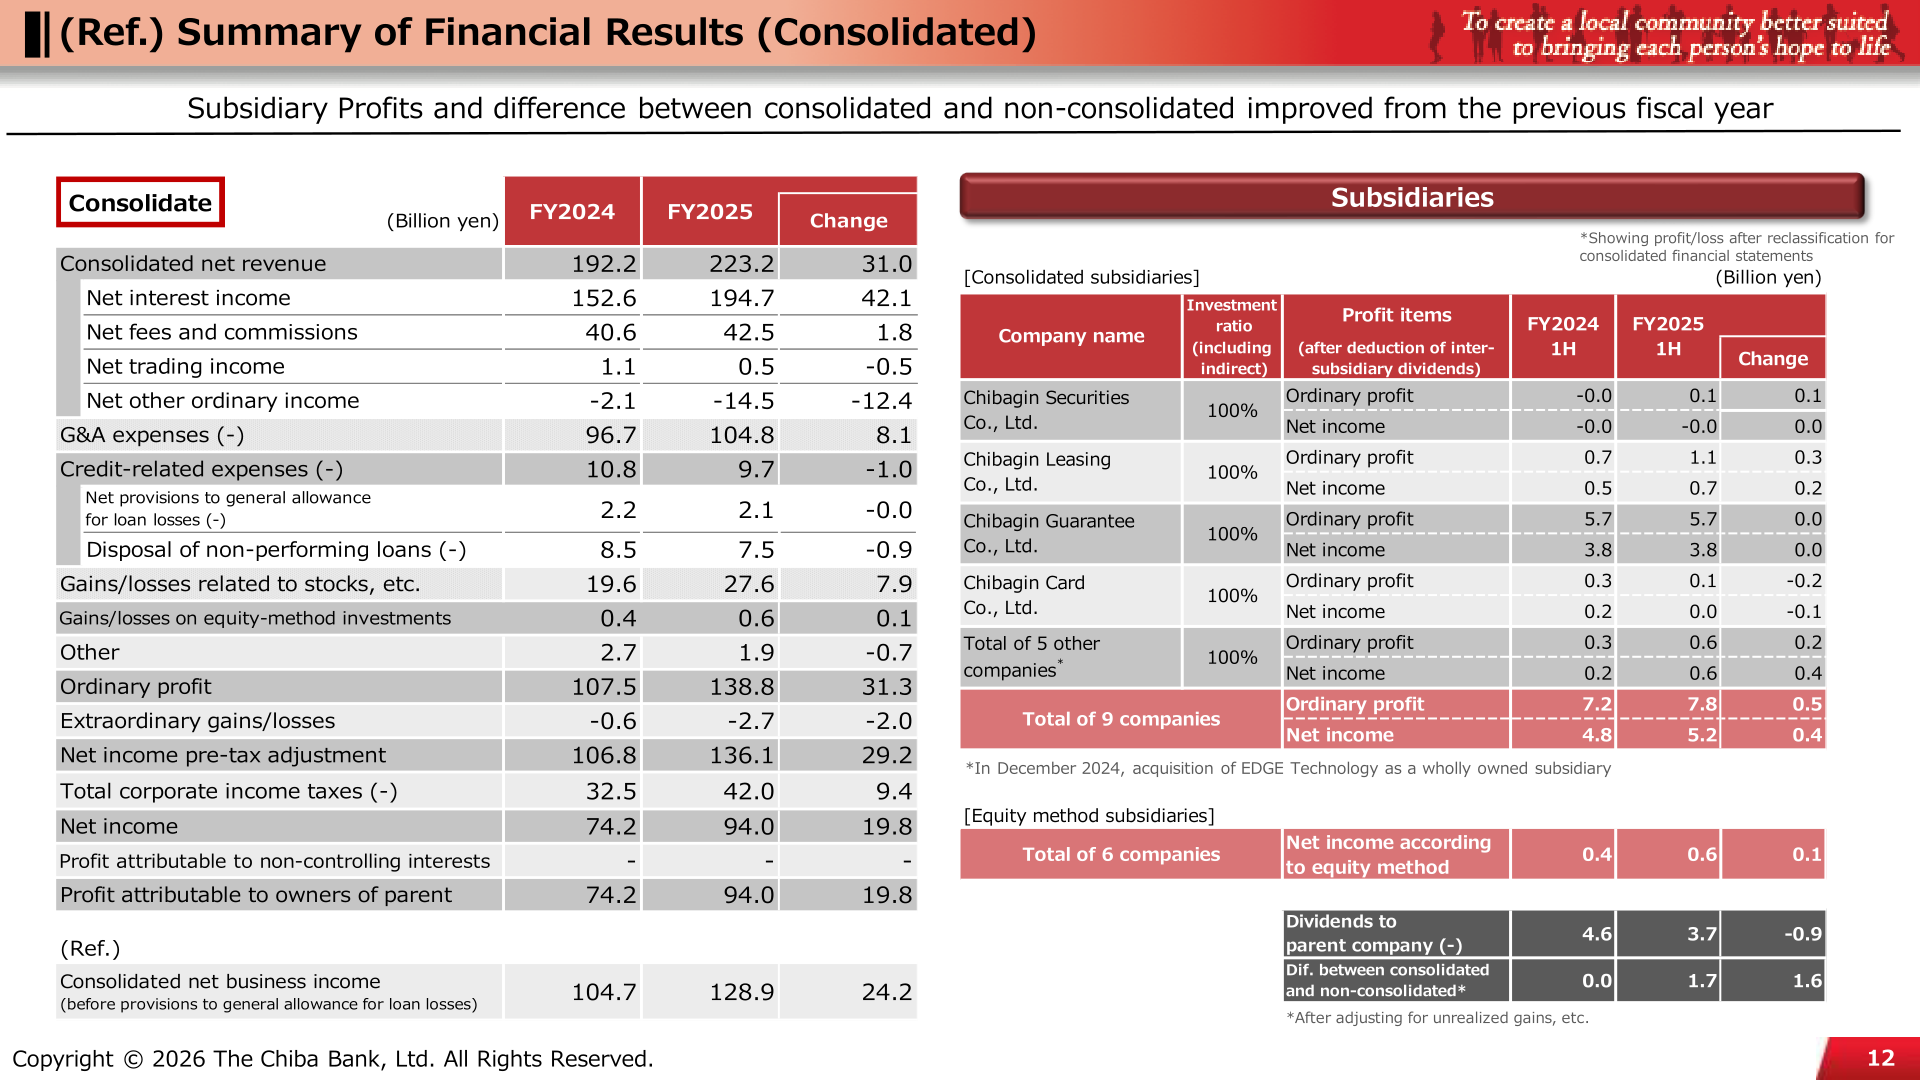
Consolidated net revenue increased 31.0 billion yen to 223.2 billion yen, led by net interest income of 194.7 billion yen (up 42.1 billion yen). Net fees and commissions rose 1.8 billion yen to 42.5 billion yen. G&A expenses increased 8.1 billion yen to 104.8 billion yen, while credit-related expenses declined 1.0 billion yen to 9.7 billion yen. Consolidated net business income (before provisions to general allowance for loan losses) came to 128.9 billion yen, up 24.2 billion yen.
| Item (Billion yen) | FY2024 | FY2025 | Change |
|---|---|---|---|
| Consolidated net revenue | 192.2 | 223.2 | 31.0 |
| Net interest income | 152.6 | 194.7 | 42.1 |
| Net fees and commissions | 40.6 | 42.5 | 1.8 |
| Net trading income | 1.1 | 0.5 | -0.5 |
| Net other ordinary income | -2.1 | -14.5 | -12.4 |
| G&A expenses (-) | 96.7 | 104.8 | 8.1 |
| Credit-related expenses (-) | 10.8 | 9.7 | -1.0 |
| Gains/losses related to stocks, etc. | 19.6 | 27.6 | 7.9 |
| Consolidated net business income (before provisions to general allowance for loan losses) | 104.7 | 128.9 | 24.2 |
| Ordinary profit | 107.5 | 138.8 | 31.3 |
| Total corporate income taxes (-) | 32.5 | 42.0 | 9.4 |
| Profit attributable to owners of parent | 74.2 | 94.0 | 19.8 |
Non-Consolidated Results and Top-Line Drivers
On a non-consolidated basis, gross business profit rose 29.6 billion yen to 216.2 billion yen and core business income rose 35.1 billion yen to 138.5 billion yen. Net income was 92.3 billion yen, up 18.1 billion yen. Gains/losses related to bonds were -19.9 billion yen, reflecting what the Bank describes as improvements to the securities portfolio for the future through strategic yen bonds loss-cutting. Net fees and commissions reached a record high for a sixth consecutive fiscal year at 32.2 billion yen, with corporate solutions-related revenue up 1.1 billion yen. The balance of loans at term-end was 14,147.7 billion yen at March 31, 2026, an increase of 914.4 billion yen (+6.9%), and the balance of deposits was 16,851.4 billion yen, up 582.6 billion yen (+3.5%). In domestic operations, the average yield on loans and bills discounted rose 0.27% and the difference between average yield on loans and deposits widened 0.14%.
| Item (Billion yen) | FY2024 | FY2025 | Change | FY2026 Plan |
|---|---|---|---|---|
| Gross business profit | 186.5 | 216.2 | 29.6 | 247.0 |
| Net interest income | 156.7 | 198.0 | 41.2 | 226.9 |
| Net fees and commissions | 30.8 | 32.2 | 1.4 | 34.0 |
| Net trading income | 1.1 | 0.5 | -0.5 | 1.3 |
| Net other ordinary income | -2.1 | -14.6 | -12.4 | -15.2 |
| Gains/losses related to bonds | -6.7 | -19.9 | -13.2 | -18.0 |
| G&A expenses (-) | 89.7 | 97.6 | 7.8 | 107.3 |
| Net business income (before provisions to general allowance for loan losses) | 96.7 | 118.6 | 21.8 | 139.7 |
| Core business income | 103.4 | 138.5 | 35.1 | 157.7 |
| Ordinary profit | 105.0 | 134.5 | 29.5 | 150.4 |
| Net income | 74.2 | 92.3 | 18.1 | 105.8 |
| Credit-related expenses (-) | 10.2 | 9.5 | -0.6 | 12.5 |
Group Company Results
The nine consolidated subsidiaries posted combined ordinary profit of 7.8 billion yen and combined net income of 5.2 billion yen (figures shown after deduction of inter-subsidiary dividends), and the difference between consolidated and non-consolidated results improved to 1.7 billion yen from 0.0 billion yen. Chibagin Guarantee remained the largest contributor with net income of 3.8 billion yen. In the slide, the column headers of this subsidiary table are printed as “1H”; the difference between consolidated and non-consolidated results shown in the same table matches the full-year change of +1.6 billion yen presented on page 5.
| Company (Billion yen) | Profit item | FY2024 | FY2025 | Change |
|---|---|---|---|---|
| Chibagin Securities Co., Ltd. (100%) | Ordinary profit | -0.0 | 0.1 | 0.1 |
| Chibagin Securities Co., Ltd. (100%) | Net income | -0.0 | -0.0 | 0.0 |
| Chibagin Leasing Co., Ltd. (100%) | Ordinary profit | 0.7 | 1.1 | 0.3 |
| Chibagin Leasing Co., Ltd. (100%) | Net income | 0.5 | 0.7 | 0.2 |
| Chibagin Guarantee Co., Ltd. (100%) | Ordinary profit | 5.7 | 5.7 | 0.0 |
| Chibagin Guarantee Co., Ltd. (100%) | Net income | 3.8 | 3.8 | 0.0 |
| Chibagin Card Co., Ltd. (100%) | Ordinary profit | 0.3 | 0.1 | -0.2 |
| Chibagin Card Co., Ltd. (100%) | Net income | 0.2 | 0.0 | -0.1 |
| Total of 5 other companies | Ordinary profit | 0.3 | 0.6 | 0.2 |
| Total of 5 other companies | Net income | 0.2 | 0.6 | 0.4 |
| Total of 9 companies | Ordinary profit | 7.2 | 7.8 | 0.5 |
| Total of 9 companies | Net income | 4.8 | 5.2 | 0.4 |
| Equity method subsidiaries (total of 6 companies) | Net income according to equity method | 0.4 | 0.6 | 0.1 |
| Difference between consolidated and non-consolidated | After adjusting for unrealized gains, etc. | 0.0 | 1.7 | 1.6 |
Efficiency, Asset Quality and Capital
Non-consolidated OHR improved 4.98 points to 41.58% and consolidated OHR improved 4.97 points to 41.50%, as top-line growth outpaced the increase in expenses from strategic investments. Credit-related expenses were 9.5 billion yen, which the Bank notes was 79% of the projection, and the net credit cost ratio was 6bp. The non-performing loan ratio under the Financial Reconstruction Act fell 0.06 points to 0.84%. The consolidated capital adequacy ratio and CET1 ratio were both 15.02% at March 31, 2026; on a rough calculation on a Basel III finalization-completed basis they were 12.80%, and the CET1 ratio excluding unrealized gains/losses on securities was 11.68%, within the Bank’s target range of 10.5% to 11.5%.
| Item | 3/2025 (FY2024) | 3/2026 (FY2025) |
|---|---|---|
| Credit-related expenses (-) (Billion yen) | 10.2 | 9.5 |
| Net credit cost ratio (-) | 7bp | 6bp |
| Non-performing loan ratio (Financial Reconstruction Act) | 0.91% | 0.84% |
| OHR (non-consolidated) | 46.56% | 41.58% |
| OHR (consolidated) | 46.47% | 41.50% |
| Total capital adequacy ratio (consolidated, %) | 15.04 | 15.02 |
| CET1 ratio (consolidated, %) | 15.04 | 15.02 |
| CET1 ratio excluding unrealized gains/losses on securities (%) | 13.92 | 13.70 |
| Balance of loans at term-end (Billion yen) | 13,233.3 | 14,147.7 |
| Balance of deposits at term-end (Billion yen) | 16,268.7 | 16,851.4 |
FY2026 Forecast
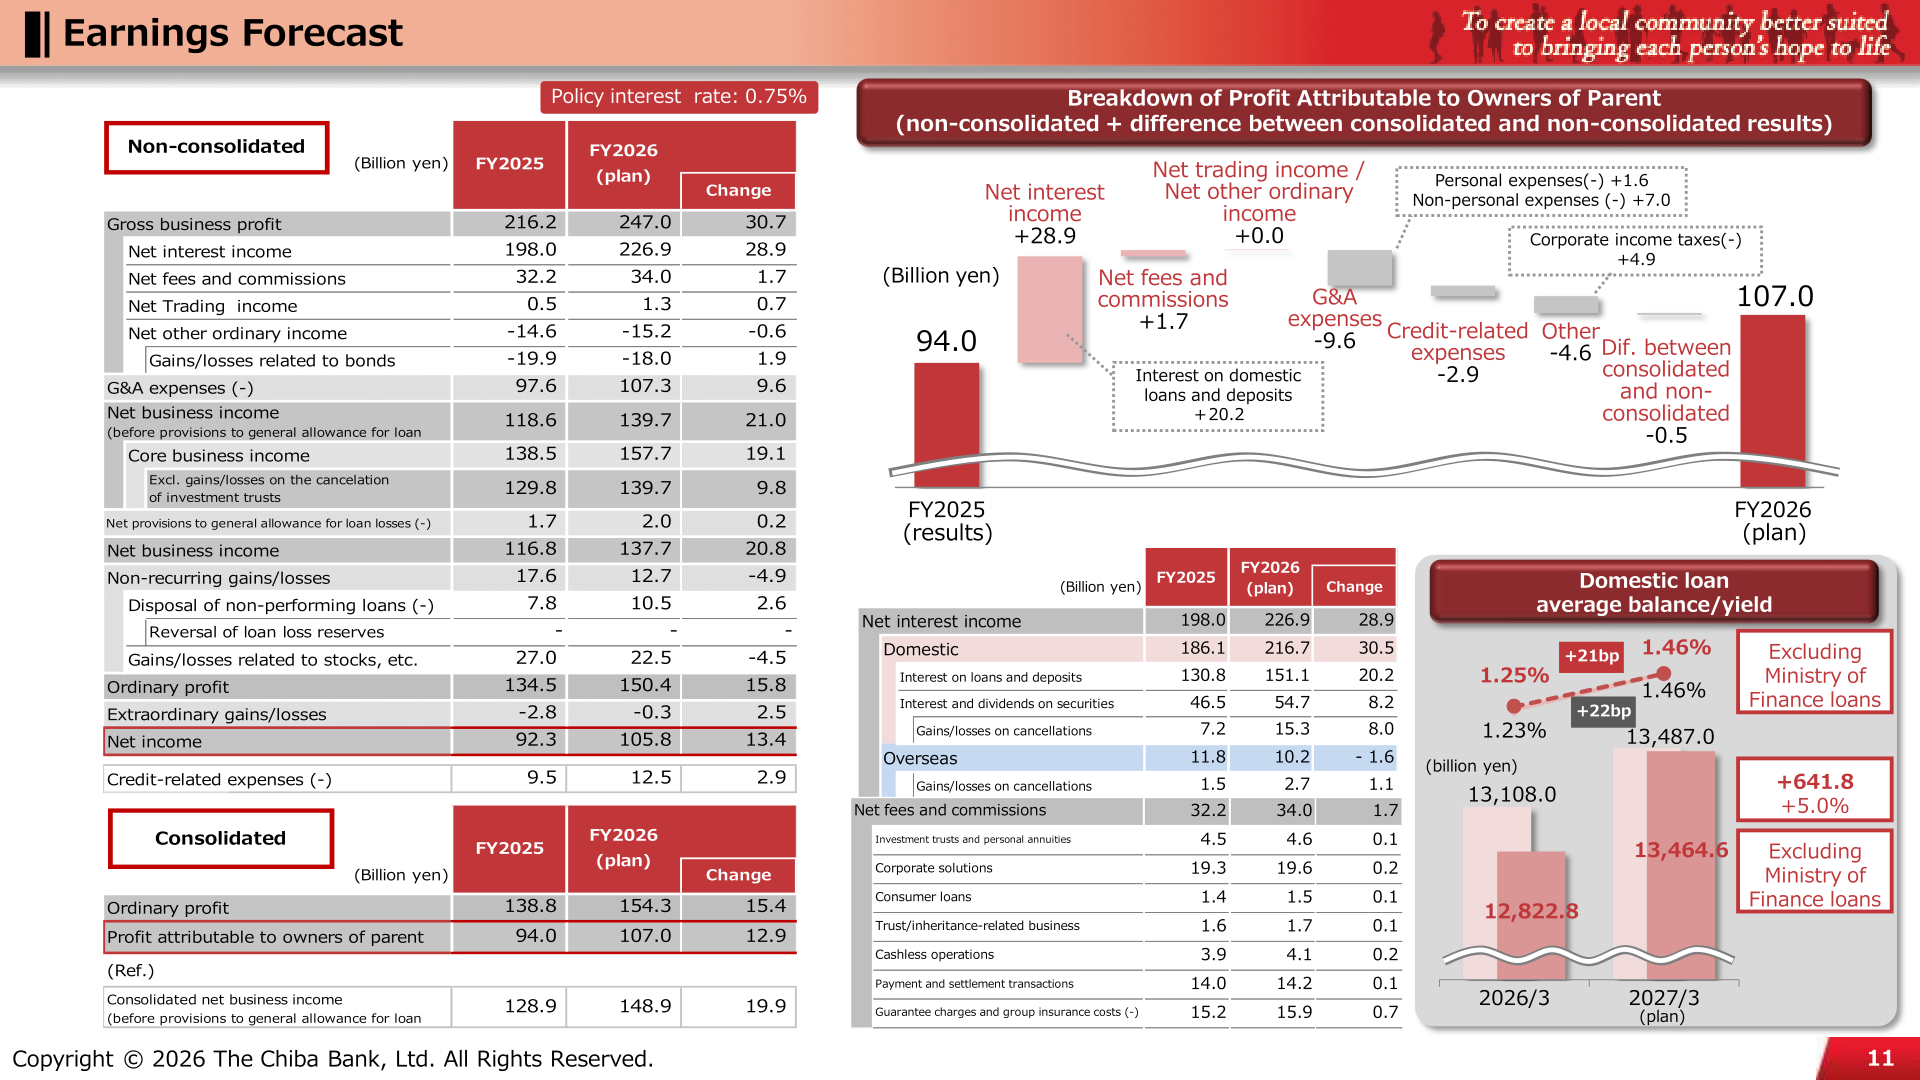
For FY2026 the Bank plans record highs for both non-consolidated and consolidated net income: non-consolidated net income of 105.8 billion yen (up 13.4 billion yen) and consolidated profit attributable to owners of parent of 107.0 billion yen (up 12.9 billion yen). The plan assumes a policy interest rate of 0.75%. Net interest income is planned at 226.9 billion yen, with domestic interest on loans and deposits rising 20.2 billion yen; the domestic loan average balance is planned at 13,487.0 billion yen with a yield of 1.46%, against 13,108.0 billion yen and 1.23% in FY2025. Credit-related expenses are planned at 12.5 billion yen.
| Item (Billion yen) | FY2025 | FY2026 (plan) | Change |
|---|---|---|---|
| Ordinary profit (consolidated) | 138.8 | 154.3 | 15.4 |
| Profit attributable to owners of parent | 94.0 | 107.0 | 12.9 |
| Consolidated net business income (before provisions to general allowance for loan losses) | 128.9 | 148.9 | 19.9 |
| Ordinary profit (non-consolidated) | 134.5 | 150.4 | 15.8 |
| Net income (non-consolidated) | 92.3 | 105.8 | 13.4 |
| Net interest income (non-consolidated) | 198.0 | 226.9 | 28.9 |
| Net fees and commissions (non-consolidated) | 32.2 | 34.0 | 1.7 |
| G&A expenses (-) (non-consolidated) | 97.6 | 107.3 | 9.6 |
| Credit-related expenses (-) (non-consolidated) | 9.5 | 12.5 | 2.9 |
Shareholder Returns
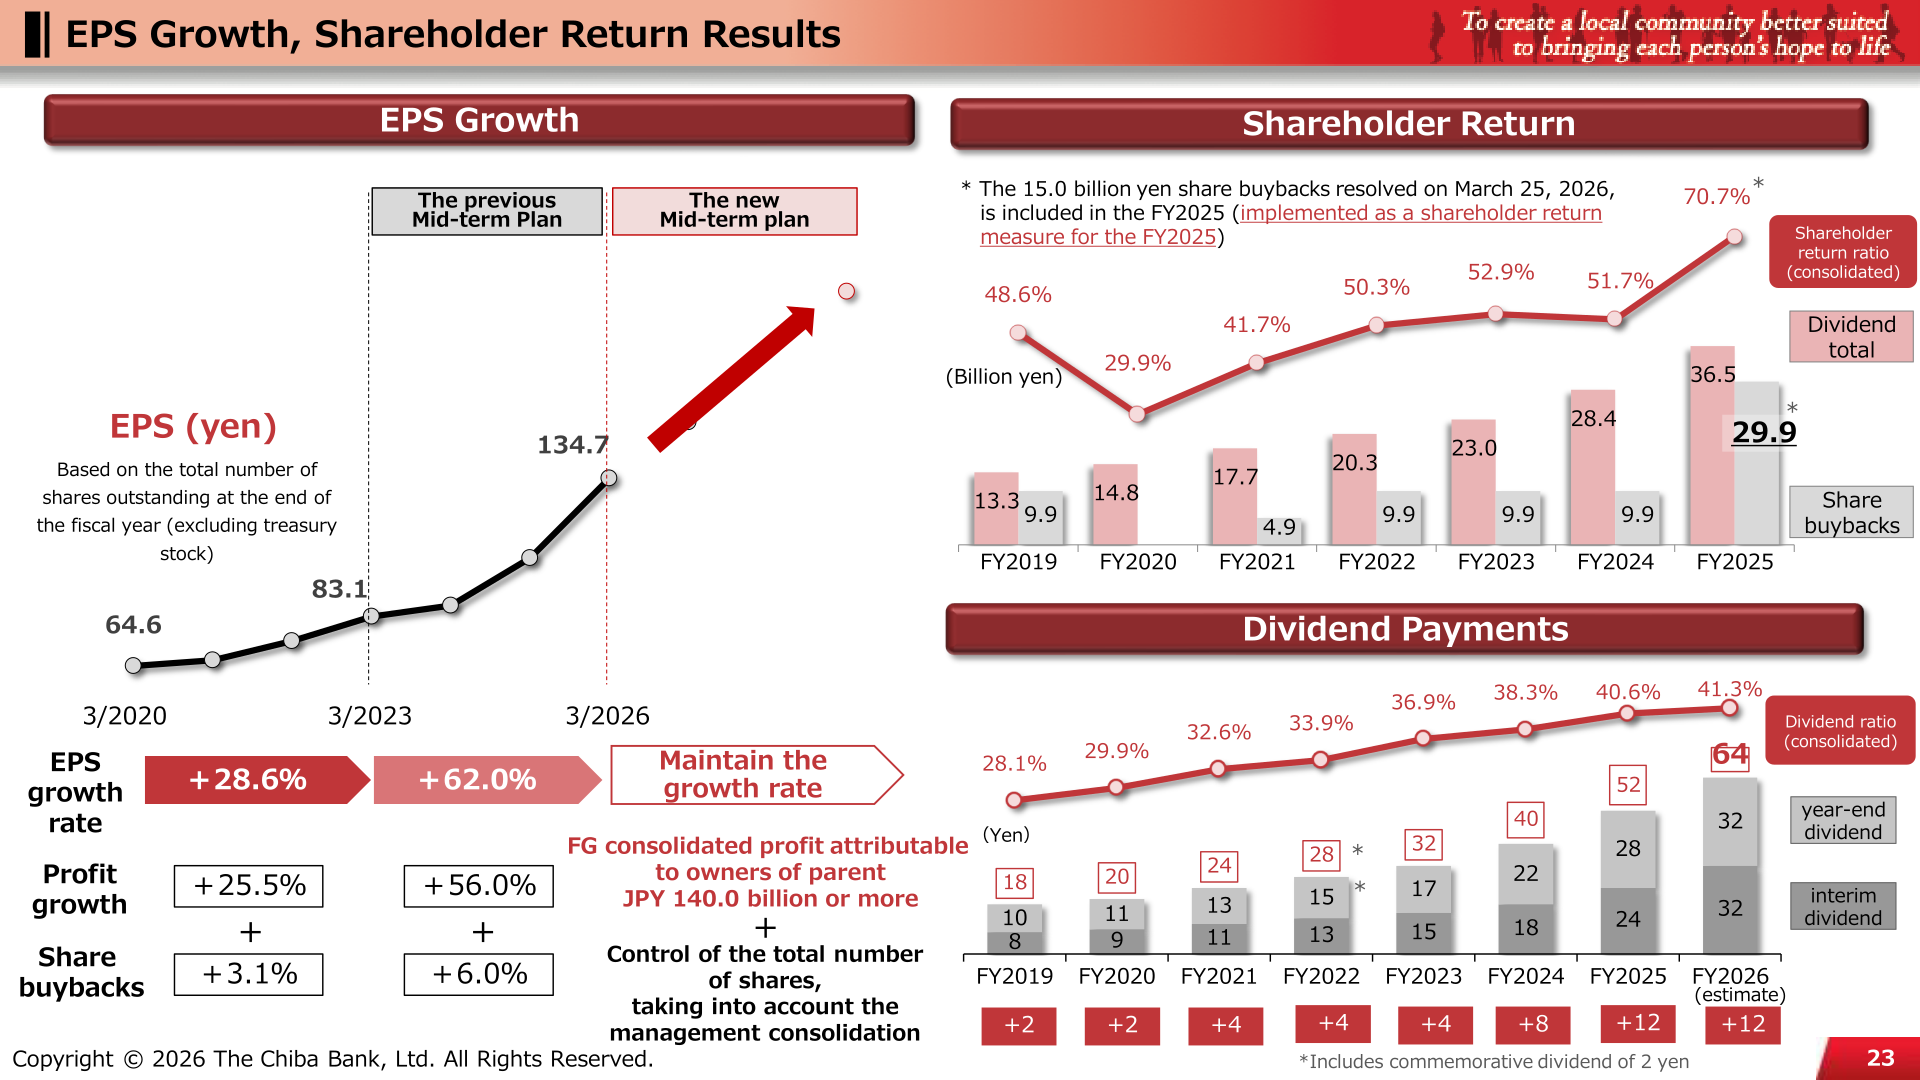
The annual dividend for FY2025 was 52 yen per share (interim 24 yen, year-end 28 yen), an increase of 12 yen, giving a consolidated dividend ratio of 40.6%. Together with share buybacks of 29.9 billion yen — including the 15.0 billion yen buyback resolved on March 25, 2026, which is counted as an FY2025 shareholder return measure — the consolidated shareholder return ratio reached 70.7%. For FY2026 the Bank estimates an annual dividend of 64 yen (interim 32 yen, year-end 32 yen), a further increase of 12 yen, for a consolidated dividend ratio of 41.3%. Under the new Mid-term Plan the return policy is raised to a dividend payout ratio of 40% or more, combined with flexible share buybacks focused on EPS growth, while the CET1 ratio excluding unrealized gains/losses on securities is managed within a range of 10.5% to 11.5%. EPS reached 134.7 yen at March 2026.
| Item | FY2024 | FY2025 | FY2026 (estimate) |
|---|---|---|---|
| Interim dividend (Yen) | 18 | 24 | 32 |
| Year-end dividend (Yen) | 22 | 28 | 32 |
| Annual dividend (Yen) | 40 | 52 | 64 |
| Dividend ratio (consolidated) | 38.3% | 40.6% | 41.3% |
| Dividend total (Billion yen) | 28.4 | 36.5 | – |
| Share buybacks (Billion yen) | 9.9 | 29.9 | – |
| Shareholder return ratio (consolidated) | 51.7% | 70.7% | – |
The 16th Mid-term Plan and Management Consolidation
The 16th Mid-term Plan, “Engagement Bank Group – Phase 2 -“, covers April 2026 to March 2029 (FY2026 to FY2028). Its management KPIs are a consolidated ROE (net assets basis) of approximately 11%, profit attributable to owners of parent of 140.0 billion yen or more, a consolidated Common Equity Tier 1 ratio of 10.5% to 11.5% on a Basel III full implementation finalization basis excluding valuation differences on securities, and a consolidated OHR of approximately 40%; these are combined figures for the new financial group following the management consolidation. Consolidated ROE (net assets basis) was 7.83% in FY2025, and the Bank states it achieved a PBR of over 1.0x during the previous Mid-term Plan. Group investment of 50.0 billion yen is planned over the three years, of which 30.0 billion yen is strategic and 5.0 billion yen is AI-related, and a Digital Strategy & Business Unit is being newly established.
On March 25, 2026 the Bank executed a definitive agreement on a management consolidation with The Chiba Kogyo Bank, Ltd., to be carried out through a joint share transfer at a share transfer ratio of 1:1. The holding company is expected to be incorporated and listed on April 1, 2027, with the two banks’ shares expected to be delisted from the Tokyo Stock Exchange on March 30, 2027. The Bank expects annual synergy of 4.0 to 6.0 billion yen two years after the consolidation (FY2028) and 12.0 to 16.0 billion yen five years after (FY2031) on a net business income basis, in addition to a system integration effect.
This article is an analysis based on publicly available information and is not a recommendation to buy or sell any specific securities. Investment decisions are your own responsibility.
![[Obayashi] Investors’ Guide 2026 — The Complete 24-Article Breakdown](https://japan-equity.com/wp-content/uploads/2026/07/hub_cover-1024x1024.png)
![[Obayashi] IR & SR Policy — Feeding Dialogue Back into Management](https://japan-equity.com/wp-content/uploads/2026/07/p32_sq-1024x1024.jpg)
![[Obayashi] Real Estate Development — 18.7% Margin, ¥287.7bn Unrealized Gains](https://japan-equity.com/wp-content/uploads/2026/07/p20_sq-1024x1024.jpg)
![[Obayashi] Domestic Civil Engineering — Resilience Spending Supports 9.6% Margin](https://japan-equity.com/wp-content/uploads/2026/07/p11_sq-1024x1024.jpg)
![[Obayashi] Share Price & External Ratings — vs TOPIX, ESG Index Inclusion](https://japan-equity.com/wp-content/uploads/2026/07/p40_sq-1024x1024.jpg)
![[Construction] ¥75.5tn Investment, Shrinking Workforce — Big-5 Market Share](https://japan-equity.com/wp-content/uploads/2026/07/p12_sq-1024x1024.jpg)



![[Obayashi] Capital Policy & Shareholder Returns — ROE 10%+, DOE ~5%, ¥100bn Buyback](https://japan-equity.com/wp-content/uploads/2026/07/p27_sq-1024x1024.jpg)
![[Obayashi] Reducing Cross-Shareholdings — ¥285.2bn Sold in Five Years](https://japan-equity.com/wp-content/uploads/2026/07/p29_sq-1024x1024.jpg)
![[Obayashi] ¥750bn Investment Plan — ¥300bn to Development, ¥190bn to Tech/DX](https://japan-equity.com/wp-content/uploads/2026/07/p30_sq-1024x1024.jpg)
![[Obayashi] MTP2022 KPIs — Operating Profit ~2x Target, ROE 14.4%](https://japan-equity.com/wp-content/uploads/2026/07/p25_sq-1024x1024.jpg)
![[Obayashi] Cash Allocation — ¥420bn Investment CF Over Five Years](https://japan-equity.com/wp-content/uploads/2026/07/p26_sq-1024x1024.jpg)
![[Obayashi] Green Energy — 44 Plants, 344MW, and the Green Hydrogen Challenge](https://japan-equity.com/wp-content/uploads/2026/07/p21_sq-1024x1024.jpg)
![[Obayashi] Tackling the Labor Shortage — Robotics Construction®](https://japan-equity.com/wp-content/uploads/2026/07/p14_sq-1024x1024.jpg)
