
This article is based on publicly available IR materials and is not a recommendation to buy or sell any specific securities.
Note: XEBIO Holdings’ results materials label fiscal periods by period-end date (e.g., “2026/3” for the fiscal year ended March 31, 2026) rather than an “FY” number. This article follows japan-equity.com’s convention of designating the most recently completed fiscal year as FY2025 and the following fiscal year as FY2026.
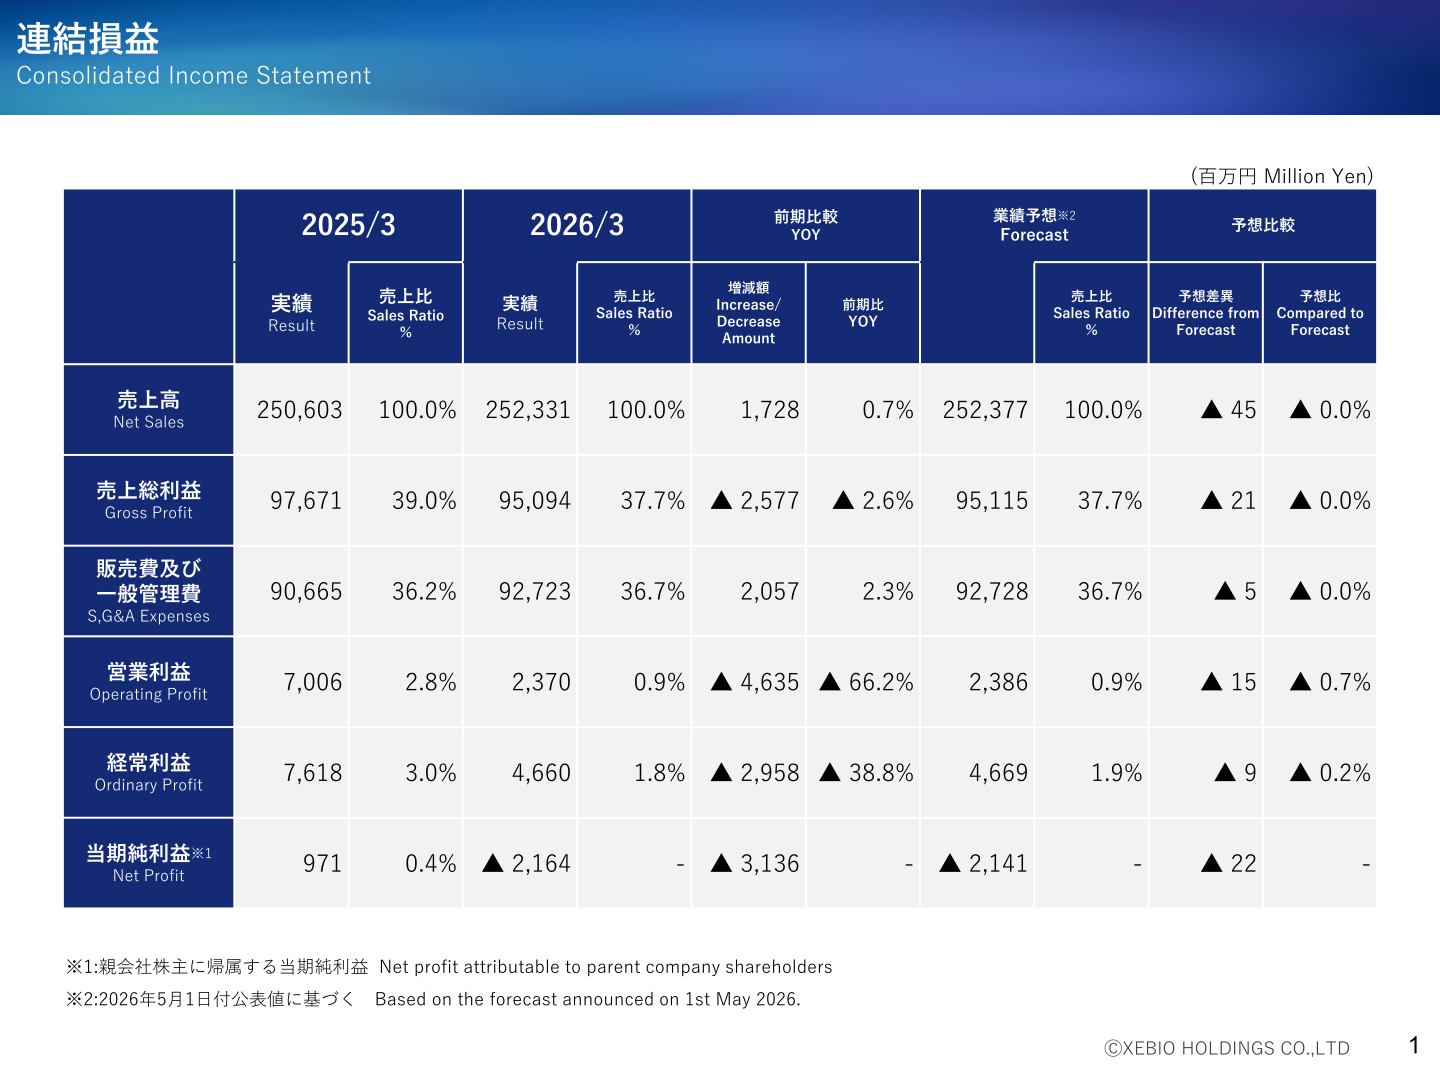
XEBIO Holdings Co., Ltd. (8281) released its results for the fiscal year ended March 31, 2026 on May 15, 2026. Consolidated net sales rose 0.7% year on year to ¥252,331 million, but a narrower gross margin and higher SG&A expenses pushed operating profit down 66.2% to ¥2,370 million and ordinary profit down 38.8% to ¥4,660 million. The company posted a net loss of ¥2,164 million, compared with net profit of ¥971 million in the prior fiscal year. For the fiscal year ending March 31, 2027, XEBIO Holdings forecasts a rebound, with operating profit projected to rise 195.2% to ¥7,000 million and a return to net profit of ¥7,500 million.
Consolidated Results (Full-Year Actual)
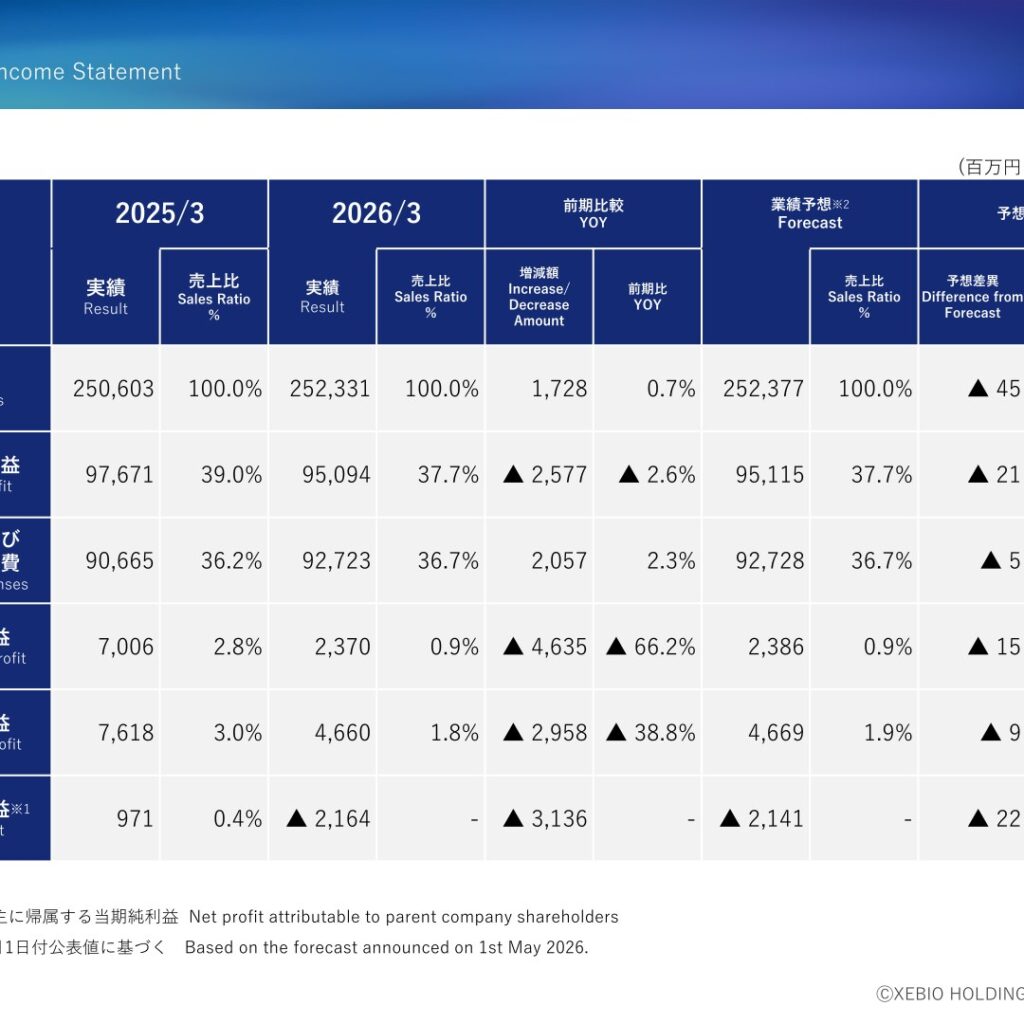
Gross profit declined 2.6% to ¥95,094 million as gross margin fell to 37.7% from 39.0% a year earlier. SG&A expenses increased 2.3% to ¥92,723 million, equal to 36.7% of net sales. As a result, operating profit fell 66.2% to ¥2,370 million (0.9% operating margin) and ordinary profit fell 38.8% to ¥4,660 million. Net profit attributable to parent company shareholders swung to a loss of ¥2,164 million from a profit of ¥971 million in the prior fiscal year. Actual results were close to the company’s most recent forecast, announced on May 1, 2026, which had projected net sales of ¥252,377 million and a net loss of ¥2,141 million.
| Item | FY2025 (Actual) | FY2024 (Actual) | YoY Change (Amount) | YoY Change (%) |
|---|---|---|---|---|
| Net Sales (¥ million) | 252,331 | 250,603 | 1,728 | 0.7% |
| Gross Profit (¥ million) | 95,094 | 97,671 | ▲2,577 | ▲2.6% |
| SG&A Expenses (¥ million) | 92,723 | 90,665 | 2,057 | 2.3% |
| Operating Profit (¥ million) | 2,370 | 7,006 | ▲4,635 | ▲66.2% |
| Ordinary Profit (¥ million) | 4,660 | 7,618 | ▲2,958 | ▲38.8% |
| Net Profit (¥ million) | ▲2,164 | 971 | ▲3,136 | – |
Segment Results
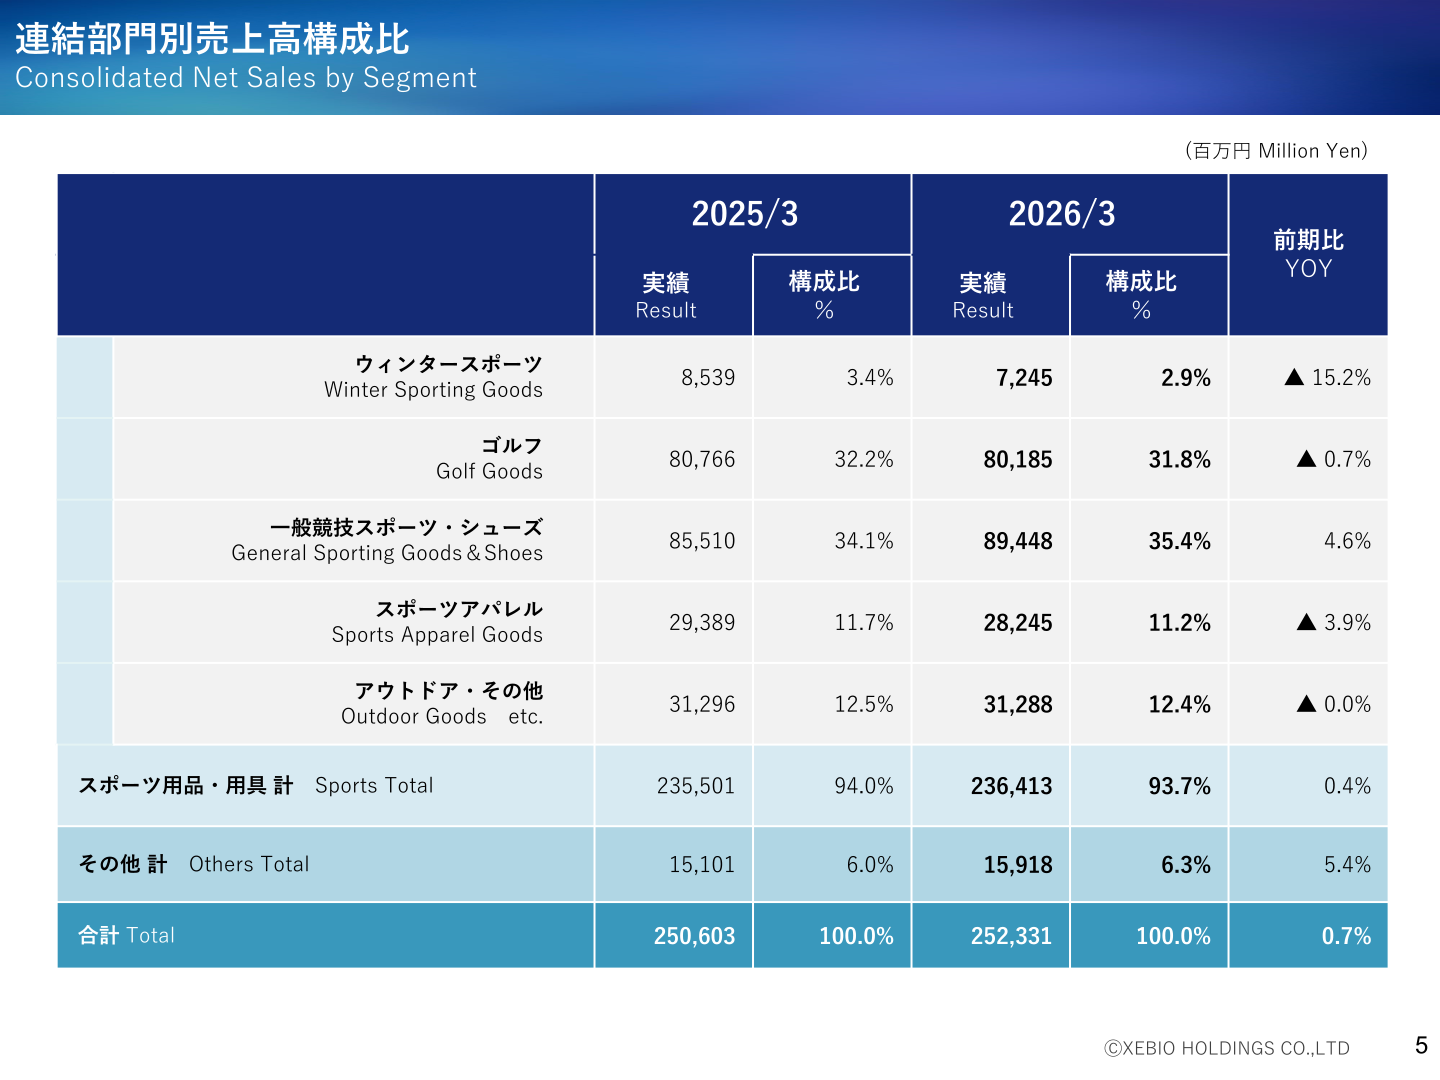
By segment, General Sporting Goods & Shoes was the largest contributor to growth, rising 4.6% to ¥89,448 million and increasing its share of net sales to 35.4% from 34.1%. Golf Goods, the largest segment by sales, declined 0.7% to ¥80,185 million. Winter Sporting Goods fell 15.2% to ¥7,245 million, and Sports Apparel Goods declined 3.9% to ¥28,245 million. Outdoor Goods etc. was essentially flat at ¥31,288 million. Total sales of sporting goods and equipment rose 0.4% to ¥236,413 million, while sales outside the core sports category (Others) rose 5.4% to ¥15,918 million. The number of stores increased to 972 at the end of March 2026 from 887 a year earlier, as 130 new stores were opened against 45 closures.
| Segment | FY2025 (Actual, ¥ million) | FY2025 Share of Sales | FY2024 (Actual, ¥ million) | FY2024 Share of Sales | YoY Change (%) |
|---|---|---|---|---|---|
| Winter Sporting Goods | 7,245 | 2.9% | 8,539 | 3.4% | ▲15.2% |
| Golf Goods | 80,185 | 31.8% | 80,766 | 32.2% | ▲0.7% |
| General Sporting Goods & Shoes | 89,448 | 35.4% | 85,510 | 34.1% | 4.6% |
| Sports Apparel Goods | 28,245 | 11.2% | 29,389 | 11.7% | ▲3.9% |
| Outdoor Goods etc. | 31,288 | 12.4% | 31,296 | 12.5% | ▲0.0% |
| Sports Total | 236,413 | 93.7% | 235,501 | 94.0% | 0.4% |
| Others Total | 15,918 | 6.3% | 15,101 | 6.0% | 5.4% |
| Total | 252,331 | 100.0% | 250,603 | 100.0% | 0.7% |
FY2026 Forecast
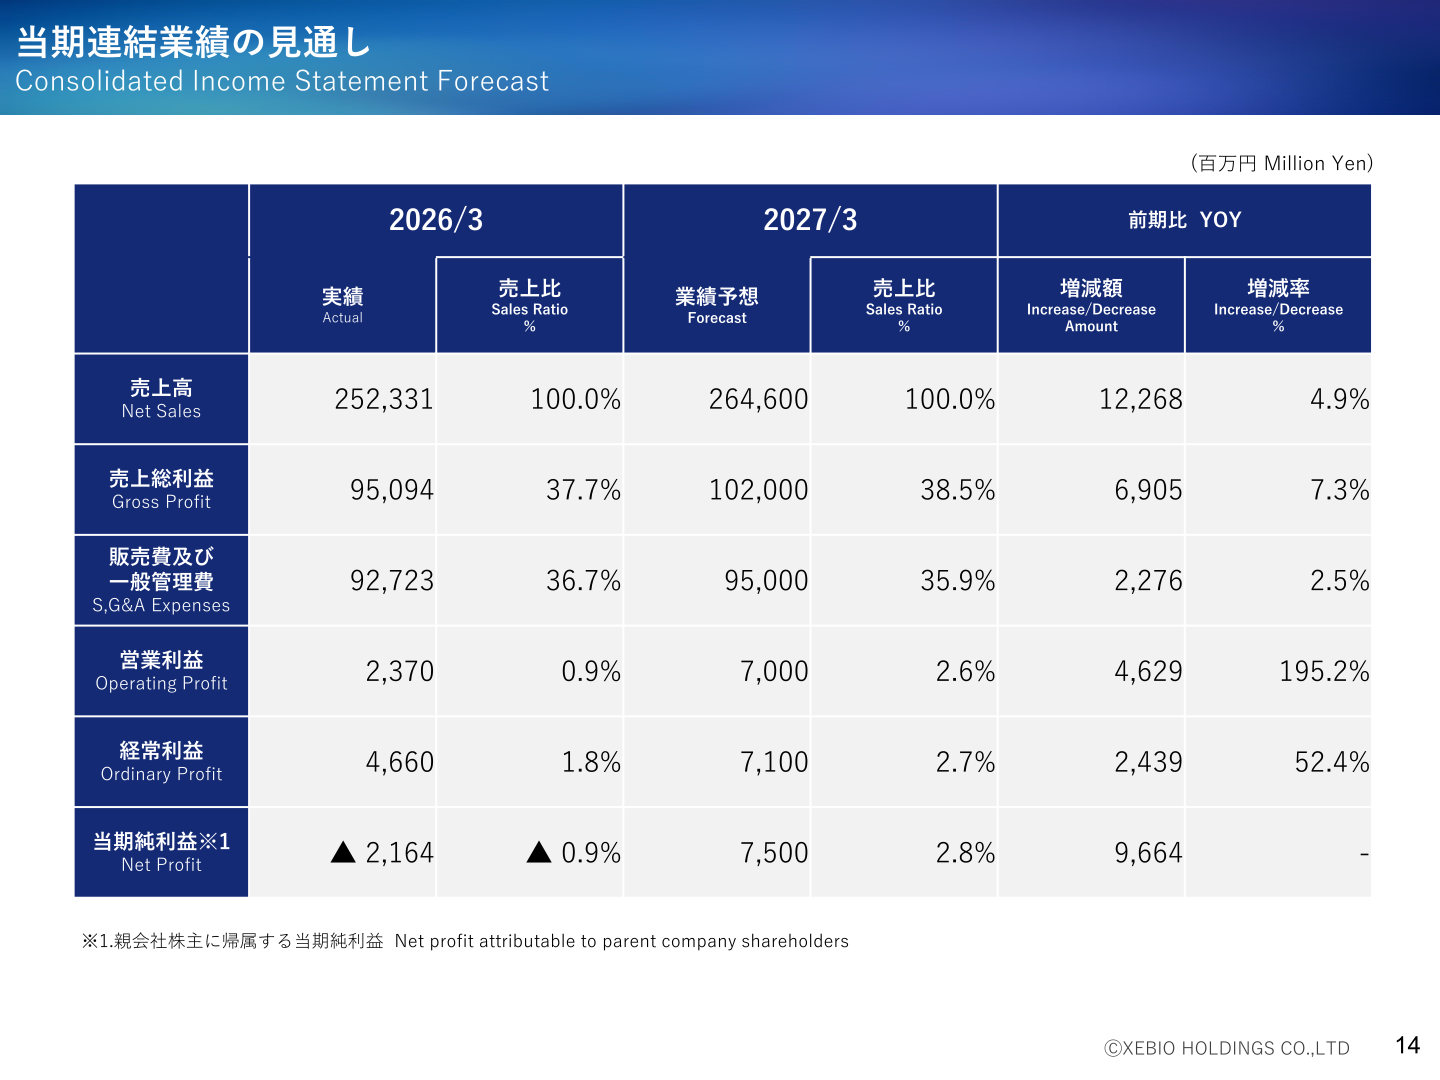
For the fiscal year ending March 31, 2027, XEBIO Holdings forecasts net sales of ¥264,600 million, up 4.9%, with gross profit rising 7.3% to ¥102,000 million and gross margin improving to 38.5% from 37.7%. Operating profit is forecast to rise 195.2% to ¥7,000 million (2.6% margin) and ordinary profit to rise 52.4% to ¥7,100 million. The company expects a return to profitability, with net profit forecast at ¥7,500 million, versus a net loss of ¥2,164 million in the fiscal year ended March 2026.
| Item | FY2026 Forecast (Year Ending Mar 2027) | FY2025 (Actual) | YoY Change (Amount) | YoY Change (%) |
|---|---|---|---|---|
| Net Sales (¥ million) | 264,600 | 252,331 | 12,268 | 4.9% |
| Gross Profit (¥ million) | 102,000 | 95,094 | 6,905 | 7.3% |
| SG&A Expenses (¥ million) | 95,000 | 92,723 | 2,276 | 2.5% |
| Operating Profit (¥ million) | 7,000 | 2,370 | 4,629 | 195.2% |
| Ordinary Profit (¥ million) | 7,100 | 4,660 | 2,439 | 52.4% |
| Net Profit (¥ million) | 7,500 | ▲2,164 | 9,664 | – |
Shareholder Returns
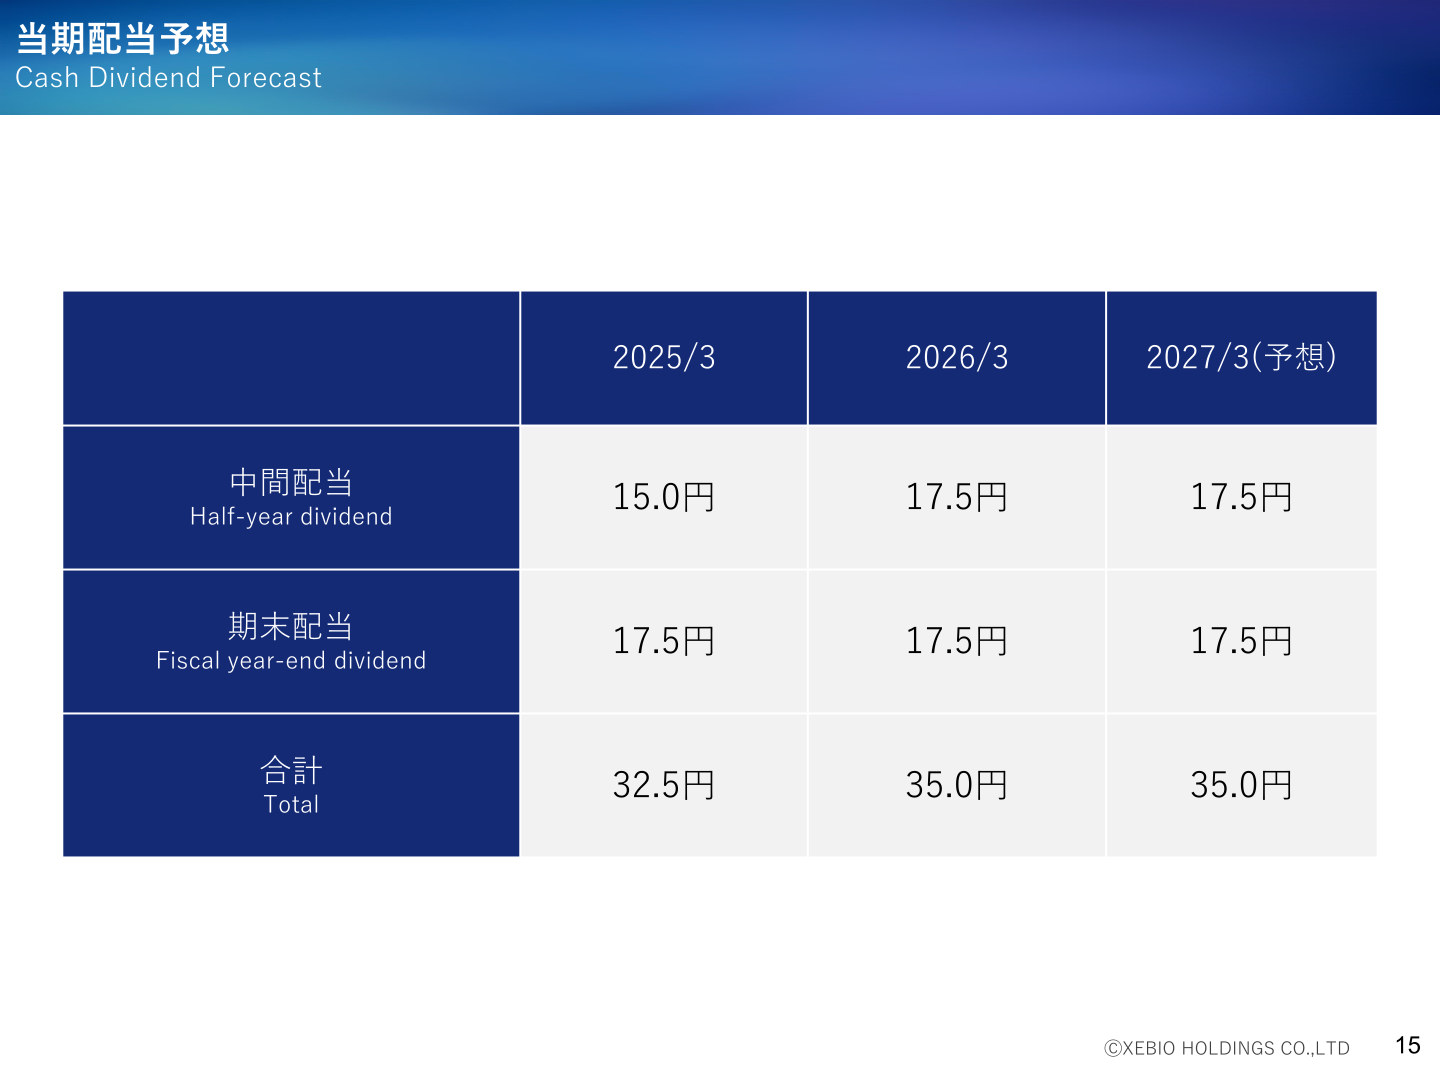
XEBIO Holdings paid a total annual dividend of ¥35.0 per share for the fiscal year ended March 31, 2026 (¥17.5 half-year dividend, ¥17.5 fiscal year-end dividend), up from ¥32.5 per share (¥15.0 half-year, ¥17.5 fiscal year-end) in the prior fiscal year. For the fiscal year ending March 31, 2027, the company forecasts an unchanged total annual dividend of ¥35.0 per share (¥17.5 half-year, ¥17.5 fiscal year-end).
| Item | FY2024 (Year Ended Mar 2025) | FY2025 (Year Ended Mar 2026) | FY2026 Forecast (Year Ending Mar 2027) |
|---|---|---|---|
| Half-year dividend (yen) | 15.0 | 17.5 | 17.5 |
| Fiscal year-end dividend (yen) | 17.5 | 17.5 | 17.5 |
| Total (yen) | 32.5 | 35.0 | 35.0 |
This article is an analysis based on publicly available information and is not a recommendation to buy or sell any specific securities. Investment decisions are your own responsibility.
















