
This article is based on publicly available IR materials and is not a recommendation to buy or sell any specific securities.
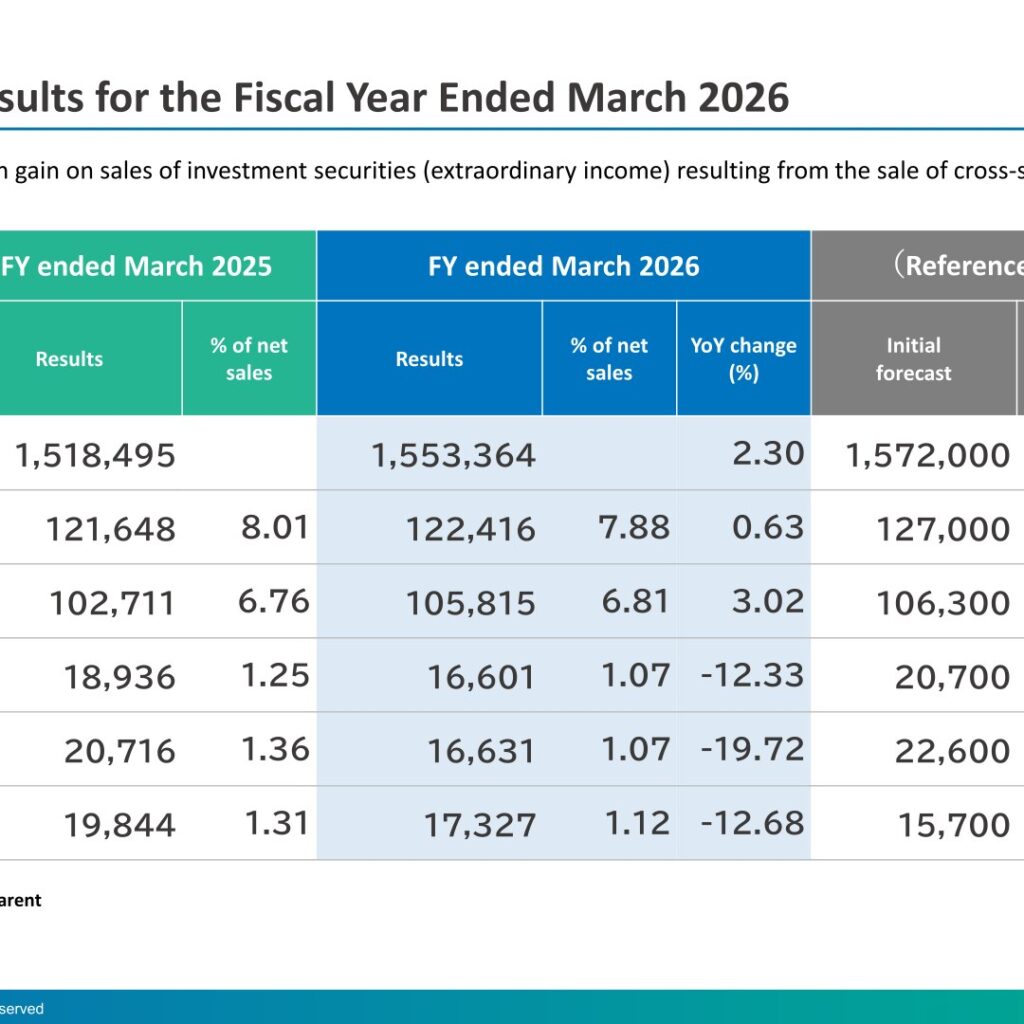
TOHO HOLDINGS CO.,LTD. (8129) posted consolidated net sales of 1,553,364 million yen for the fiscal year ended March 31, 2026, up 2.30% year on year, while operating profit fell 12.33% to 16,601 million yen and ordinary profit fell 19.72% to 16,631 million yen. Profit attributable to owners of parent declined 12.68% to 17,327 million yen, supported by a 9.5 billion yen gain on sales of investment securities recorded as extraordinary income from the sale of cross-shareholdings, etc. ROE was 6.56%. Operating profit reached only 80.20% of the initial forecast of 20,700 million yen, while net profit exceeded the initial forecast of 15,700 million yen at an achievement rate of 110.36%. Alongside the results, the company presented Medium-term Management Plan 2026-2028 “Soaring into the Next Generation” and reported on its Board of Directors’ evaluation of 3D’s large-scale purchase actions.
Note: The presentation is titled “FY2025 (Fiscal Year Ended March 31, 2026) Financial Results Presentation,” dated May 15, 2026; labels and figures in this article follow the source materials, in which amounts are shown in millions of yen unless otherwise noted.
Consolidated Results (Full-Year Actual)
Gross profit rose 0.63% to 122,416 million yen, but the gross profit margin narrowed to 7.88% of net sales from 8.01%. SG&A expenses increased 3.02% to 105,815 million yen, equal to 6.81% of net sales, which pushed operating profit down to 1.07% of net sales from 1.25%. The company recorded a 9.5 billion yen gain on sales of investment securities as extraordinary income resulting from the sale of cross-shareholdings, etc., and ROE was 6.56%.
| Item | FY ended March 2026 | FY ended March 2025 | YoY change (%) |
|---|---|---|---|
| Net sales | 1,553,364 million yen | 1,518,495 million yen | 2.30 |
| Gross profit | 122,416 million yen (7.88% of net sales) | 121,648 million yen (8.01% of net sales) | 0.63 |
| SG&A | 105,815 million yen (6.81% of net sales) | 102,711 million yen (6.76% of net sales) | 3.02 |
| Operating profit | 16,601 million yen (1.07% of net sales) | 18,936 million yen (1.25% of net sales) | -12.33 |
| Ordinary profit | 16,631 million yen (1.07% of net sales) | 20,716 million yen (1.36% of net sales) | -19.72 |
| Net profit (profit attributable to owners of parent) | 17,327 million yen (1.12% of net sales) | 19,844 million yen (1.31% of net sales) | -12.68 |
Segment Results
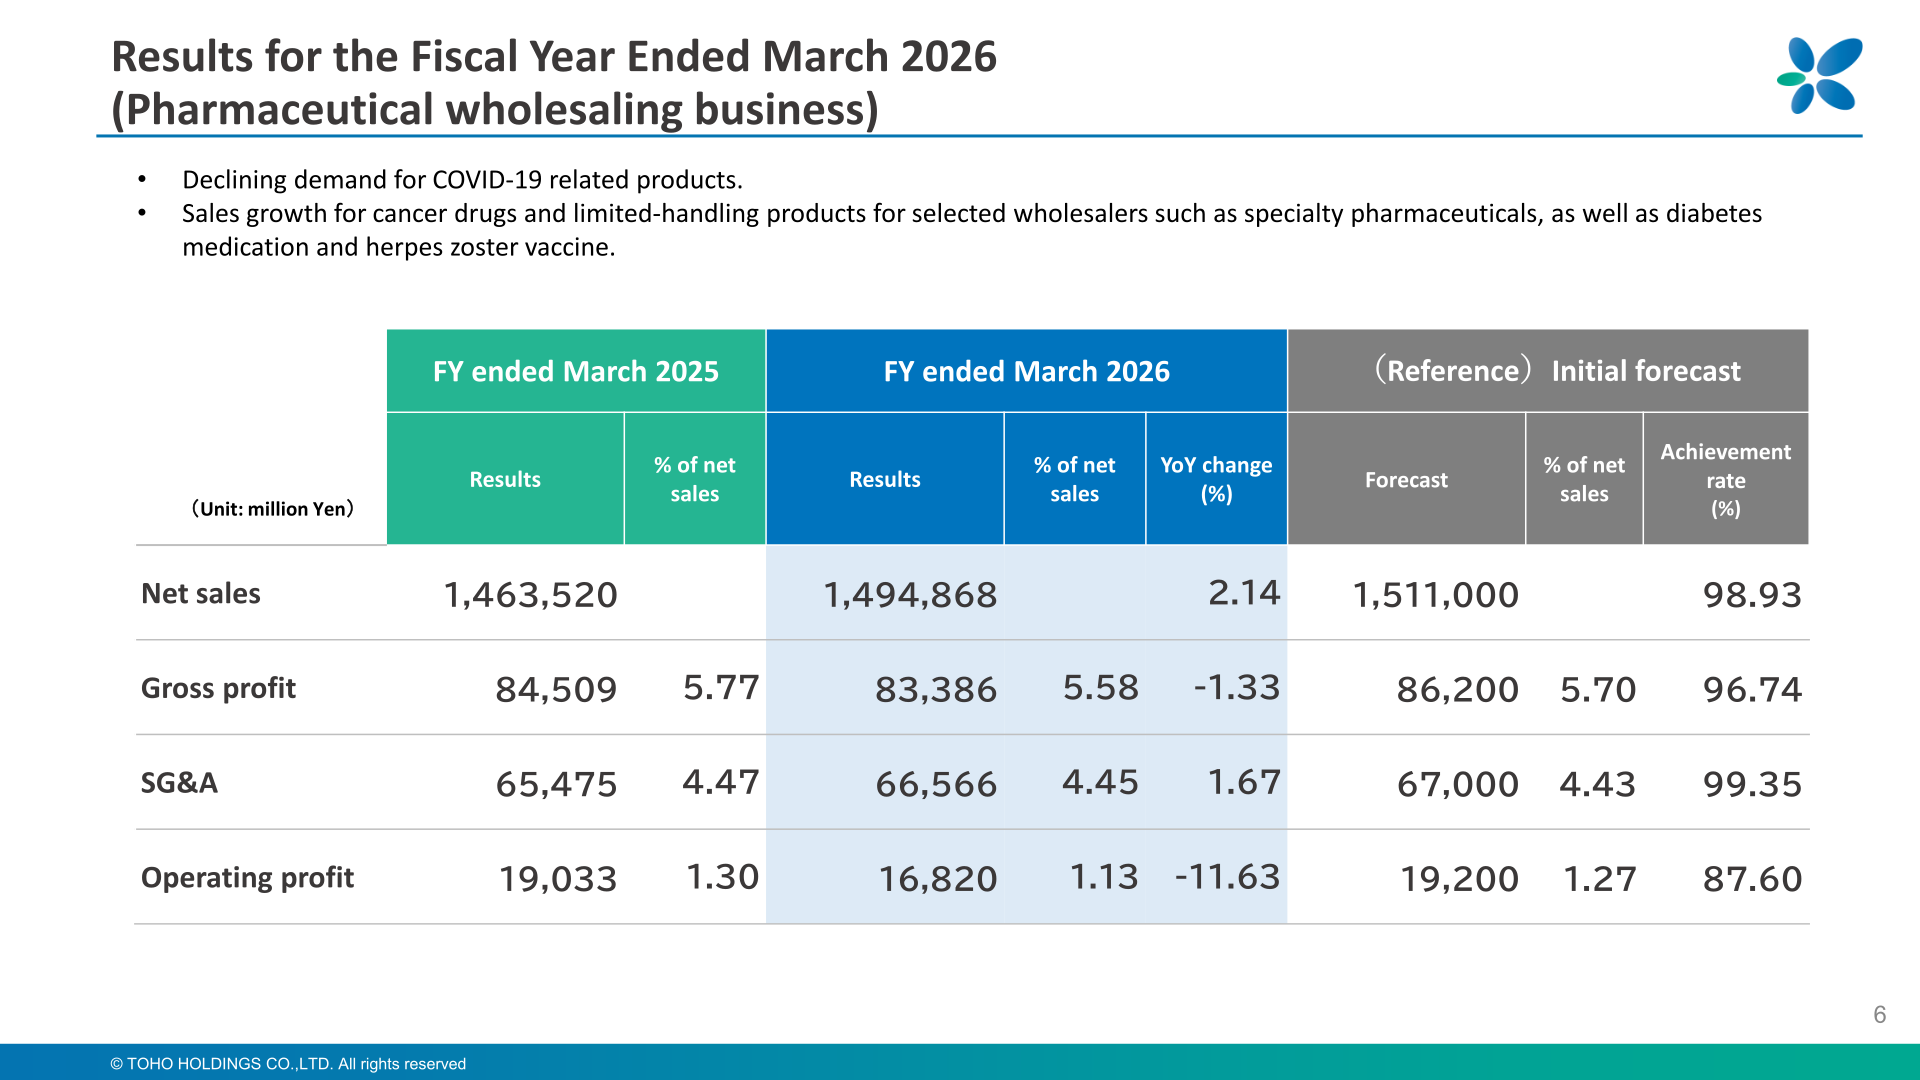
In the pharmaceutical wholesaling business, net sales rose 2.14% to 1,494,868 million yen but operating profit fell 11.63% to 16,820 million yen. The company cited declining demand for COVID-19 related products, offset by sales growth for cancer drugs and limited-handling products for selected wholesalers such as specialty pharmaceuticals, as well as diabetes medication and herpes zoster vaccine. On a billion-yen basis the segment’s net sales rose from 1,463.5 billion yen to 1,494.8 billion yen, an increase of 31.3 billion yen.
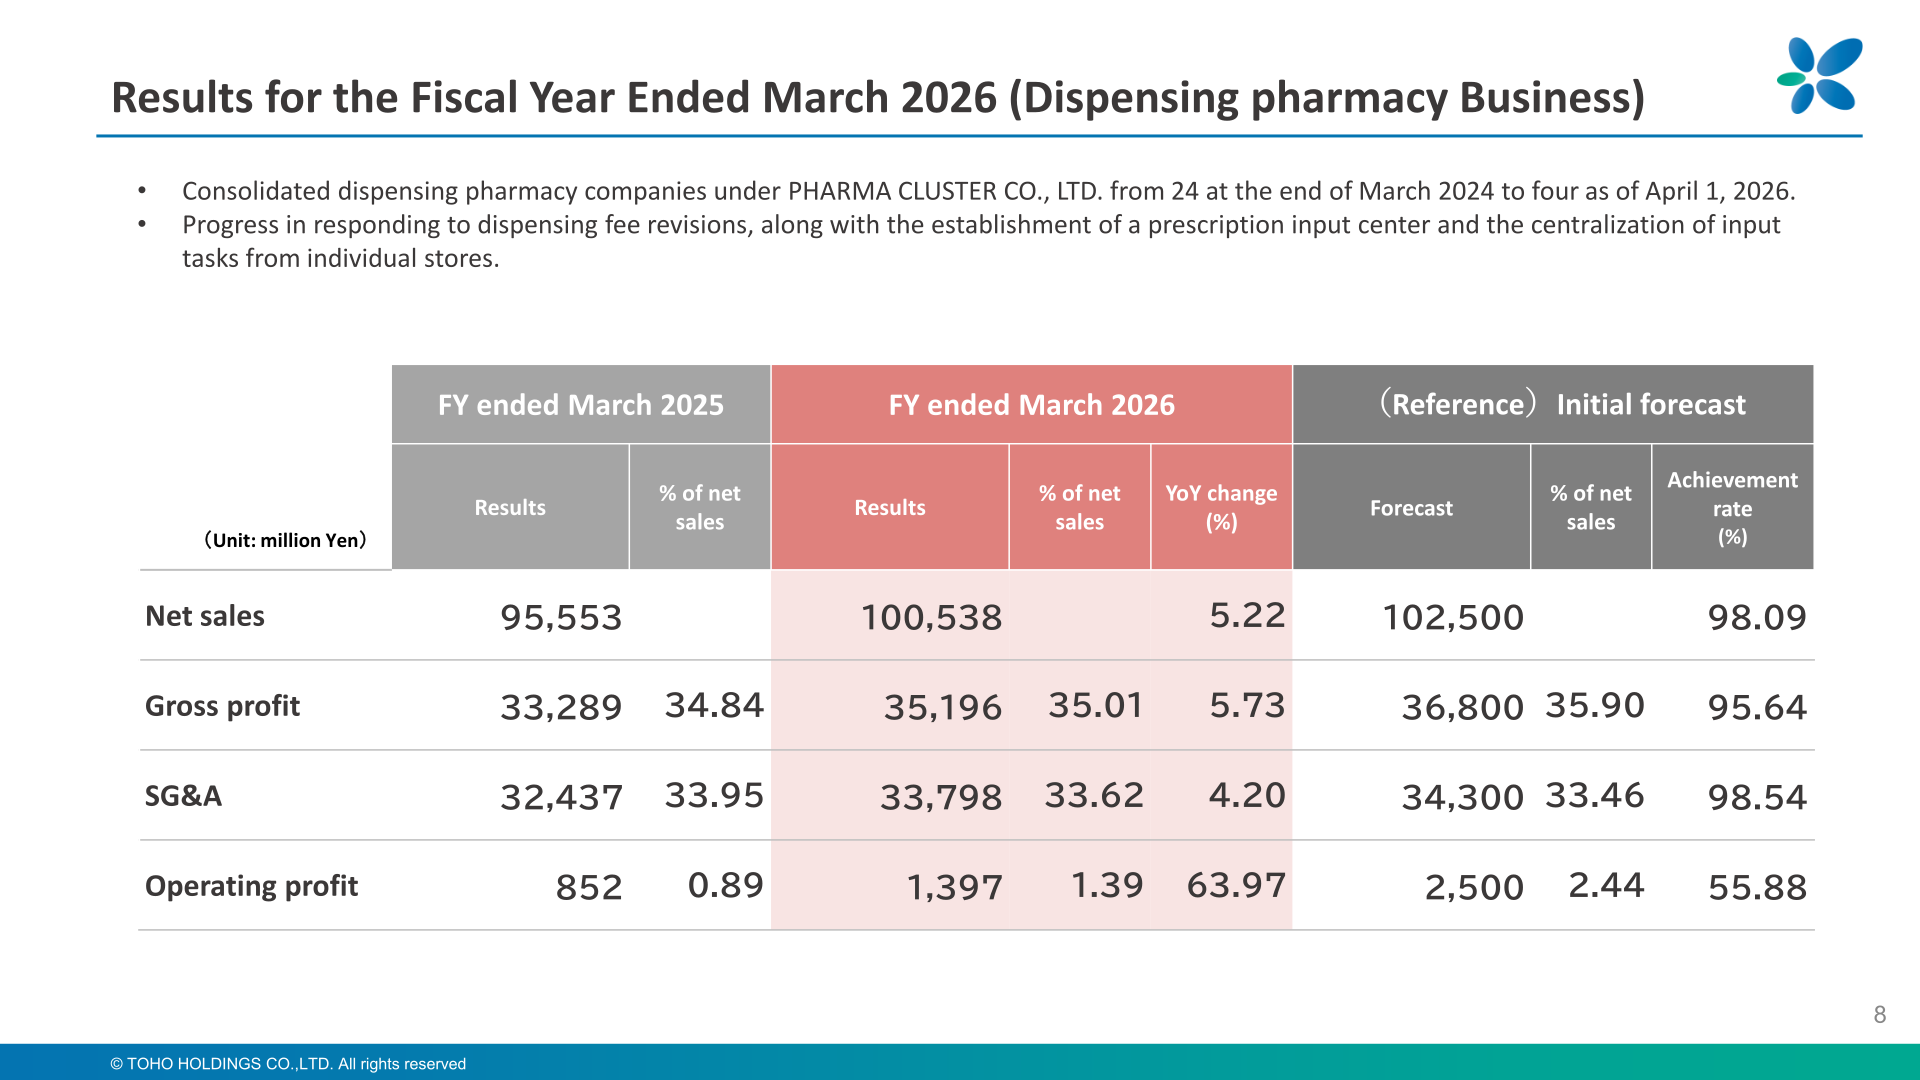
In the dispensing pharmacy business, net sales rose 5.22% to 100,538 million yen and operating profit rose 63.97% to 1,397 million yen, though this was only 55.88% of the initial forecast of 2,500 million yen. The company consolidated its dispensing pharmacy companies under PHARMA CLUSTER CO., LTD. from 24 at the end of March 2024 to four as of April 1, 2026, and cited progress in responding to dispensing fee revisions along with the establishment of a prescription input center and the centralization of input tasks from individual stores. Segment net sales rose from 95.5 billion yen to 100.5 billion yen, an increase of 5 billion yen, including an increase of 7,262 million yen from the restructuring of six unconsolidated companies, a net decrease of 1,574 million yen from opening 16 stores and closing 44 stores, and a decrease of 700 million yen at existing stores where the number of prescriptions was 95.0% year on year.
| Segment | Metric | FY ended March 2026 | FY ended March 2025 |
|---|---|---|---|
| Pharmaceutical wholesaling | Net sales | 1,494,868 million yen | 1,463,520 million yen |
| Pharmaceutical wholesaling | Gross profit | 83,386 million yen (5.58% of net sales) | 84,509 million yen (5.77% of net sales) |
| Pharmaceutical wholesaling | SG&A | 66,566 million yen (4.45% of net sales) | 65,475 million yen (4.47% of net sales) |
| Pharmaceutical wholesaling | Operating profit | 16,820 million yen (1.13% of net sales) | 19,033 million yen (1.30% of net sales) |
| Dispensing pharmacy | Net sales | 100,538 million yen | 95,553 million yen |
| Dispensing pharmacy | Gross profit | 35,196 million yen (35.01% of net sales) | 33,289 million yen (34.84% of net sales) |
| Dispensing pharmacy | SG&A | 33,798 million yen (33.62% of net sales) | 32,437 million yen (33.95% of net sales) |
| Dispensing pharmacy | Operating profit | 1,397 million yen (1.39% of net sales) | 852 million yen (0.89% of net sales) |
FY2026 Forecast (Fiscal Year Ending March 31, 2027)
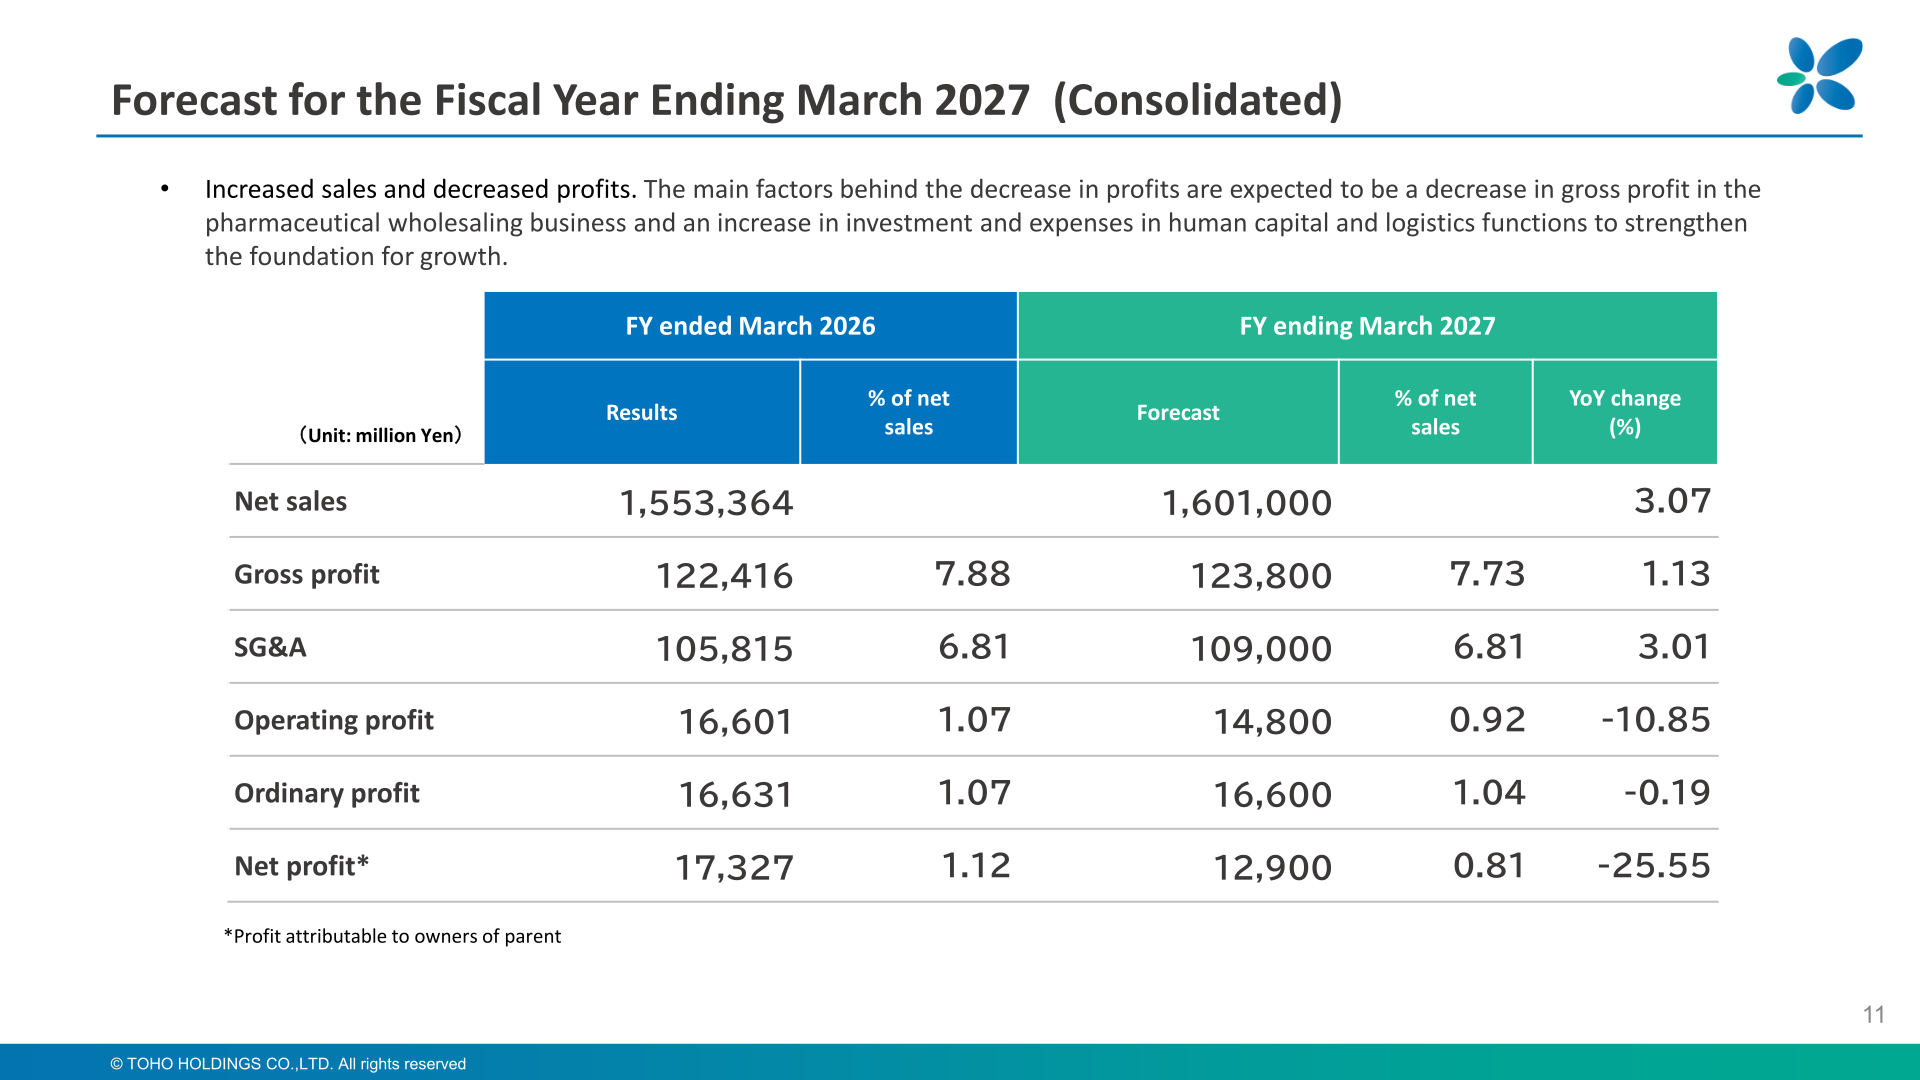
For the fiscal year ending March 2027 the company forecasts increased sales and decreased profits: net sales of 1,601,000 million yen (up 3.07%), operating profit of 14,800 million yen (down 10.85%), ordinary profit of 16,600 million yen (down 0.19%) and net profit of 12,900 million yen (down 25.55%). The company attributes the profit decline mainly to a decrease in gross profit in the pharmaceutical wholesaling business and an increase in investment and expenses in human capital and logistics functions to strengthen the foundation for growth.
By segment, the pharmaceutical wholesaling business is forecast to post net sales of 1,539,000 million yen (up 2.95%) and operating profit of 14,800 million yen (down 12.01%), with gross profit slipping 0.22% to 83,200 million yen on higher purchasing costs and category changes as well as one-time expenses for strengthening human capital and enhancing logistics capabilities. The dispensing pharmacy business is forecast to post net sales of 105,000 million yen (up 4.44%) and operating profit of 2,100 million yen (up 50.32%), helped by a decline in the SG&A ratio through the promotion of DX.
| Item | FY ending March 2027 (Forecast) | FY ended March 2026 (Results) | YoY change (%) |
|---|---|---|---|
| Net sales | 1,601,000 million yen | 1,553,364 million yen | 3.07 |
| Gross profit | 123,800 million yen (7.73% of net sales) | 122,416 million yen (7.88% of net sales) | 1.13 |
| SG&A | 109,000 million yen (6.81% of net sales) | 105,815 million yen (6.81% of net sales) | 3.01 |
| Operating profit | 14,800 million yen (0.92% of net sales) | 16,601 million yen (1.07% of net sales) | -10.85 |
| Ordinary profit | 16,600 million yen (1.04% of net sales) | 16,631 million yen (1.07% of net sales) | -0.19 |
| Net profit (profit attributable to owners of parent) | 12,900 million yen (0.81% of net sales) | 17,327 million yen (1.12% of net sales) | -25.55 |
Shareholder Returns
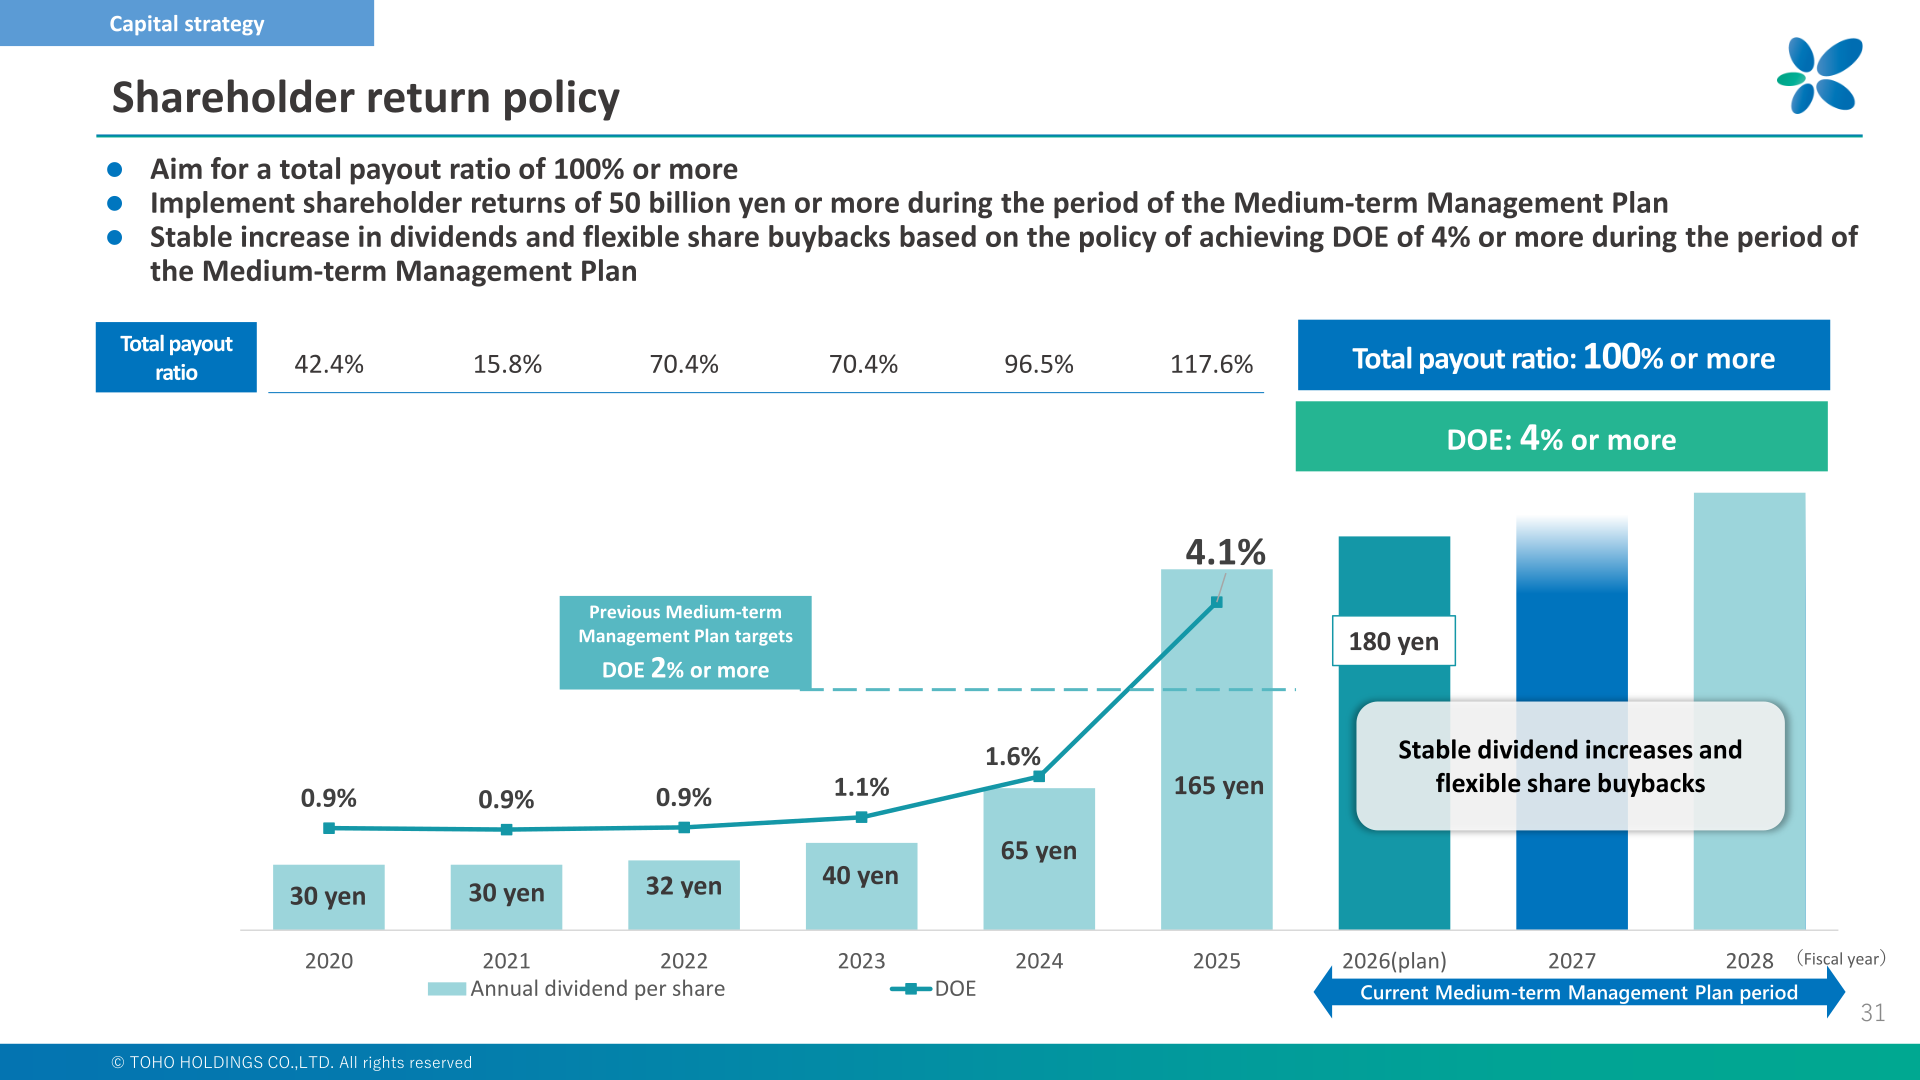
The annual dividend per share was 165 yen for fiscal 2025, up from 65 yen for fiscal 2024, taking DOE to 4.1% and the total payout ratio to 117.6%. The plan for fiscal 2026 is 180 yen. Under the new Medium-term Management Plan the company aims for a total payout ratio of 100% or more, plans to implement shareholder returns of 50 billion yen or more during the plan period, and will pursue stable dividend increases and flexible share buybacks based on a policy of achieving DOE of 4% or more. Capital allocation results for April 1, 2024 to March 31, 2026 included shareholder returns of 39.8 billion yen, comprising share buybacks of 15 billion yen in FY2024 and 10 billion yen in FY2025 and dividends of 4.1 billion yen in FY2024 and 10.7 billion yen in FY2025. Cross-shareholdings were reduced to 37,553 million yen as of March 2026, or 13.8% of consolidated net assets, achieving the target of less than 15%, with a further target of less than 10% for the fiscal year ending March 2029.
| Fiscal year | Annual dividend per share | DOE | Total payout ratio |
|---|---|---|---|
| 2023 | 40 yen | 1.1% | 70.4% |
| 2024 | 65 yen | 1.6% | 96.5% |
| 2025 | 165 yen | 4.1% | 117.6% |
| 2026 (plan) | 180 yen | DOE 4% or more (plan period policy) | 100% or more (plan period target) |
Medium-Term Plan and Topics
Medium-term Management Plan 2026-2028 “Soaring into the Next Generation” targets ROE of 8% or more, an operating profit margin of 1.5% or more, operating profit of 30bn yen or more, and investment in growth fields of 50bn yen or more. The company plans to lift operating profit from 16.6 billion yen in FY2025 toward 30 billion yen or more in FY2028 through an expansion of gross profit of 5 billion yen in the pharmaceutical wholesaling business, an improvement in profitability by efficiency of 2 billion yen in the dispensing pharmacy business and cost structure reform of 6 billion yen, with additional upside potential from the growth of new businesses and the expansion of the pharmaceutical manufacturing and sales business. Growth strategies include expanding the number of specialty pharmaceuticals acquired, promoting DX using BI and AI, creating new businesses through alliances and M&A in fields such as prescription pharmaceuticals, medical devices/materials, reagents, OTC drug, medical IT and logistics, and expanding the CDMO business for new modalities. Construction is underway on TBC Tokai, an integrated logistics center in Komaki City, Aichi, scheduled to start operation in FY 2027.
The presentation also covers the Board of Directors’ evaluation of 3D’s large-scale purchase actions. The Board evaluates that the purpose of the actions is to increase 3D’s influence over the company’s management and to seek short-term profits, and strongly opposes them as risking damage to medium- to long-term corporate value and the common interests of shareholders. The Board has resolved to submit a proposal to the Annual General Meeting of Shareholders to be held in June to confirm shareholders’ intent regarding the implementation of countermeasures; the Independent Committee report was dated April 17 and the evaluation period ran to April 28, with the shareholders’ meeting set for June 26.
This article is an analysis based on publicly available information and is not a recommendation to buy or sell any specific securities. Investment decisions are your own responsibility.
![[Obayashi] Investors’ Guide 2026 — The Complete 24-Article Breakdown](https://japan-equity.com/wp-content/uploads/2026/07/hub_cover-1024x1024.png)
![[Obayashi] IR & SR Policy — Feeding Dialogue Back into Management](https://japan-equity.com/wp-content/uploads/2026/07/p32_sq-1024x1024.jpg)
![[Obayashi] Real Estate Development — 18.7% Margin, ¥287.7bn Unrealized Gains](https://japan-equity.com/wp-content/uploads/2026/07/p20_sq-1024x1024.jpg)
![[Obayashi] Domestic Civil Engineering — Resilience Spending Supports 9.6% Margin](https://japan-equity.com/wp-content/uploads/2026/07/p11_sq-1024x1024.jpg)
![[Obayashi] Share Price & External Ratings — vs TOPIX, ESG Index Inclusion](https://japan-equity.com/wp-content/uploads/2026/07/p40_sq-1024x1024.jpg)
![[Construction] ¥75.5tn Investment, Shrinking Workforce — Big-5 Market Share](https://japan-equity.com/wp-content/uploads/2026/07/p12_sq-1024x1024.jpg)



![[Obayashi] Capital Policy & Shareholder Returns — ROE 10%+, DOE ~5%, ¥100bn Buyback](https://japan-equity.com/wp-content/uploads/2026/07/p27_sq-1024x1024.jpg)
![[Obayashi] Reducing Cross-Shareholdings — ¥285.2bn Sold in Five Years](https://japan-equity.com/wp-content/uploads/2026/07/p29_sq-1024x1024.jpg)
![[Obayashi] ¥750bn Investment Plan — ¥300bn to Development, ¥190bn to Tech/DX](https://japan-equity.com/wp-content/uploads/2026/07/p30_sq-1024x1024.jpg)
![[Obayashi] MTP2022 KPIs — Operating Profit ~2x Target, ROE 14.4%](https://japan-equity.com/wp-content/uploads/2026/07/p25_sq-1024x1024.jpg)
![[Obayashi] Cash Allocation — ¥420bn Investment CF Over Five Years](https://japan-equity.com/wp-content/uploads/2026/07/p26_sq-1024x1024.jpg)
![[Obayashi] Green Energy — 44 Plants, 344MW, and the Green Hydrogen Challenge](https://japan-equity.com/wp-content/uploads/2026/07/p21_sq-1024x1024.jpg)
![[Obayashi] Tackling the Labor Shortage — Robotics Construction®](https://japan-equity.com/wp-content/uploads/2026/07/p14_sq-1024x1024.jpg)
