
This article is based on publicly available IR materials and is not a recommendation to buy or sell any specific securities.
Inabata & Co., Ltd., a Japan-based general trading company specializing in chemicals, reported net sales of ¥832.7 billion, operating profit of ¥26.1 billion, ordinary profit of ¥27.7 billion, and profit attributable to owners of parent of ¥20.6 billion for the fiscal year ended March 31, 2026, which the Company labels FY03/26 (the second year of its medium-term management plan “New Challenge 2026,” or NC2026). Note: Inabata refers to this fiscal year as “FY03/26” in its own disclosures; it is treated as FY2025 in the title of this article per site convention, and the FY03/26 / FY03/25 labels used by the Company are retained in the tables below. In its second year, NC2026 proceeded broadly on track, with profits at each level exceeding the Company’s own second-year projections, and ordinary profit and profit attributable to owners of parent already surpassing the plan’s final-year (FY03/27) targets.
Consolidated Results (Full-Year Actual)
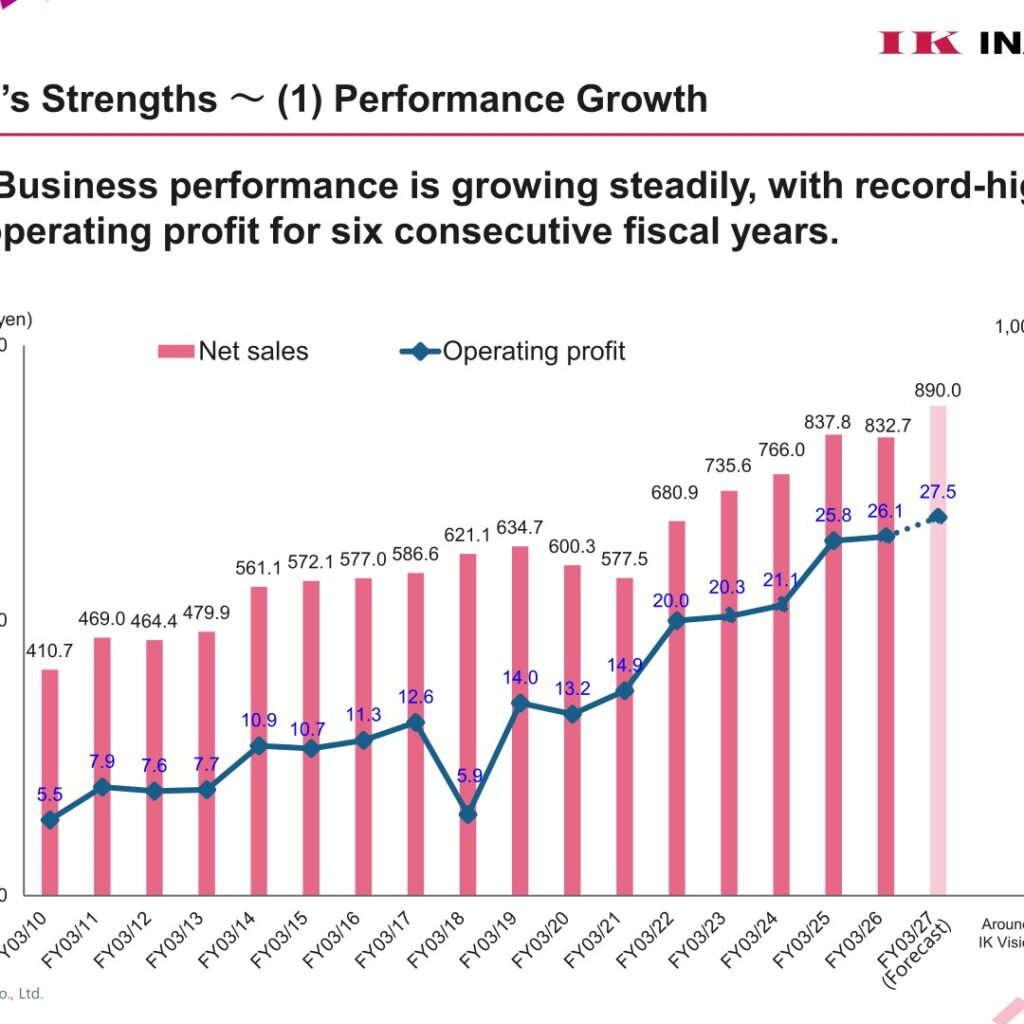
Net sales edged down from ¥837.8 billion in FY03/25 to ¥832.7 billion in FY03/26, while operating profit, ordinary profit, and profit attributable to owners of parent all increased. The Company reported that business performance has grown steadily, with record-high operating profit for six consecutive fiscal years. ROE was 9.3%, and the equity ratio rose to 47.3%.
| Item | FY03/26 (Actual) | FY03/25 (Actual) |
|---|---|---|
| Net sales (Billions of yen) | 832.7 | 837.8 |
| Operating profit (Billions of yen) | 26.1 | 25.8 |
| Operating profit margin | 3.1% | 3.1% |
| Ordinary profit (Billions of yen) | 27.7 | 26.1 |
| Profit attributable to owners of parent (Billions of yen) | 20.6 | 19.8 |
| ROE | 9.3% | 9.7% |
| Net debt/equity ratio | 0.06 times | 0.07 times |
| Equity ratio | 47.3% | 47.1% |
| Exchange rate (USD/JPY) | ¥150.67 | ¥152.62 |
Segment Results
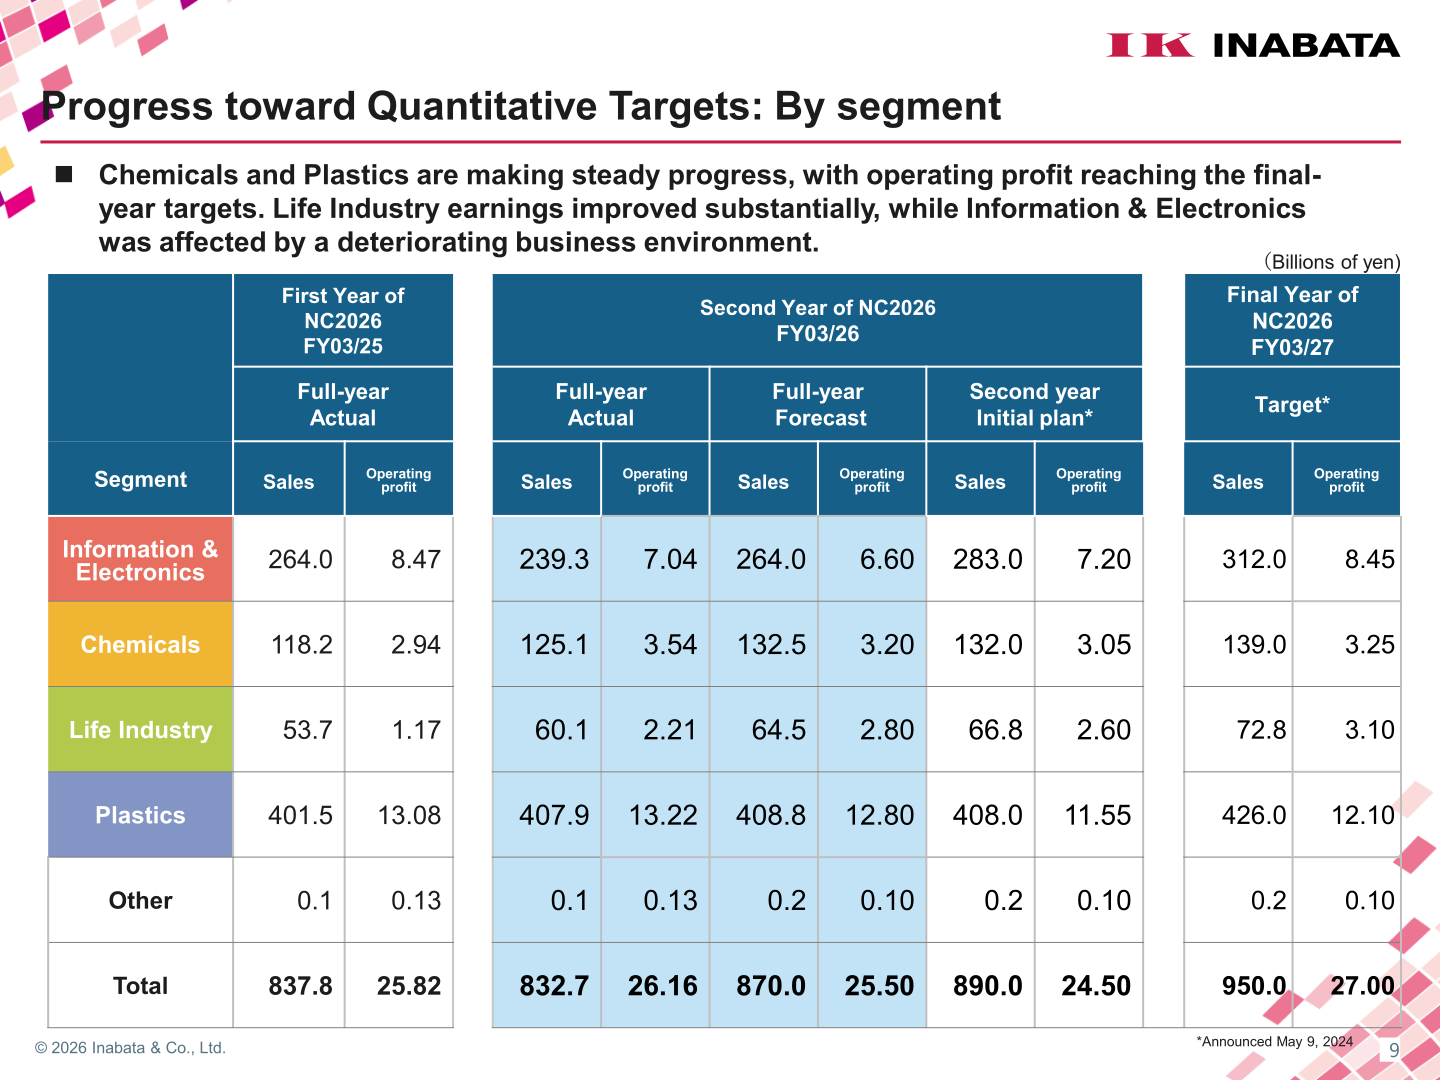
By segment, Chemicals and Plastics made steady progress, with operating profit already reaching their final-year (FY03/27) targets. Life Industry earnings improved substantially, while Information & Electronics was affected by a deteriorating business environment, including production adjustments by FPD panel manufacturers and lower sales of solar power generation-related materials.
| Segment | Metric | FY03/26 (Actual) | FY03/25 (Actual) |
|---|---|---|---|
| Information & Electronics | Sales (Billions of yen) | 239.3 | 264.0 |
| Information & Electronics | Operating profit (Billions of yen) | 7.04 | 8.47 |
| Chemicals | Sales (Billions of yen) | 125.1 | 118.2 |
| Chemicals | Operating profit (Billions of yen) | 3.54 | 2.94 |
| Life Industry | Sales (Billions of yen) | 60.1 | 53.7 |
| Life Industry | Operating profit (Billions of yen) | 2.21 | 1.17 |
| Plastics | Sales (Billions of yen) | 407.9 | 401.5 |
| Plastics | Operating profit (Billions of yen) | 13.22 | 13.08 |
| Other | Sales (Billions of yen) | 0.1 | 0.1 |
| Other | Operating profit (Billions of yen) | 0.13 | 0.13 |
| Total | Sales (Billions of yen) | 832.7 | 837.8 |
| Total | Operating profit (Billions of yen) | 26.16 | 25.82 |
FY2026 Forecast
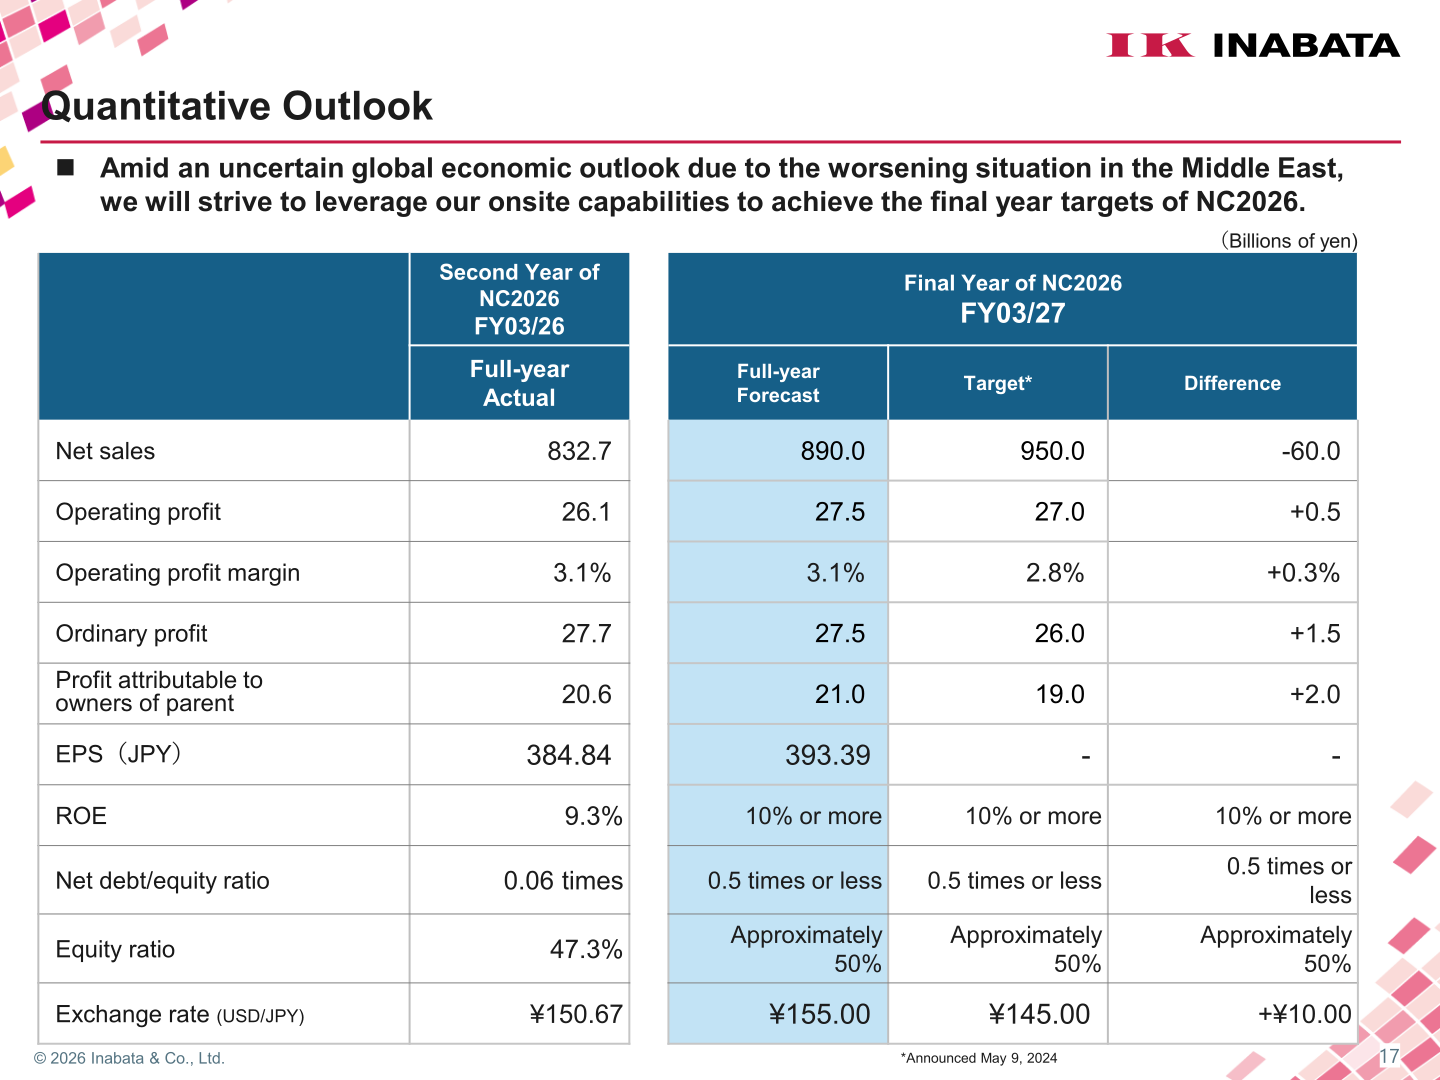
For FY03/27, the final year of NC2026, Inabata forecasts net sales of ¥890.0 billion, operating profit of ¥27.5 billion, ordinary profit of ¥27.5 billion, and profit attributable to owners of parent of ¥21.0 billion, versus final-year targets of ¥950.0 billion, ¥27.0 billion, ¥26.0 billion, and ¥19.0 billion, respectively. The Company expects to achieve final-year operating profit targets in the Chemicals, Life Industry, and Plastics segments, while the business environment for Information & Electronics is likely to remain generally challenging. The Company notes that the FY03/27 forecast does not factor in the impact of the deteriorating situation in the Middle East on business performance.
| Item | FY03/27 (Forecast) | FY03/26 (Actual) | FY03/27 (NC2026 Target) |
|---|---|---|---|
| Net sales (Billions of yen) | 890.0 | 832.7 | 950.0 |
| Operating profit (Billions of yen) | 27.5 | 26.1 | 27.0 |
| Operating profit margin | 3.1% | 3.1% | 2.8% |
| Ordinary profit (Billions of yen) | 27.5 | 27.7 | 26.0 |
| Profit attributable to owners of parent (Billions of yen) | 21.0 | 20.6 | 19.0 |
| EPS (Yen) | 393.39 | 384.84 | – |
| ROE | 10% or more | 9.3% | 10% or more |
| Exchange rate (USD/JPY) | ¥155.00 | ¥150.67 | ¥145.00 |
Shareholder Returns
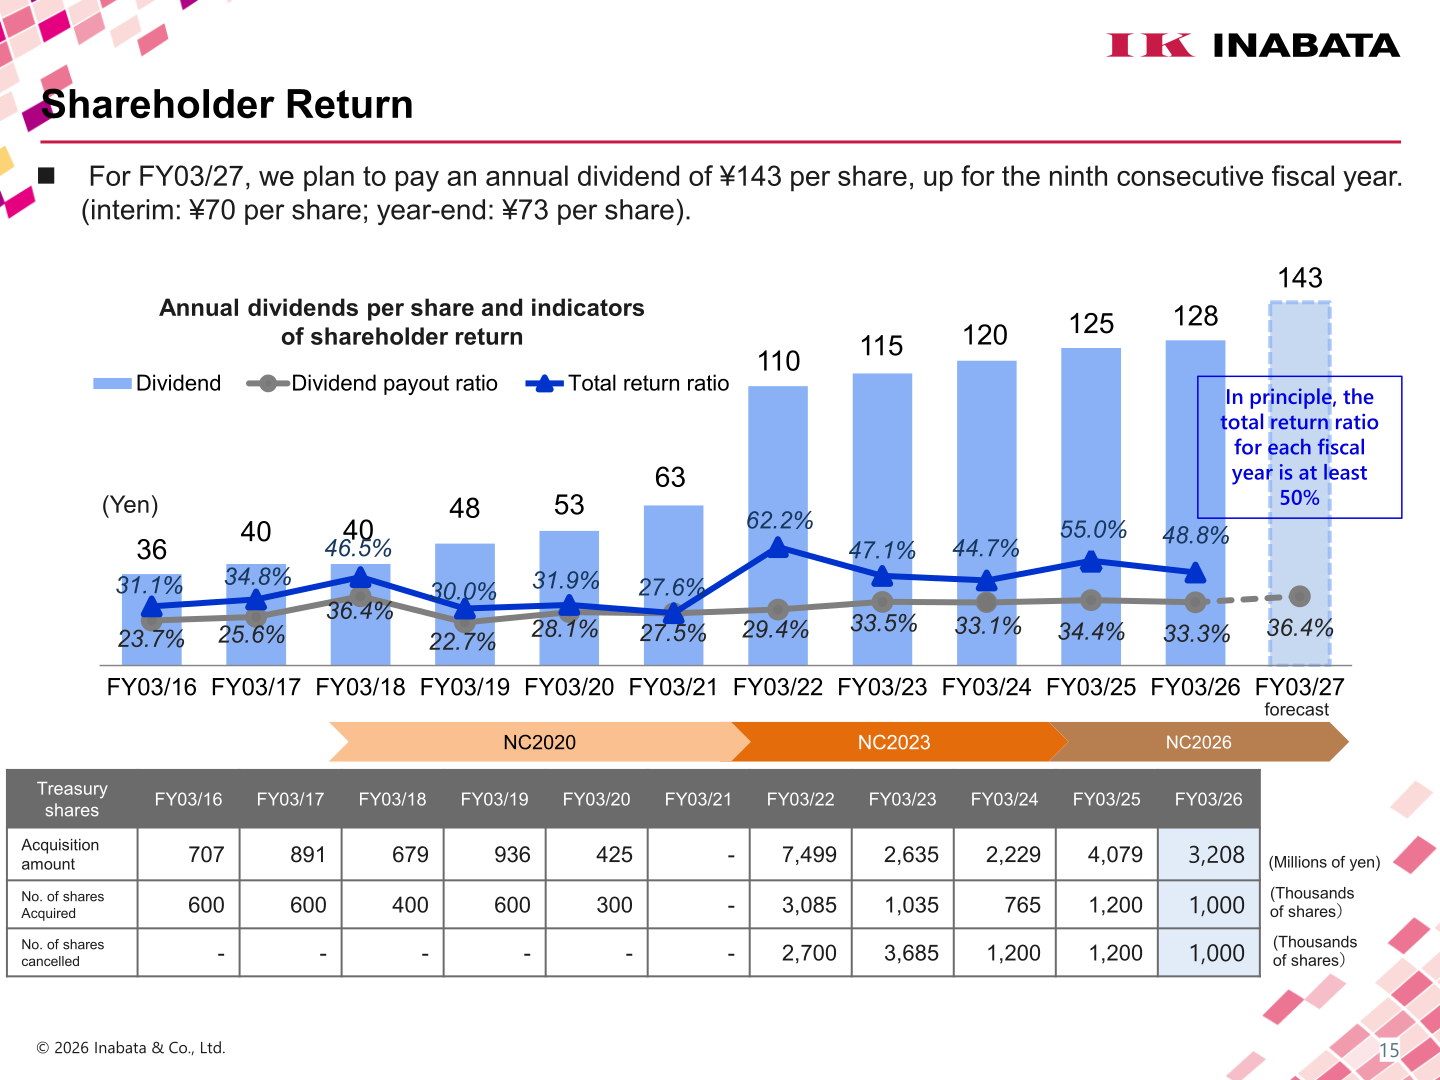
For FY03/26, Inabata paid a total annual dividend of ¥128 per share, with a dividend payout ratio of 33.3% and a total return ratio of 48.8%. For FY03/27, the Company plans to pay an annual dividend of ¥143 per share (interim: ¥70; year-end: ¥73), up for the ninth consecutive fiscal year, with a forecast dividend payout ratio of 36.4%. In FY03/26, the Company acquired treasury shares for ¥3,208 million (1,000 thousand shares) and cancelled 1,000 thousand shares. Effective from FY03/27, Inabata is partially amending its shareholder return policy: in addition to continuing progressive dividends, it will newly introduce dividend on equity (DOE), guiding the total dividend amount to a DOE of 4 to 4.5%, and will raise its total return ratio policy so that, in principle, the total return ratio for each fiscal year is at least 50% (previously, the target total return ratio was roughly 50%).
Medium-Term Plan / Topics
NC2026 (FY03/25–FY03/27) is the third stage of Inabata’s medium-term management plans on the way to its long-term vision “IK Vision 2030,” which targets consolidated net sales of ¥1 trillion, an overseas business ratio of 70% or more, at least one-third of business from segments other than Information & Electronics and Plastics, and further enhancement of multifaceted capabilities such as manufacturing, logistics, and finance. Through the second year of NC2026, cumulative cash flows from operating activities (plus sales value of strategic shareholdings) reached ¥46.2 billion against a three-year plan of approximately ¥65 billion, funding cumulative growth investment of ¥18.9 billion and fixed investment of ¥19.1 billion, plus dividends and share buybacks of ¥20.9 billion, largely in line with the plan’s roughly 50-60% allocation to investments and 40-50% to shareholder returns. Three newly consolidated companies acquired through M&A — Novacel, Daigo Tsusho, and Satoen — contributed steadily to earnings. As of the end of March 2026, ROE was 9.3% against an estimated cost of equity of 6.5%, and PBR stood at 0.89x, remaining below 1x; the Board has resolved policies to increase the share price so that PBR stays above 1x, including maintaining ROE of 10% or above, controlling the cost of capital, and continuing share buybacks.
This article is an analysis based on publicly available information and is not a recommendation to buy or sell any specific securities. Investment decisions are your own responsibility.
















