
This article is based on publicly available IR materials and is not a recommendation to buy or sell any specific securities.
Shinsho Corporation, a KOBELCO (Kobe Steel Group) trading company, reported consolidated net sales of ¥608.1 billion for the fiscal year ended March 31, 2026 (FY2025), down ¥9.0 billion year on year, as sales of steel sheets for the construction industry declined and steel prices fell. Ordinary profit was ¥11.0 billion, down ¥0.7 billion, while profit attributable to owners of parent decreased by only ¥0.3 billion to ¥8.3 billion, cushioned by gains on sales of strategically held shares. For FY2026, the company forecasts net sales of ¥686.0 billion, ordinary profit of ¥11.5 billion and net income of ¥9.0 billion, and plans an annual dividend of ¥130 per share, including a ¥26 commemorative dividend to mark its 80th anniversary.
Consolidated Results (Full-Year Actual)
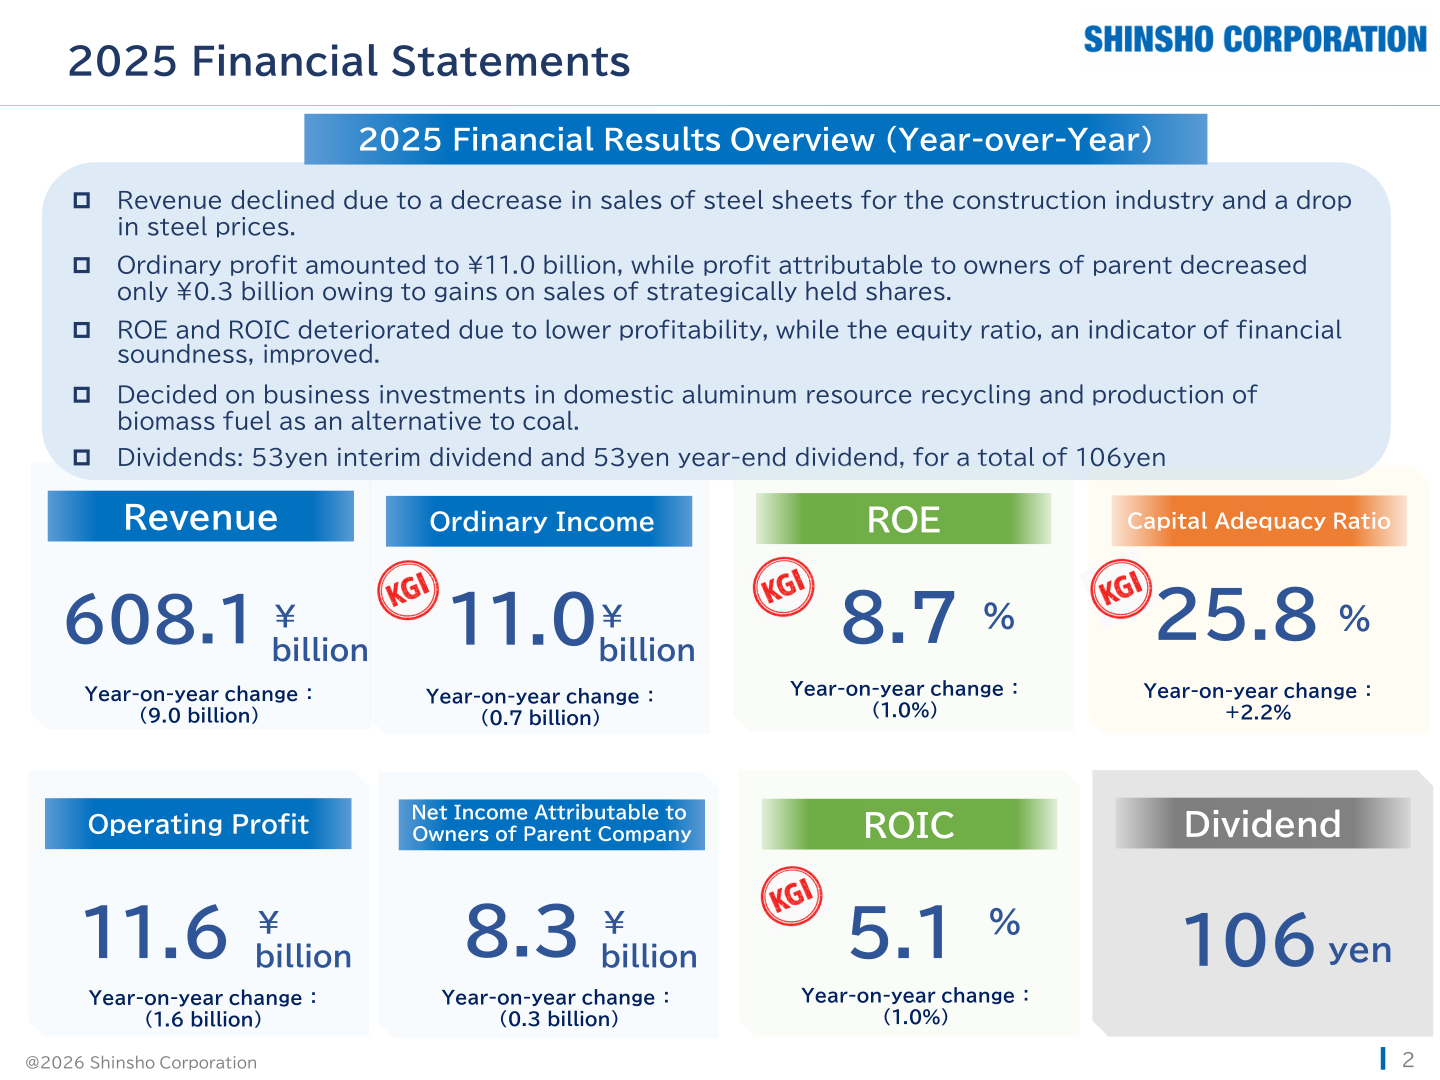
Revenue declined due to a decrease in sales of steel sheets for the construction industry and a drop in steel prices. Ordinary profit amounted to ¥11.0 billion, while profit attributable to owners of parent decreased only ¥0.3 billion owing to gains on sales of strategically held shares. ROE and ROIC deteriorated due to lower profitability, while the equity ratio, an indicator of financial soundness, improved. The company decided on business investments in domestic aluminum resource recycling and production of biomass fuel as an alternative to coal. FY2025 dividends totaled ¥106 per share, comprising a ¥53 interim dividend and a ¥53 year-end dividend. Actual results for FY2025 came in below the company’s original forecast, which had been published at net sales of ¥637.0 billion and ordinary profit of ¥12.0 billion. Figures below are in billions of yen unless otherwise noted.
| Item | FY2024 (Actual) | FY2025 (Actual) | Change | % Change |
|---|---|---|---|---|
| Net sales | 617.2 | 608.1 | (9.0) | (1.5%) |
| Gross profit | 40.4 | 39.5 | (0.9) | (2.3%) |
| SG&A expenses | 27.2 | 27.9 | +0.7 | 2.6% |
| Operating income | 13.2 | 11.6 | (1.6) | (12.5%) |
| Ordinary profit | 11.8 | 11.0 | (0.7) | (6.3%) |
| (Ordinary profit ratio) | 1.9% | 1.8% | (0.1%) | – |
| Net income attributable to owners of parent | 8.6 | 8.3 | (0.3) | (3.2%) |
| Net income per share (yen) | 324.24 yen | 313.65 yen | (10.6 yen) | (3.3%) |
Capital investment remained robust in the domestic chemical, industrial machinery and carbon-neutral sectors, leading to increased machinery sales and maintenance services, but automobile production remained at the previous year’s level and sales of steel sheets for the construction sector declined; delays in the start of operations at domestic biomass power plants and Australian coal mines also weighed on results, while non-operating income improved due to a decrease in the allowance for doubtful accounts. Interest-bearing debt was reduced to ¥53.4 billion through the generation of free cash flow, and the D/E ratio improved to 0.5x (net D/E ratio: 0.36x). By building up equity and curbing the growth of total assets, the equity ratio improved to 25.8%.
| Item | End of March 2025 (FY2024) | End of March 2026 (FY2025) | Change |
|---|---|---|---|
| Current assets | 337.5 | 330.2 | (7.3) |
| Fixed assets | 49.3 | 53.4 | +4.1 |
| Tangible and intangible fixed assets | 10.7 | 11.2 | +0.5 |
| Investments and other assets | 38.7 | 42.2 | +3.6 |
| Total assets | 386.9 | 383.6 | (3.2) |
| Current liabilities | 272.2 | 257.4 | (14.8) |
| Fixed liabilities | 21.7 | 25.3 | +3.6 |
| Total liabilities | 293.9 | 282.6 | (11.3) |
| Equity | 91.4 | 99.0 | 7.5 |
| Non-controlling interest | 0.15 | 0.2 | 0.5 |
| Net assets | 93.0 | 101.0 | 8.0 |
| External interest-bearing debt | 61.3 | 53.4 | (7.9) |
| Equity ratio | 23.6% | 25.8% | 2.2% |
| D/E ratio | 0.7 times | 0.5 times | (0.1 times) |
| Net assets per share | 3,461.4 yen | 3,746.0 yen | – |
| Closing stock price | 1,914 yen | 2,292 yen | – |
| PBR | 0.55 times | 0.61 times | – |
Segment Results
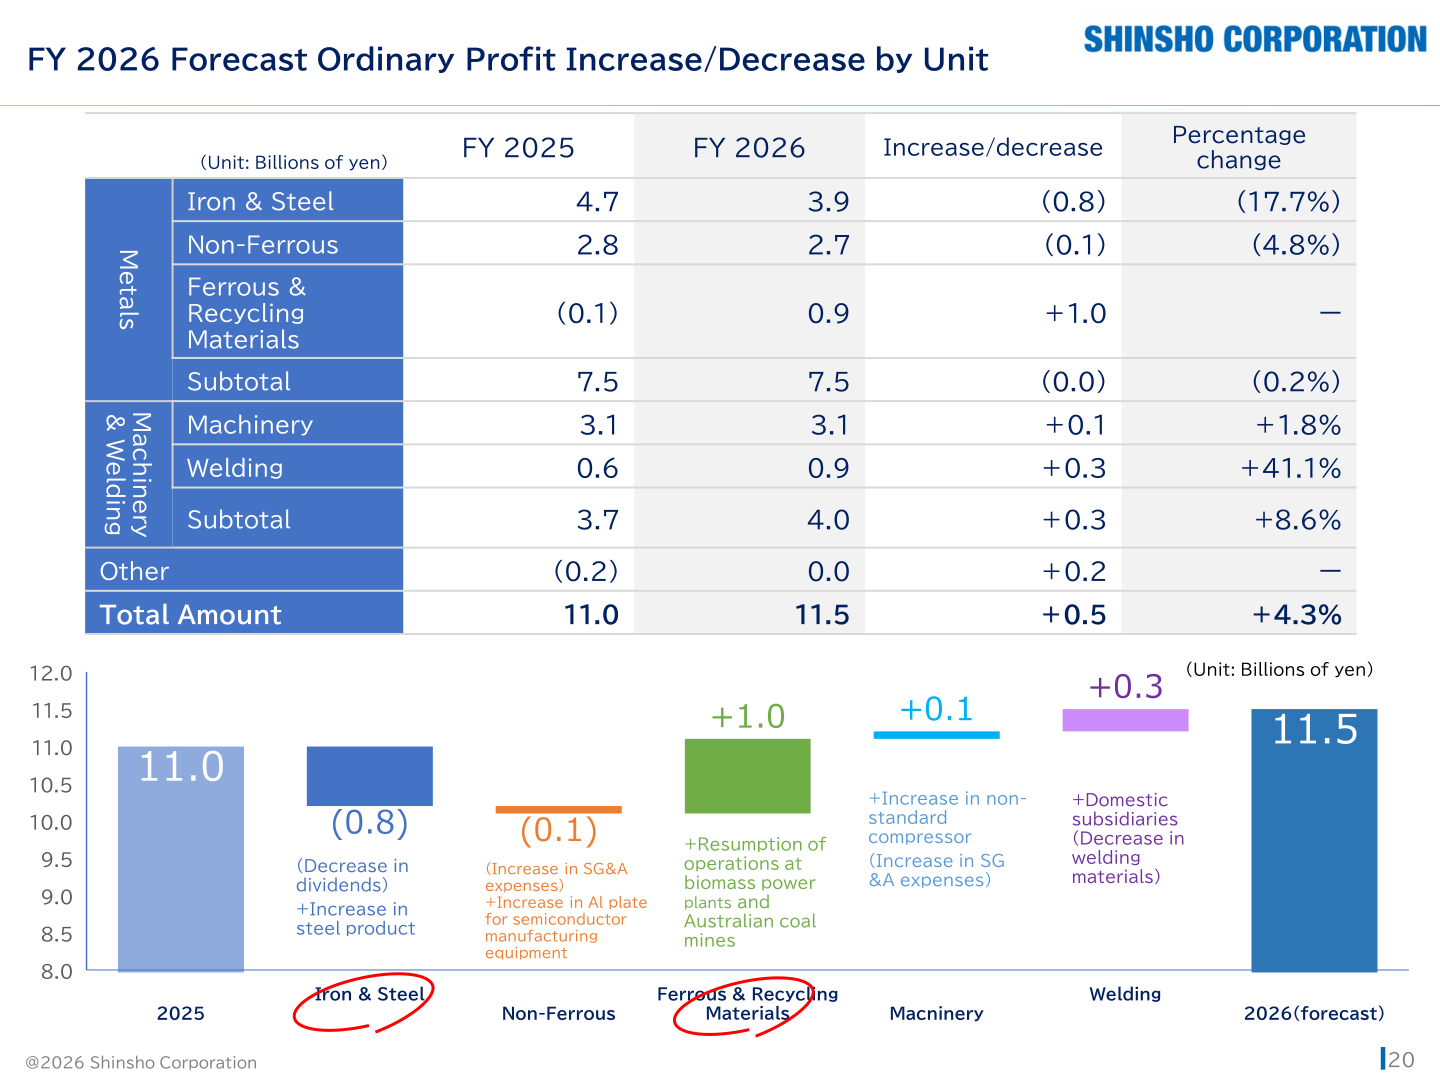
By business unit, in the Iron & Steel unit, profit declined on a non-consolidated basis due to a decrease in steel sales volume caused by sluggish demand in the building materials sector, compounded by falling steel prices; this was partly offset by an increase in dividends received from investee companies, while subsidiaries’ profit declined due to the reversal of negative goodwill at an equity-method affiliate in the prior year. In the Non-Ferrous unit, higher metal prices contributed to increased profit on a non-consolidated basis, but earnings declined due to a decrease in the volume of aluminum sheet sold to the automotive sector, and subsidiaries’ profit declined due to a decrease in semiconductor-related business. In the Ferrous & Recycling Materials unit, there was an impact from a decline in biomass fuel handling due to reduced operations at business partners, though profit was supported by a decrease in the allowance for doubtful accounts; subsidiaries’ profit declined due to delays in the start of operations at Australian coal mines and the absence of one-time gains recorded in the previous fiscal year. In the Machinery unit, sales of machinery such as heat pumps and non-standard compressors increased, and maintenance and service operations also performed well; the domestic subsidiary Matsubo Corp saw strong order intake, and profit in the construction machinery parts business in China increased. In the Welding unit, prices for welding materials rose, but sales volumes declined.
| Business Unit | Metric | FY2025 (Actual) | FY2026 (Forecast) | Increase/Decrease | % Change |
|---|---|---|---|---|---|
| Iron & Steel | Ordinary profit (¥bn) | 4.7 | 3.9 | (0.8) | (17.7%) |
| Non-Ferrous | Ordinary profit (¥bn) | 2.8 | 2.7 | (0.1) | (4.8%) |
| Ferrous & Recycling Materials | Ordinary profit (¥bn) | (0.1) | 0.9 | +1.0 | – |
| Metals Subtotal | Ordinary profit (¥bn) | 7.5 | 7.5 | (0.0) | (0.2%) |
| Machinery | Ordinary profit (¥bn) | 3.1 | 3.1 | +0.1 | +1.8% |
| Welding | Ordinary profit (¥bn) | 0.6 | 0.9 | +0.3 | +41.1% |
| Machinery & Welding Subtotal | Ordinary profit (¥bn) | 3.7 | 4.0 | +0.3 | +8.6% |
| Other | Ordinary profit (¥bn) | (0.2) | 0.0 | +0.2 | – |
| Total Amount | Ordinary profit (¥bn) | 11.0 | 11.5 | +0.5 | +4.3% |
FY2026 Forecast
Global production by Japanese automakers is expected to remain at the previous year’s level. Steel prices are expected to rise in the second half of the fiscal year, while aluminum and copper prices are expected to remain at high levels through FY2026. Demand related to semiconductor manufacturing equipment is also expected to recover, resulting in net sales of ¥686.0 billion, up ¥77.9 billion year on year. Ordinary profit is projected to increase by ¥0.5 billion to ¥11.5 billion, driven by strong demand for machinery and equipment related to carbon neutrality among other factors, while net income is expected to increase by ¥0.7 billion to ¥9.0 billion. The forecast assumes an exchange rate of ¥145 to the US dollar, with foreign exchange sensitivity of approximately ±¥40 million per ¥1 change in the exchange rate. Regarding the situation in the Middle East, the company states that while disruptions in crude oil and naphtha supply chains and rising ocean freight rates could potentially affect production and costs, it has not identified any events at this time that would have a material impact on its business performance.
| Item | FY2025 (Actual) | FY2026 (Forecast) | Change |
|---|---|---|---|
| Net sales | 608.1 | 686.0 | +77.9 billion |
| Operating profit | 11.6 | 12.1 | +0.5 billion |
| Ordinary income | 11.0 | 11.5 | +0.5 billion |
| Net income attributable to owners of parent | 8.3 | 9.0 | +0.7 billion |
| ROE | 8.7% | 9.0% | +0.3% |
| ROIC | 5.1% | 5.9% | +0.8% |
| Capital adequacy ratio | 25.8% | 26.0% | +0.2% |
| Annual dividend per share | 106 yen | 130 yen | (+24 yen from the previous year) |
Shareholder Returns
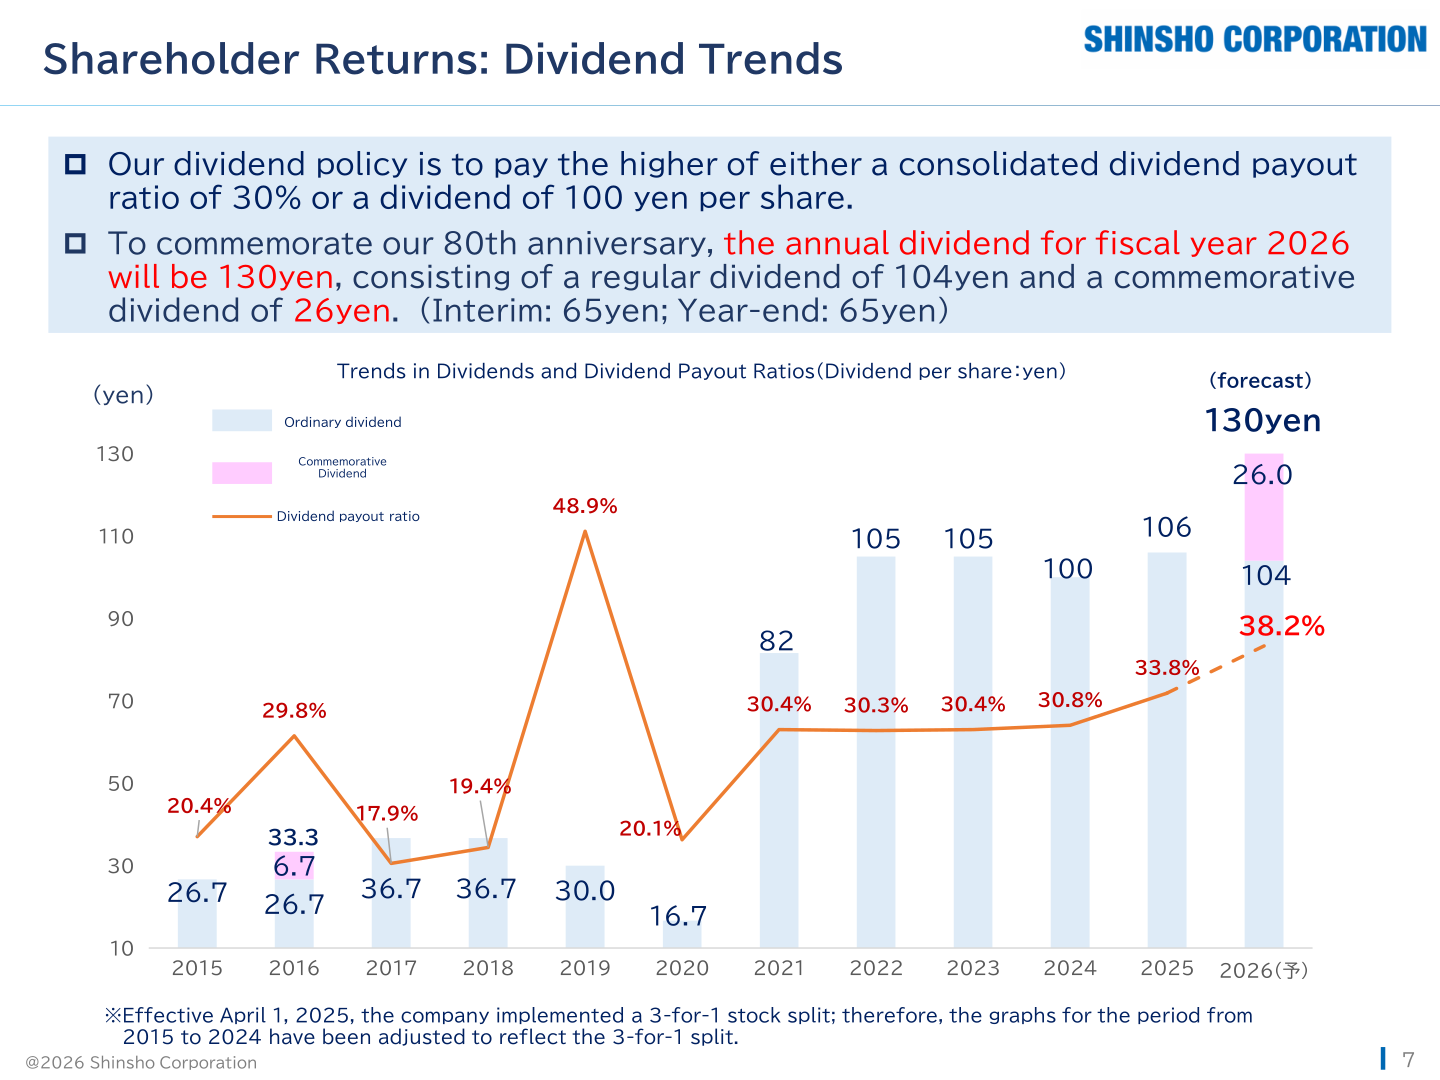
The company’s dividend policy is to pay the higher of either a consolidated dividend payout ratio of 30% or a dividend of ¥100 per share. To commemorate its 80th anniversary, the annual dividend for fiscal year 2026 will be ¥130, consisting of a regular dividend of ¥104 and a commemorative dividend of ¥26 (interim: ¥65; year-end: ¥65). For FY2025, the company paid a total annual dividend of ¥106 per share (¥53 interim, ¥53 year-end).
| Item | FY2025 (Actual) | FY2026 (Forecast) |
|---|---|---|
| Interim dividend | 53 yen | 65 yen |
| Year-end dividend | 53 yen | 65 yen |
| of which commemorative dividend | – | 26 yen |
| Annual dividend per share | 106 yen | 130 yen |
| Dividend payout ratio | 33.8% | 38.2% |
Medium-Term Management Plan
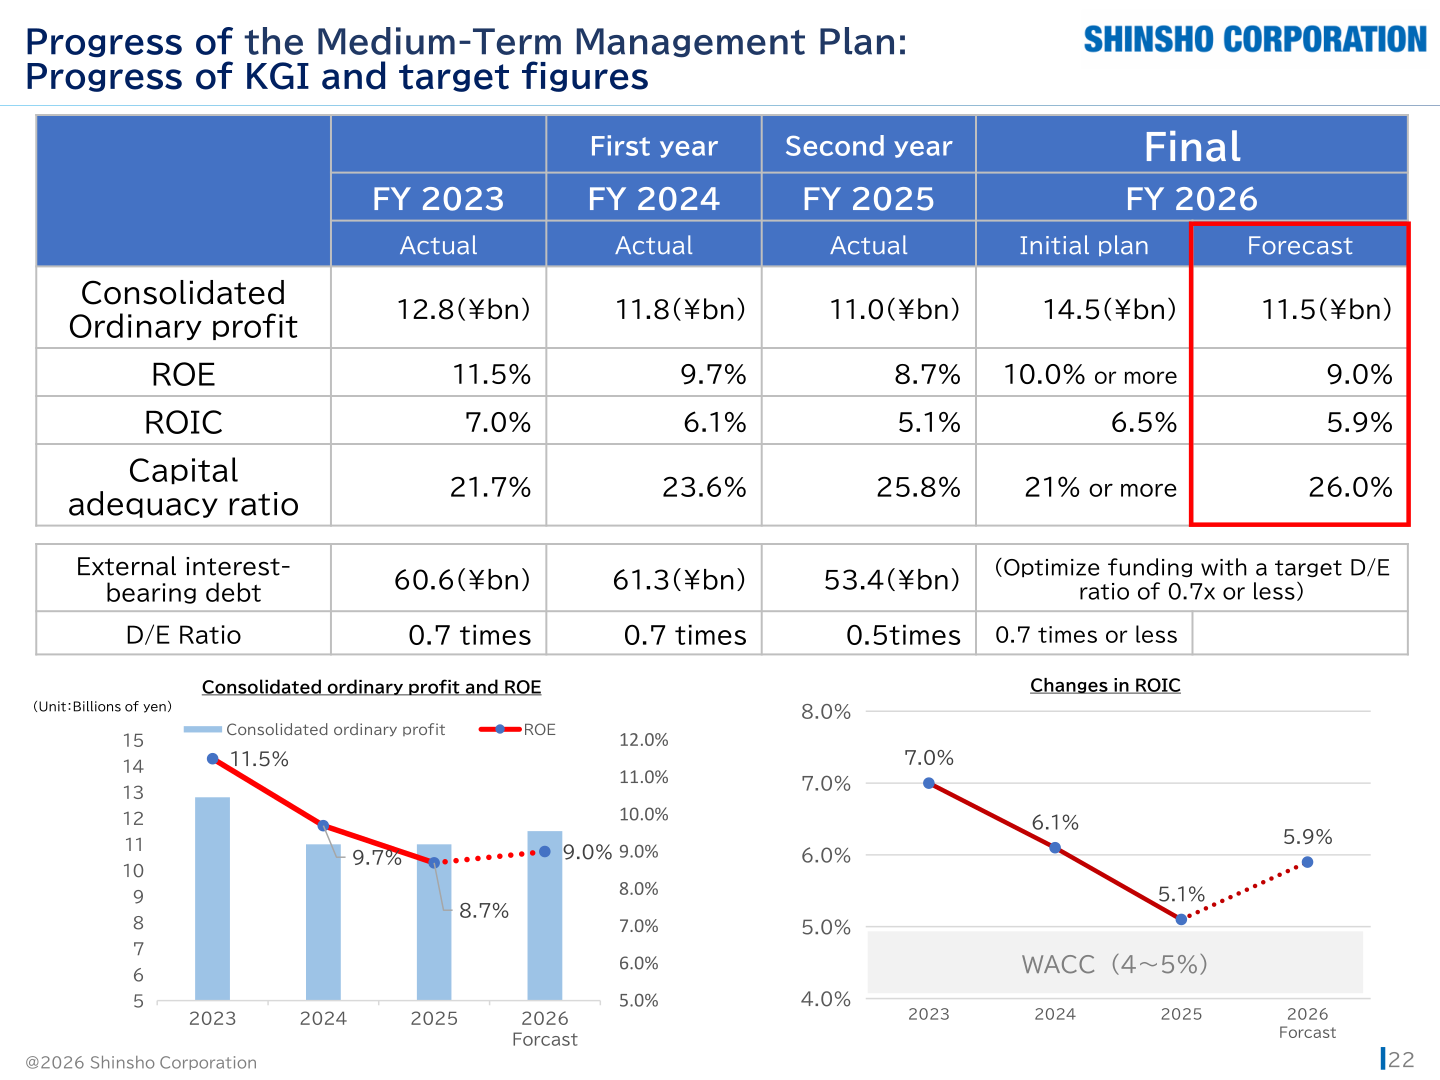
Under its medium-term management plan, consolidated ordinary profit was ¥12.8 billion in FY2023 (first year), ¥11.8 billion in FY2024 (second year) and ¥11.0 billion in FY2025 (third year), against an initial FY2026 (final year) plan of ¥14.5 billion; the FY2026 forecast is ¥11.5 billion. The company attributes the variance from the FY2026 medium-term management plan primarily to the Iron & Steel and Ferrous & Recycling Materials units. In the Iron & Steel unit, profits declined primarily due to falling steel prices and decreased sales of steel sheets to Japanese automakers and the construction sector. In the Ferrous & Recycling Materials unit, profits declined due to the suspension of operations at a client’s biomass power plant and poor performance at an Australian coal mine. In the Machinery unit, profits increased as the growing focus on carbon neutrality led to an increase in the handling of decarbonization-related equipment, such as non-standard compressors and heat pumps.
| Metric | FY2023 (Actual) | FY2024 (Actual) | FY2025 (Actual) | FY2026 (Initial Plan) | FY2026 (Forecast) |
|---|---|---|---|---|---|
| Consolidated ordinary profit (¥bn) | 12.8(¥bn) | 11.8(¥bn) | 11.0(¥bn) | 14.5(¥bn) | 11.5(¥bn) |
| ROE | 11.5% | 9.7% | 8.7% | 10.0% or more | 9.0% |
| ROIC | 7.0% | 6.1% | 5.1% | 6.5% | 5.9% |
| Capital adequacy ratio | 21.7% | 23.6% | 25.8% | 21% or more | 26.0% |
| External interest-bearing debt (¥bn) | 60.6(¥bn) | 61.3(¥bn) | 53.4(¥bn) | (Optimize funding with a target D/E ratio of 0.7x or less) | (Optimize funding with a target D/E ratio of 0.7x or less) |
| D/E ratio | 0.7 times | 0.7 times | 0.5times | 0.7 times or less | 0.7 times or less |
This article is an analysis based on publicly available information and is not a recommendation to buy or sell any specific securities. Investment decisions are your own responsibility.
















