
This article is based on publicly available IR materials and is not a recommendation to buy or sell any specific securities.
Daiichi Jitsugyo Co., Ltd. (DJK) reported record-high operating income for the third consecutive fiscal year in FY2025 (the year ended March 31, 2026), even as net sales and orders received declined slightly. Net sales were 219,140 million yen (-1.2% year on year) and operating income rose to 13,696 million yen (+4.5%), while ordinary income increased 5.6% to 14,353 million yen and profit attributable to owners of parent rose 12.6% to 9,951 million yen. Growth was led by the Automotive, Healthcare and Aviation & Social Infrastructure businesses, with significant contributions from India in the Industrial Machinery and Automotive businesses. For FY2026, the first full forecast year of the medium-term business plan MT2027, the company expects net sales and operating income to decline as it enters an investment phase, while continuing to raise shareholder returns.
Consolidated Results (Full-Year Actual)
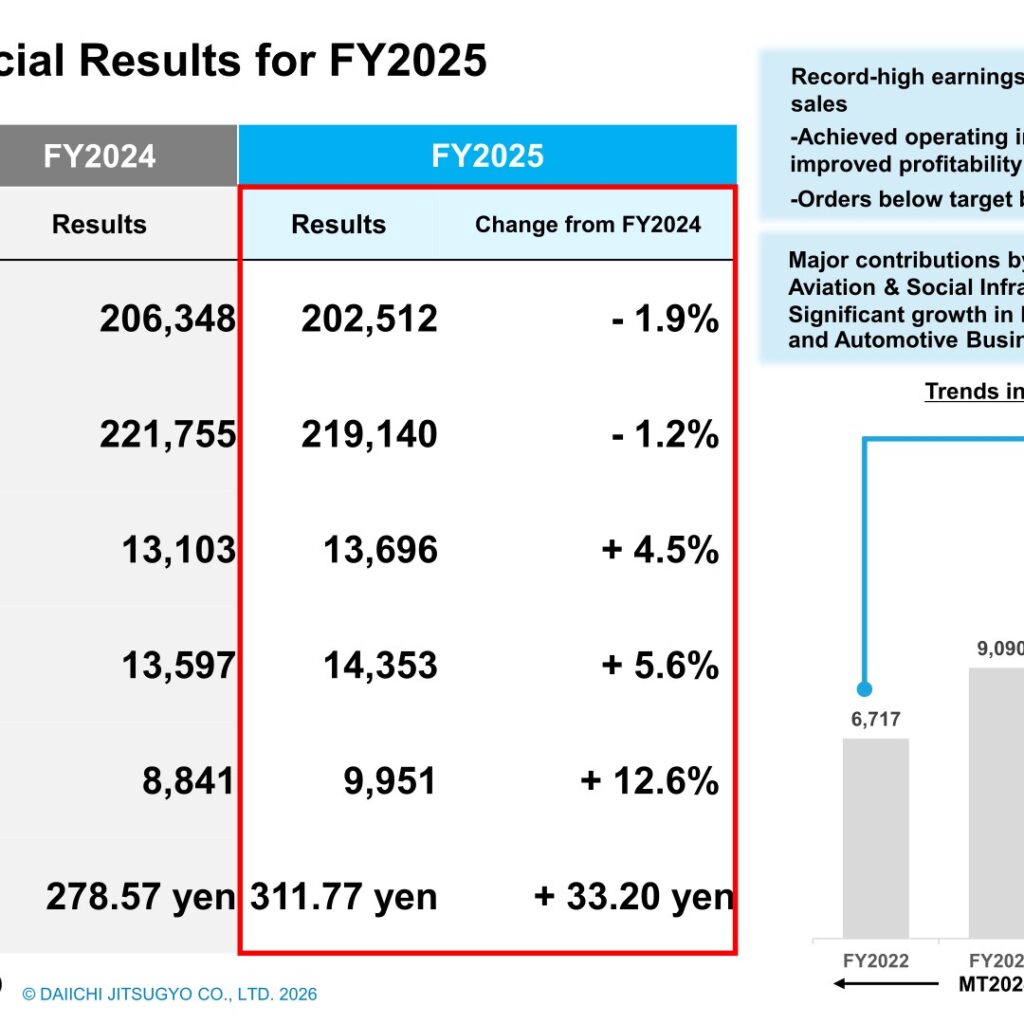
Orders received declined 1.9% to 202,512 million yen, described in the presentation as falling below target but recovering in the second half. Despite flat-to-lower net sales, operating income, ordinary income and profit attributable to owners of parent all reached record highs, which the company attributes to an improved operating income rate of 6.3% driven by the realization of profits from large projects and improved profitability. Operating income has grown from 6,717 million yen in FY2022 (the first year of the previous medium-term plan, MT2024) to 13,696 million yen in FY2025, a cumulative increase of +104% (CAGR 26.8%).
| Item | FY2025 | FY2024 | Change |
|---|---|---|---|
| Orders received | 202,512 | 206,348 | -1.9% |
| Net sales | 219,140 | 221,755 | -1.2% |
| Operating income | 13,696 | 13,103 | +4.5% |
| Ordinary income | 14,353 | 13,597 | +5.6% |
| Profit attributable to owners of parent | 9,951 | 8,841 | +12.6% |
| EPS | 311.77 yen | 278.57 yen | +33.20 yen |
On the balance sheet, total assets increased to 175,639 million yen (+4,265 million yen) and equity rose to 90,490 million yen (+10,803 million yen), lifting the equity ratio to 51.5% (+5.0%). Interest-bearing liabilities increased to 7,495 million yen (+4,909 million yen) and DER rose to 0.08 times (+0.05). Cash and cash equivalents at the end of the period were 51.829 billion yen (+17.946 billion yen), reflecting operating cash flow of 16,136 million yen, investing cash flow of -188 million yen and financing cash flow of +1,221 million yen.
| Item (Yen in millions) | FY2025 | FY2024 | Change |
|---|---|---|---|
| Total assets | 175,639 | 171,373 | +4,265 |
| Equity | 90,490 | This cannot be confirmed from the materials. | +10,803 |
| Equity ratio | 51.5% | 46.5% | +5.0% |
| Interest-bearing liabilities | 7,495 | 2,585 | +4,909 |
| DER (times) | 0.08 | 0.03 | +0.05 |
| Cash flows – operating activities | 16,136 | 11,594 | |
| Cash flows – investing activities | -188 | -1,290 | |
| Cash flows – financing activities | 1,221 | -7,690 |
Segment Results
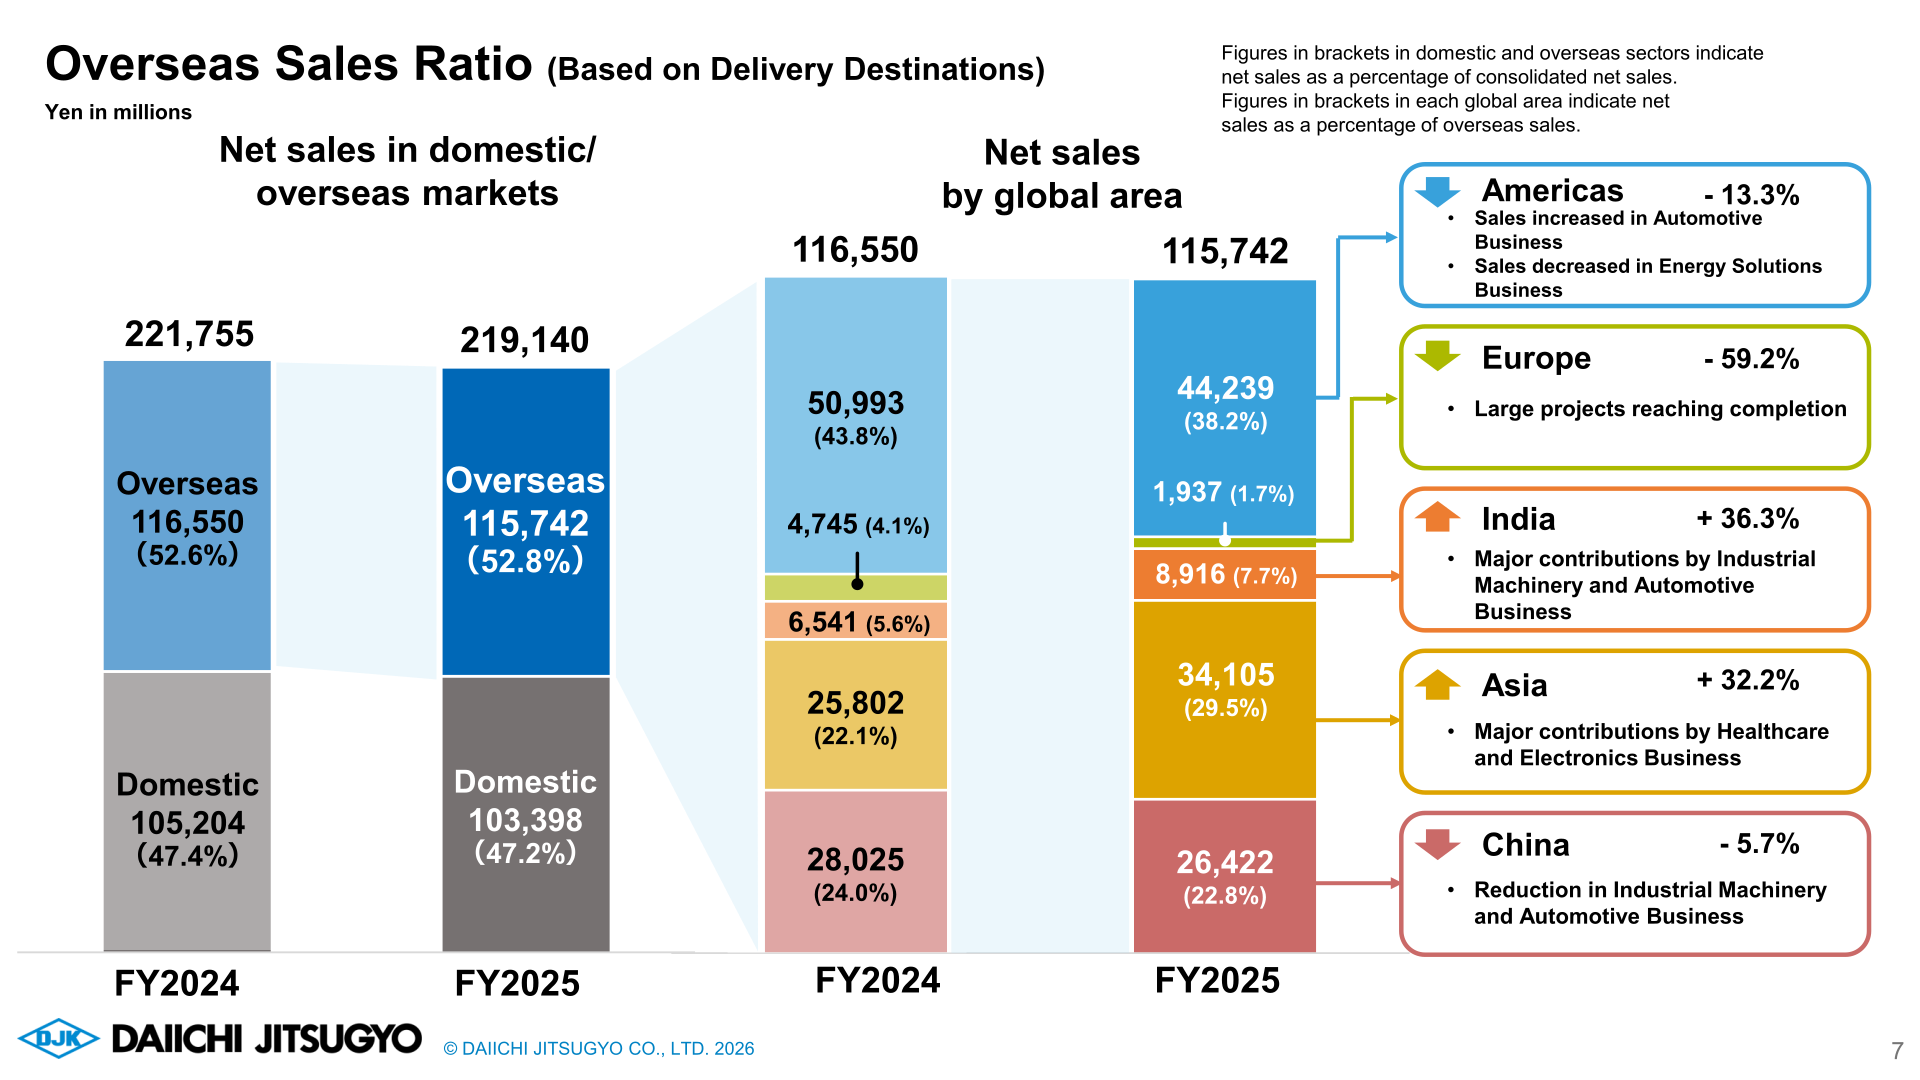
By segment, Healthcare (+51.4% net sales, +44.9% operating income) and Aviation & Social Infrastructure (+57.0% net sales, +105.2% operating income) recorded the strongest growth, driven by increased engineering-related large projects globally and continued demand for labor-saving solutions and ground support equipment at airports, respectively. Automotive also grew (+4.3% net sales, +18.1% operating income) on large projects in North America, India and Japan. Energy Solutions net sales fell 26.0% on weaker sales in Japan, though cost management limited the operating income decline to -1.5%; Industrial Machinery and Plant & Energy both declined on lower large-project sales. By destination, overseas net sales were 115,742 million yen (52.8% of the total), with India up 36.3% and Asia up 32.2%, offsetting declines in Europe (-59.2%, as large projects reached completion) and the Americas (-13.3%).
| Segment | Metric | FY2025 | FY2024 |
|---|---|---|---|
| Plant & Energy | Net Sales | 22,415 | 23,856 |
| Plant & Energy | Operating Income | 1,625 | 1,843 |
| Energy Solutions | Net Sales | 40,044 | 54,101 |
| Energy Solutions | Operating Income | 2,644 | 2,684 |
| Industrial Machinery | Net Sales | 27,210 | 29,505 |
| Industrial Machinery | Operating Income | 740 | 890 |
| Electronics | Net Sales | 51,073 | 50,044 |
| Electronics | Operating Income | 2,747 | 2,694 |
| Automotive | Net Sales | 42,508 | 40,742 |
| Automotive | Operating Income | 2,581 | 2,186 |
| Healthcare | Net Sales | 23,826 | 15,742 |
| Healthcare | Operating Income | 2,400 | 1,656 |
| Aviation & Social Infrastructure | Net Sales | 11,990 | 7,639 |
| Aviation & Social Infrastructure | Operating Income | 1,049 | 511 |
| Total | Net Sales | 219,140 | 221,755 |
| Total | Operating Income | 13,696 | 13,103 |
FY2026 Forecast
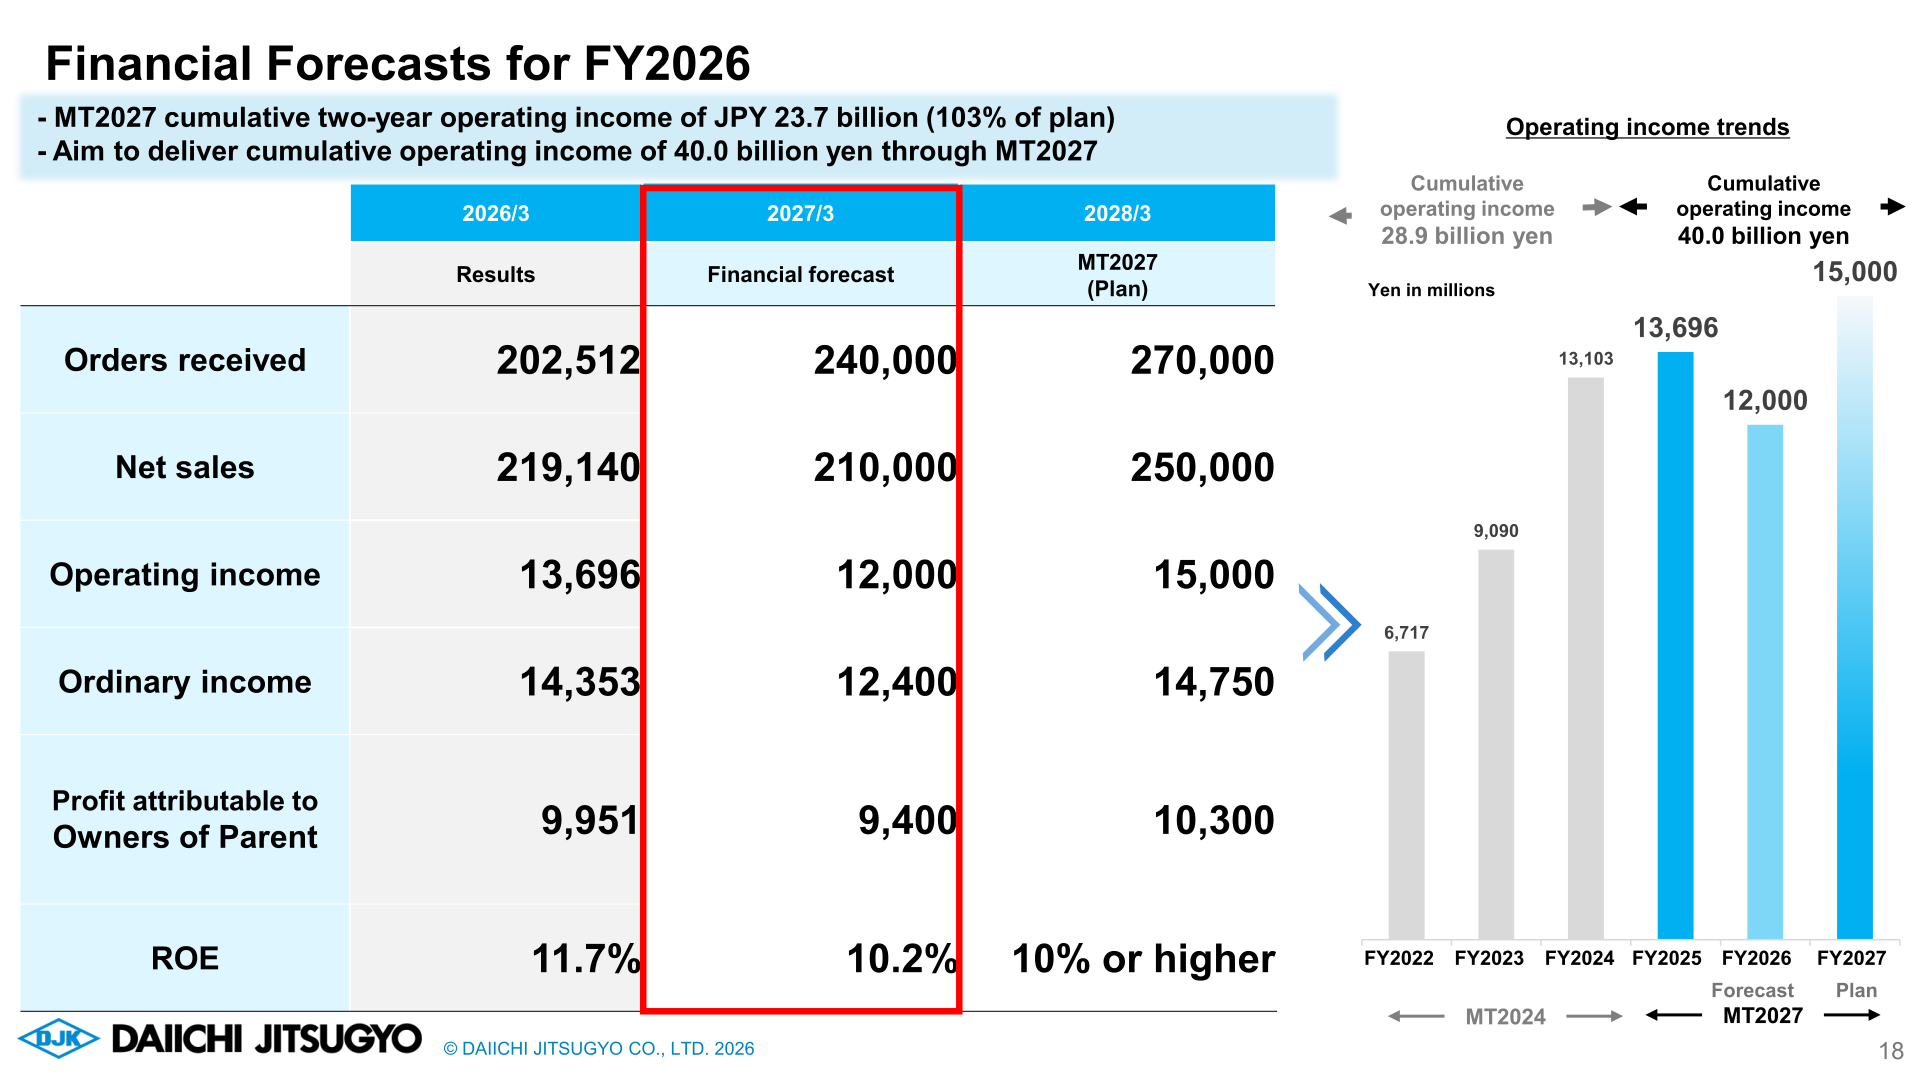
For FY2026 (the year ending March 31, 2027), the company forecasts orders received of 240,000 million yen (up from 202,512 million yen), net sales of 210,000 million yen (-4.2%) and operating income of 12,000 million yen (-12.4%), with ROE of 10.2% versus 11.7% in FY2025. By segment, Electronics is expected to grow strongly (net sales +28.2%, operating income +16.5%) on chip shooters for AI servers and AI chip packaging and backend semiconductor equipment, while Energy Solutions is forecast to decline sharply (net sales -38.8%, operating income -52.0%) as large North American battery-related projects from FY2025 are not repeated. The company describes FY2026 as a period to lay the groundwork for future growth, targeting cumulative operating income of 40.0 billion yen through the three years of MT2027 (versus 28.9 billion yen cumulative under the previous plan, MT2024), with a two-year cumulative of 23.7 billion yen (103% of plan) through FY2026.
| Item | FY2026 Forecast | FY2025 (Actual) | Change |
|---|---|---|---|
| Orders received | 240,000 | 202,512 | |
| Net sales | 210,000 | 219,140 | -4.2% |
| Operating income | 12,000 | 13,696 | -12.4% |
| Ordinary income | 12,400 | 14,353 | |
| Profit attributable to owners of parent | 9,400 | 9,951 | |
| ROE | 10.2% | 11.7% |
Shareholder Returns
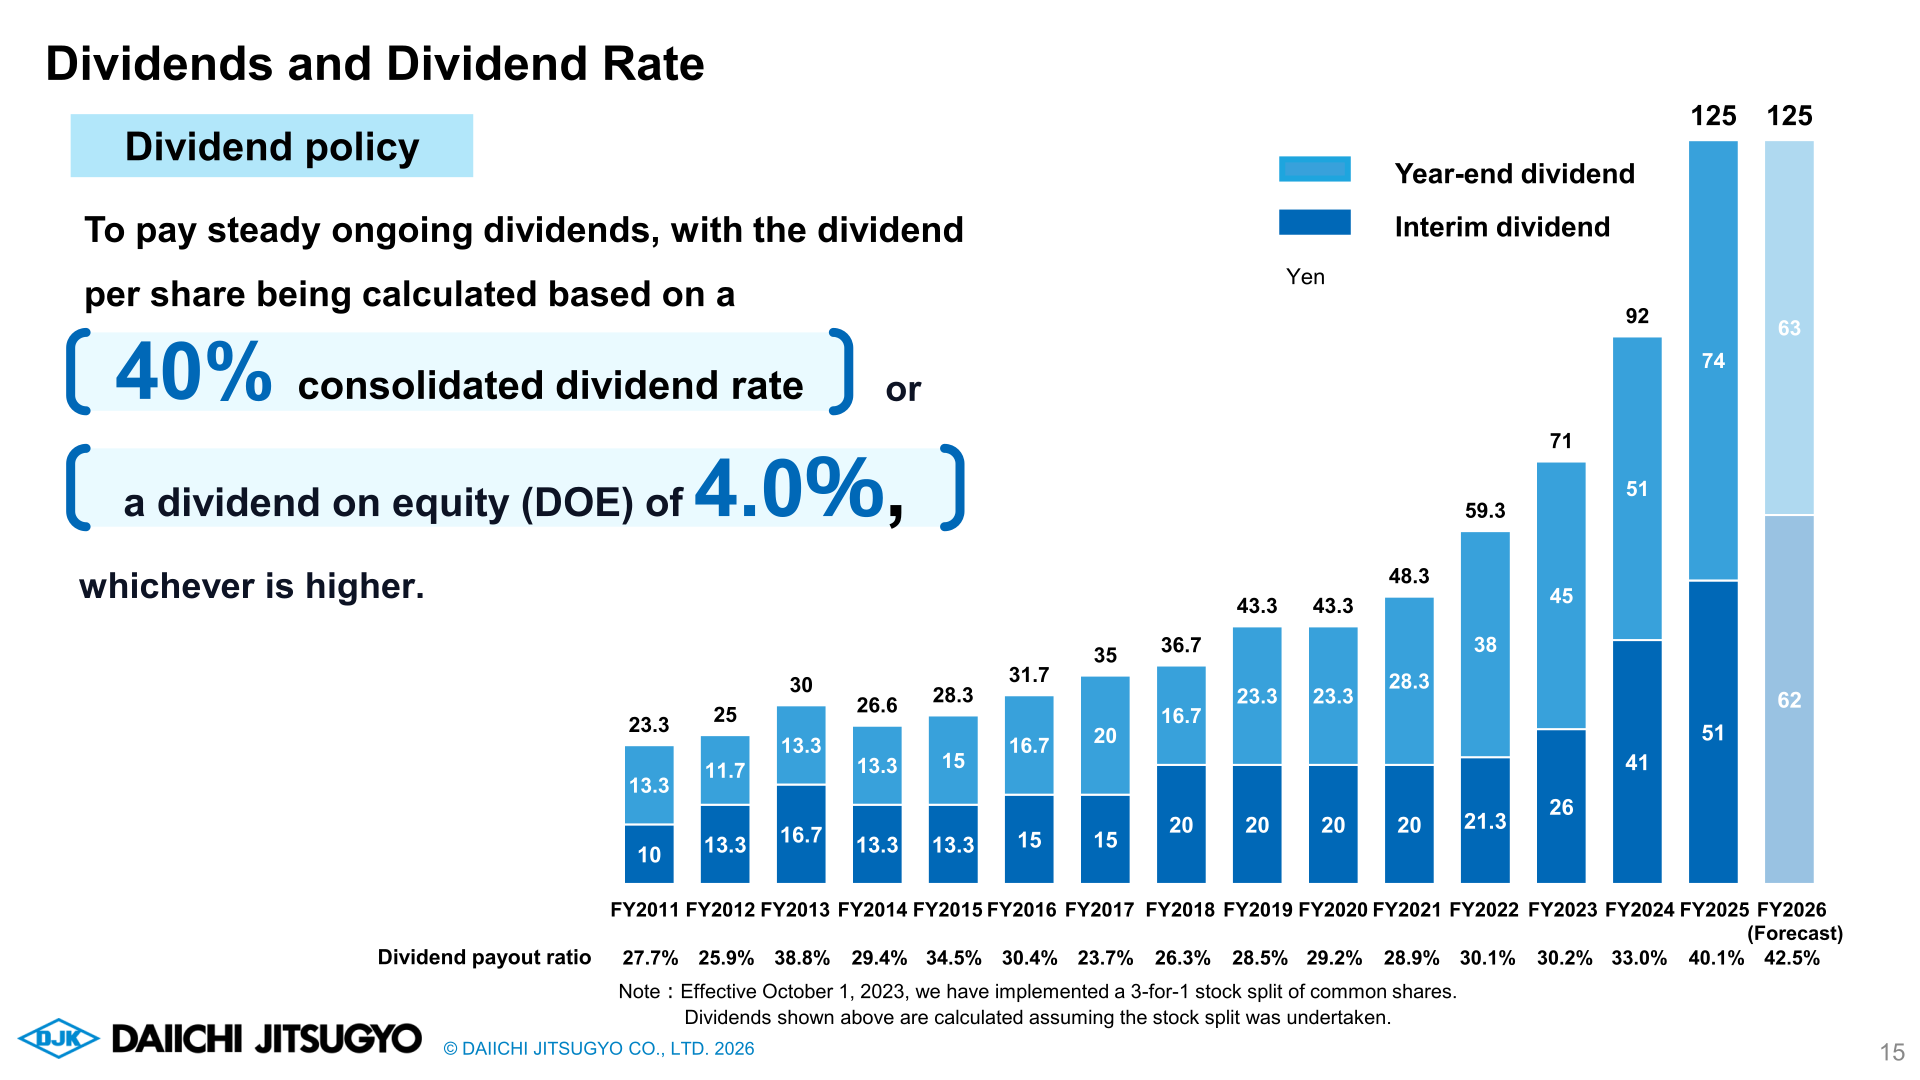
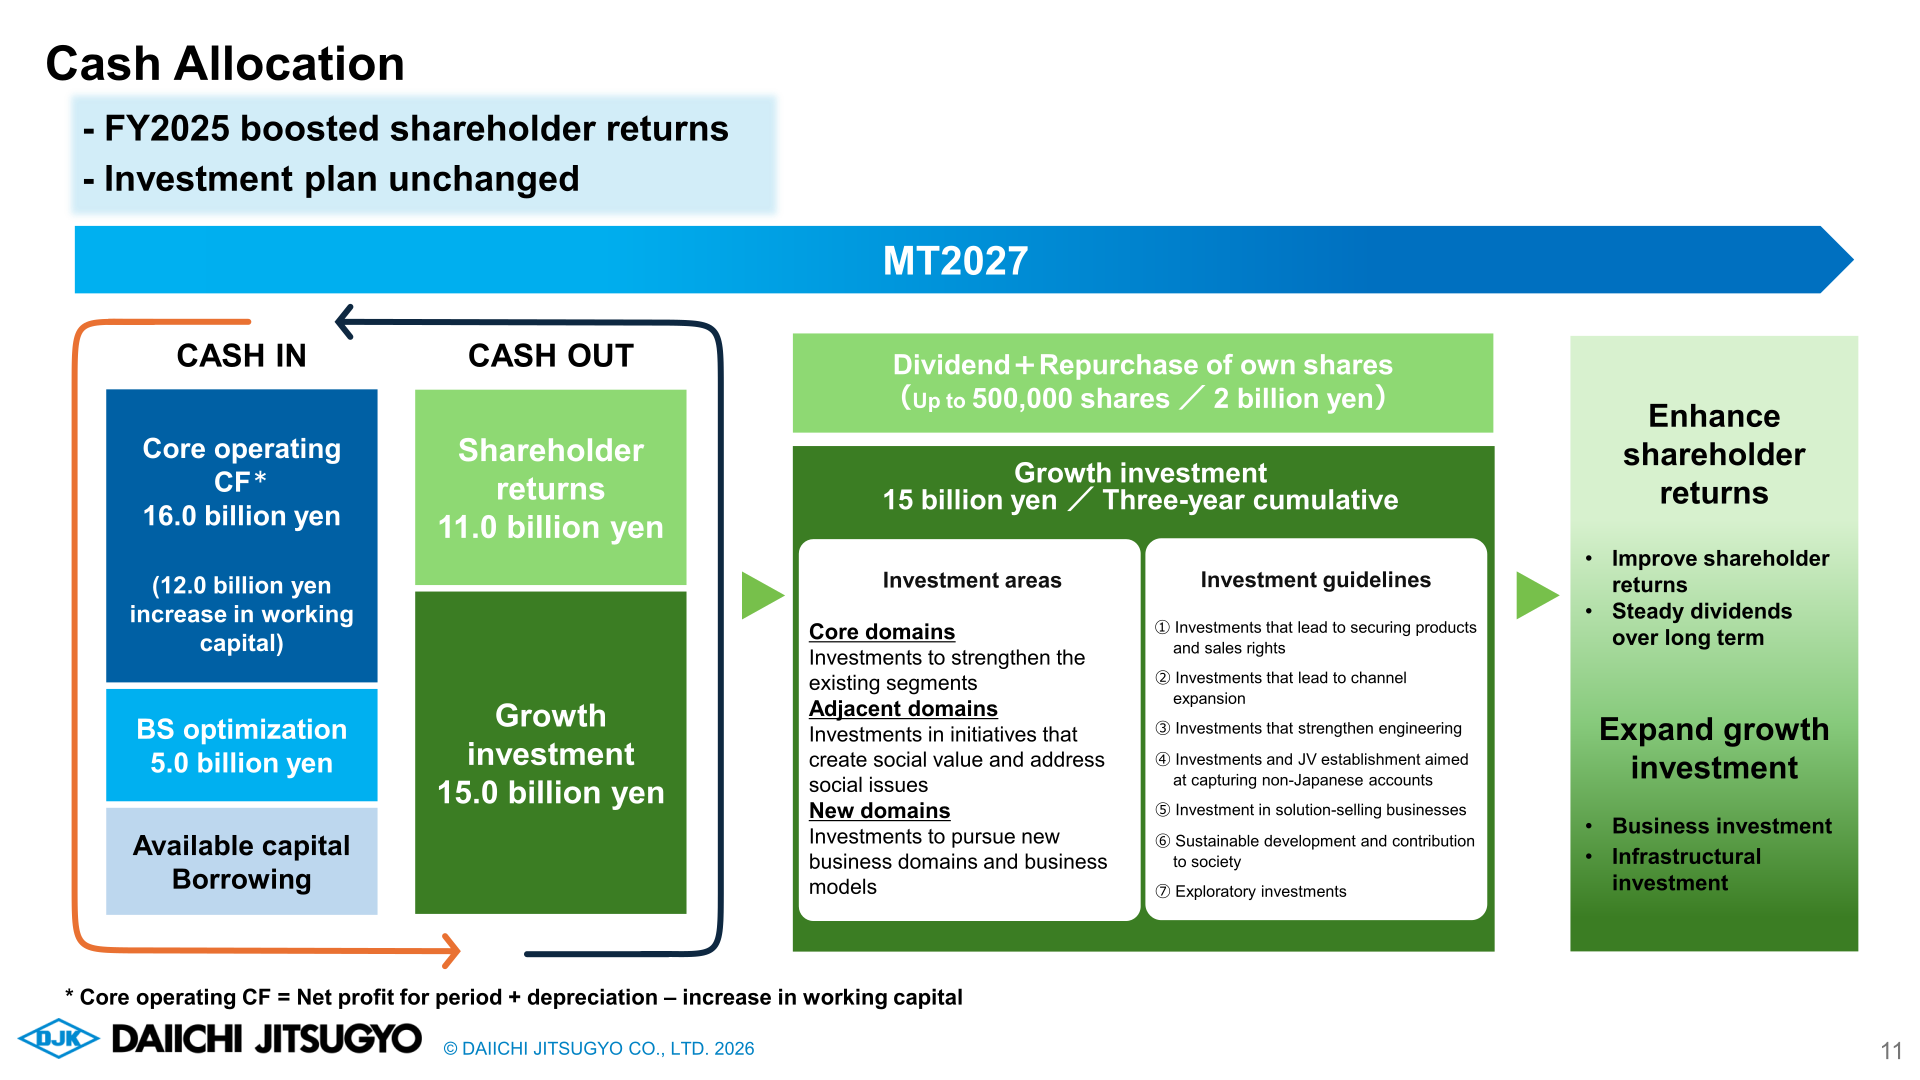
DJK’s dividend policy is to pay a stable, ongoing dividend based on a 40% consolidated dividend payout ratio or a dividend on equity (DOE) of 4.0%, whichever is higher. The annual dividend for FY2025 was 125 yen per share (payout ratio 40.1%), and the company forecasts an unchanged annual dividend of 125 yen for FY2026 (payout ratio forecast of 42.5%). Dividend figures reflect a 3-for-1 stock split of common shares effective October 1, 2023. The company is also repurchasing up to 500,000 shares (equivalent to 1.6% of shares issued, excluding treasury stock) for up to 2,000,000,000 yen between May 13, 2026 and September 30, 2026, for the stated purposes of optimizing the capital structure and enhancing shareholder returns; the repurchased shares are planned to be cancelled. Under its MT2027 cash allocation plan, DJK plans cumulative shareholder returns of 11.0 billion yen and growth investment of 15.0 billion yen over three years, funded by core operating cash flow of 16.0 billion yen and BS optimization of 5.0 billion yen.
| Fiscal Year | Annual Dividend per Share (Yen) | Dividend Payout Ratio (Consolidated) |
|---|---|---|
| FY2022 | 59.3 | 30.1% |
| FY2023 | 71 | 30.2% |
| FY2024 | 92 | 33.0% |
| FY2025 | 125 | 40.1% |
| FY2026 (Forecast) | 125 | 42.5% |
Medium-Term Plan / Topics
FY2025 was the first year of DJK’s medium-term business plan MT2027. The company reports overall progress rated “good” (◎) on business strategies to accelerate growth and on building a resilient management foundation, including the transfer of manufacturing and sales rights for small-scale binary power generation systems, broader adoption of solution-based engineering offerings, and increased sales in India in the Industrial Machinery and Automotive businesses. Business investment, rated as needing acceleration (△), included an investment in a joint venture, NITTOKU FA INDIA, with plans to accelerate business investment in earnest from FY2026 with a rigorous selection focused on strengthening business foundations and generating synergies. As of March 2026, PBR was 1.14 (versus 0.87 in March 2025) and ROE was 11.7% (versus 11.6%), against MT2027 targets of sustaining PBR above 1x and achieving ROE of 10% or higher. The number of institutional investor meetings increased to 47 in FY2025 from 29 in FY2024 and 17 in FY2024’s predecessor year, as part of the company’s strengthened IR activities.
This article is an analysis based on publicly available information and is not a recommendation to buy or sell any specific securities. Investment decisions are your own responsibility.
















