
This article is based on publicly available IR materials and is not a recommendation to buy or sell any specific securities.
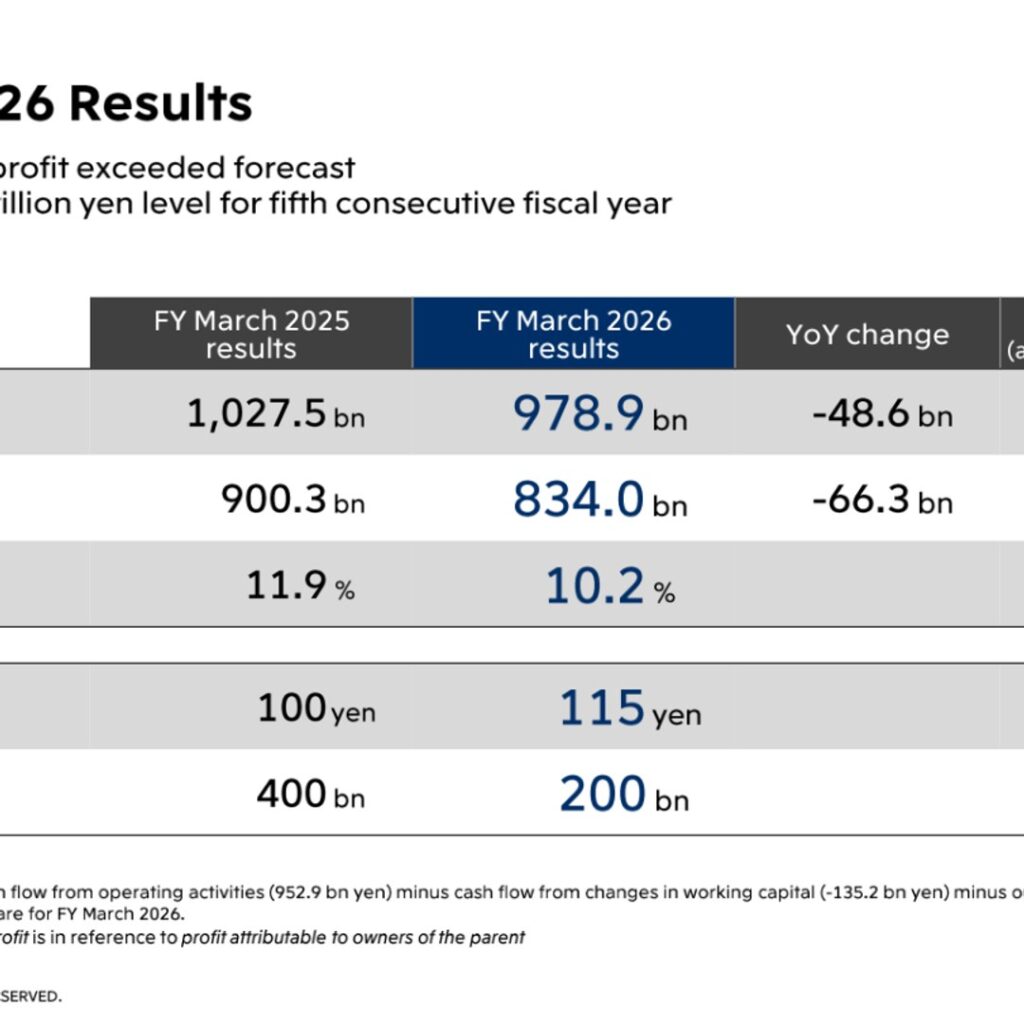
Mitsui & Co., Ltd. reported profit attributable to owners of the parent of 834.0 bn yen for FY March 2026 (April 2025-March 2026), down 66.3 bn yen year-on-year but above the company’s forecast of 820 bn yen announced in February 2026. Core Operating Cash Flow (COCF) was 978.9 bn yen, down 48.6 bn yen year-on-year and also above the 950 bn yen forecast; the results presentation states that COCF has reached the 1 trillion yen level for the fifth consecutive fiscal year. ROE was 10.2%, down from 11.9% a year earlier. The company raised the full-year dividend per share to 115 yen (interim 55 yen / year-end 60 yen), up 15 yen year-on-year, and executed 200 bn yen of share repurchases during the year.
Consolidated Results (Full-Year Actual)
Gross profit for FY March 2026 was 1,328.2 bn yen (FY March 2025: 1,288.4 bn yen, +39.8 bn yen), and SG&A expenses were -902.1 bn yen (FY March 2025: -887.7 bn yen, -14.4 bn yen). Gain on securities and other investments-net was 35.3 bn yen (FY March 2025: 116.3 bn yen, -81.0 bn yen), profit of equity method investments was 447.4 bn yen (FY March 2025: 494.1 bn yen, -46.7 bn yen), and dividend income was 178.7 bn yen (FY March 2025: 184.3 bn yen, -5.6 bn yen). After income taxes of -222.7 bn yen and non-controlling interests of -30.4 bn yen, profit attributable to owners of the parent totaled 834.0 bn yen.
| Item | FY March 2025 (Results) | FY March 2026 (Results) | YoY Change | FY March 2026 Forecast (announced Feb 2026) |
|---|---|---|---|---|
| COCF | 1,027.5 bn yen | 978.9 bn yen | -48.6 bn yen | 950 bn yen |
| Profit | 900.3 bn yen | 834.0 bn yen | -66.3 bn yen | 820 bn yen |
| ROE | 11.9% | 10.2% | – | – |
| Dividend per share | 100 yen | 115 yen | – | 115 yen |
| Share repurchases | 400 bn yen | 200 bn yen | – | 200 bn yen |
Segment Results
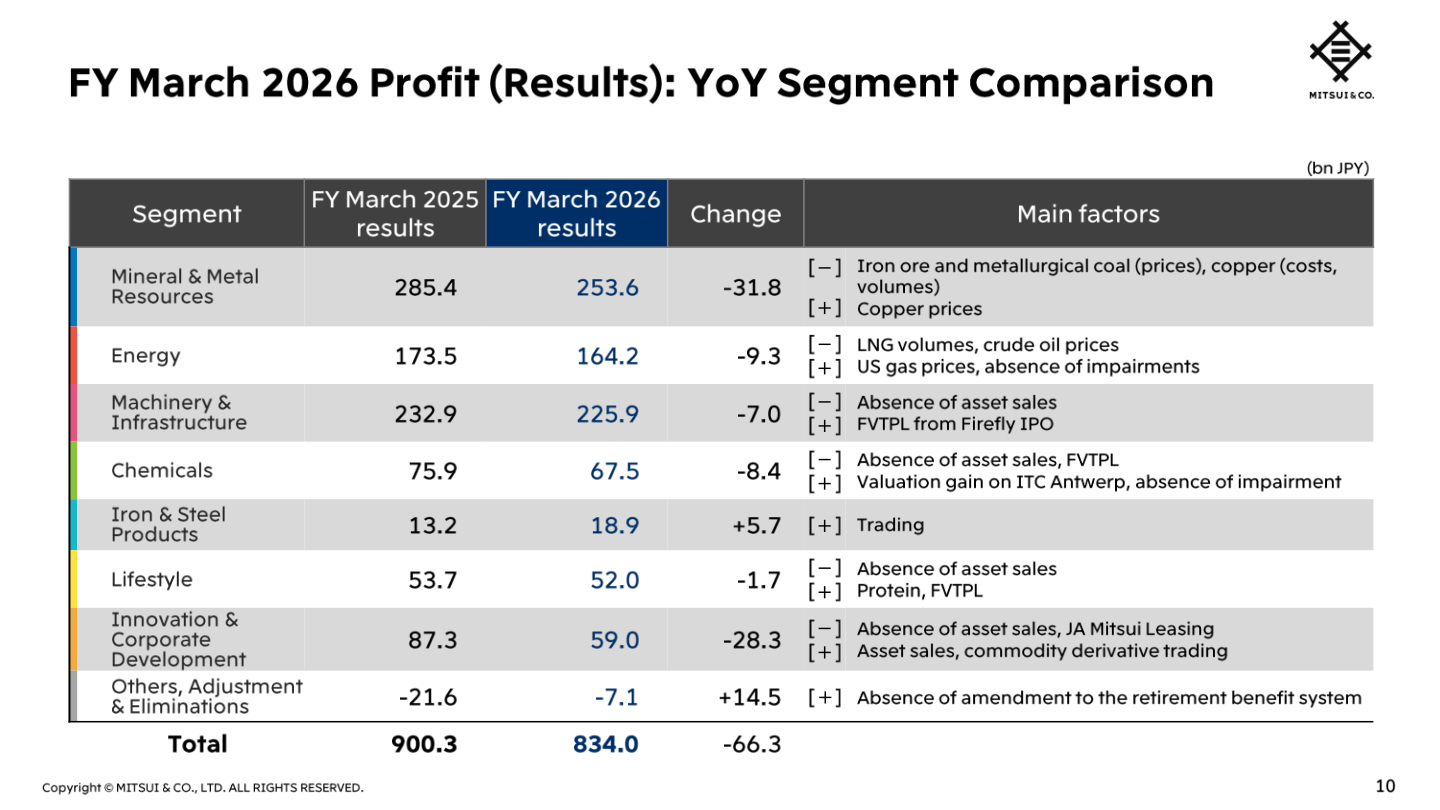
By segment, profit at Mineral & Metal Resources declined 31.8 bn yen to 253.6 bn yen mainly on iron ore and metallurgical coal prices and higher copper costs/volumes, partly offset by higher copper prices. Energy profit fell 9.3 bn yen to 164.2 bn yen on lower LNG volumes and crude oil prices, partly offset by US gas prices and the absence of impairments. Machinery & Infrastructure profit was down 7.0 bn yen to 225.9 bn yen on the absence of asset sales, partly offset by FVTPL gains from the Firefly IPO. Chemicals profit fell 8.4 bn yen to 67.5 bn yen on the absence of asset sales and FVTPL gains, partly offset by a valuation gain on ITC Antwerp and the absence of impairment. Iron & Steel Products profit rose 5.7 bn yen to 18.9 bn yen on trading. Lifestyle profit was down 1.7 bn yen to 52.0 bn yen on the absence of asset sales, partly offset by protein and FVTPL gains. Innovation & Corporate Development profit fell 28.3 bn yen to 59.0 bn yen mainly on the absence of asset sales and a loss at JA Mitsui Leasing, partly offset by asset sales and commodity derivative trading. Others, Adjustment & Eliminations improved 14.5 bn yen to -7.1 bn yen on the absence of an amendment to the retirement benefit system in the prior year.
| Segment | FY March 2025 (Results) | FY March 2026 (Results) | YoY Change |
|---|---|---|---|
| Mineral & Metal Resources | 285.4 | 253.6 | -31.8 |
| Energy | 173.5 | 164.2 | -9.3 |
| Machinery & Infrastructure | 232.9 | 225.9 | -7.0 |
| Chemicals | 75.9 | 67.5 | -8.4 |
| Iron & Steel Products | 13.2 | 18.9 | +5.7 |
| Lifestyle | 53.7 | 52.0 | -1.7 |
| Innovation & Corporate Development | 87.3 | 59.0 | -28.3 |
| Others, Adjustment & Eliminations | -21.6 | -7.1 | +14.5 |
| Total (Profit attributable to owners of the parent, bn JPY) | 900.3 | 834.0 | -66.3 |
Balance Sheet / Financial Position
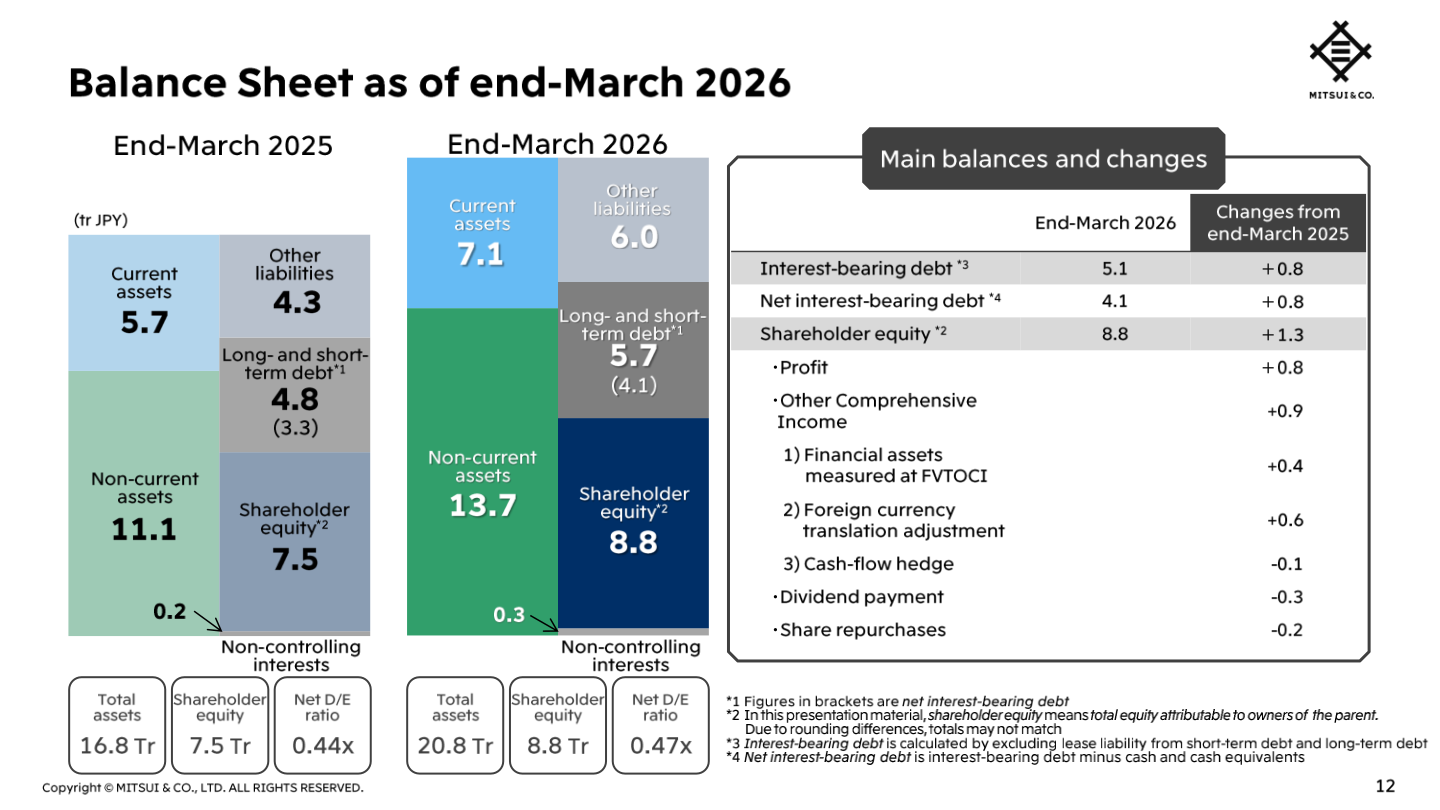
As of end-March 2026, total assets were 20.8 tr yen (end-March 2025: 16.8 tr yen) and shareholder equity was 8.8 tr yen (end-March 2025: 7.5 tr yen), with the net D/E ratio at 0.47x (end-March 2025: 0.44x). Shareholder equity increased 1.3 tr yen year-on-year, reflecting profit of +0.8 tr yen and other comprehensive income of +0.9 tr yen, partly offset by dividend payments of -0.3 tr yen and share repurchases of -0.2 tr yen.
| Item (bn JPY) | End-March 2026 | End-March 2025 |
|---|---|---|
| Interest-bearing debt | 5,122.9 | 4,309.9 |
| Net interest-bearing debt | 4,139.0 | 3,330.1 |
| Total equity attributable to owners of the parent | 8,767.7 | 7,546.6 |
| Net D/E ratio (times) | 0.47 | 0.44 |
| Adjusted net D/E ratio (times) | 0.44 | 0.40 |
FY March 2027 Business Plan
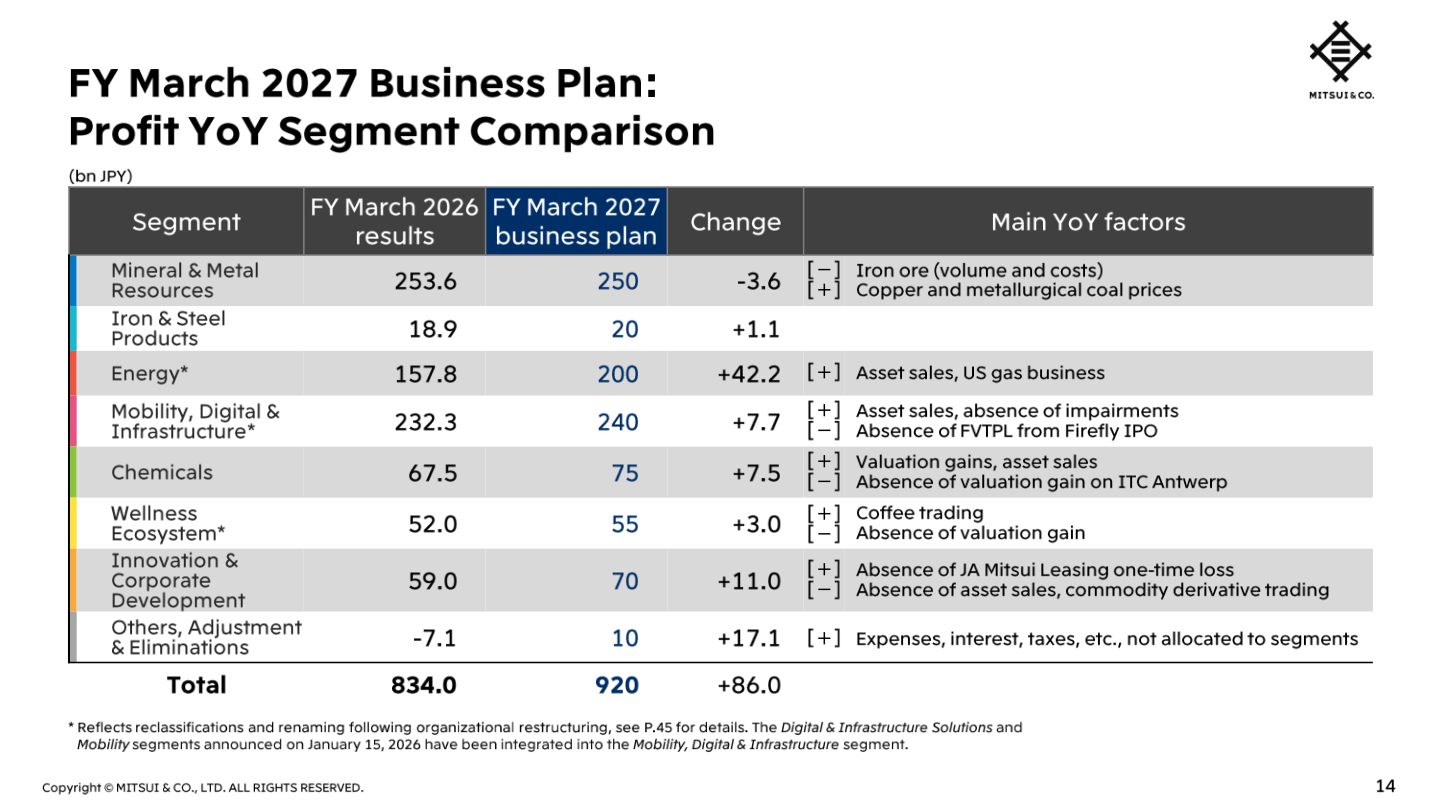
For FY March 2027, Mitsui’s business plan targets COCF of 1,050 bn yen (FY March 2026 results: 978.9 bn yen, +71.1 bn yen) and profit of 920 bn yen (FY March 2026 results: 834.0 bn yen, +86.0 bn yen). The plan reflects an organizational restructuring in which the Digital & Infrastructure Solutions and Mobility segments (announced January 15, 2026) have been integrated into a new Mobility, Digital & Infrastructure segment, and Lifestyle has been renamed Wellness Ecosystem; the FY March 2026 results shown in the plan tables below are restated on this new segment basis and therefore differ from the FY March 2026 actual segment results shown above, which use the prior segment structure. On this restated basis, Energy profit is planned at 200 bn yen (FY March 2026 restated: 157.8 bn yen, +42.2 bn yen), Mobility, Digital & Infrastructure at 240 bn yen (FY March 2026 restated: 232.3 bn yen, +7.7 bn yen), and Wellness Ecosystem at 55 bn yen (FY March 2026 restated: 52.0 bn yen, +3.0 bn yen).
| Segment | FY March 2026 (Results, restated basis) | FY March 2027 (Business Plan) | Change |
|---|---|---|---|
| Mineral & Metal Resources | 253.6 | 250 | -3.6 |
| Iron & Steel Products | 18.9 | 20 | +1.1 |
| Energy | 157.8 | 200 | +42.2 |
| Mobility, Digital & Infrastructure | 232.3 | 240 | +7.7 |
| Chemicals | 67.5 | 75 | +7.5 |
| Wellness Ecosystem | 52.0 | 55 | +3.0 |
| Innovation & Corporate Development | 59.0 | 70 | +11.0 |
| Others, Adjustment & Eliminations | -7.1 | 10 | +17.1 |
| Total (Profit, bn JPY) | 834.0 | 920 | +86.0 |
Shareholder Returns
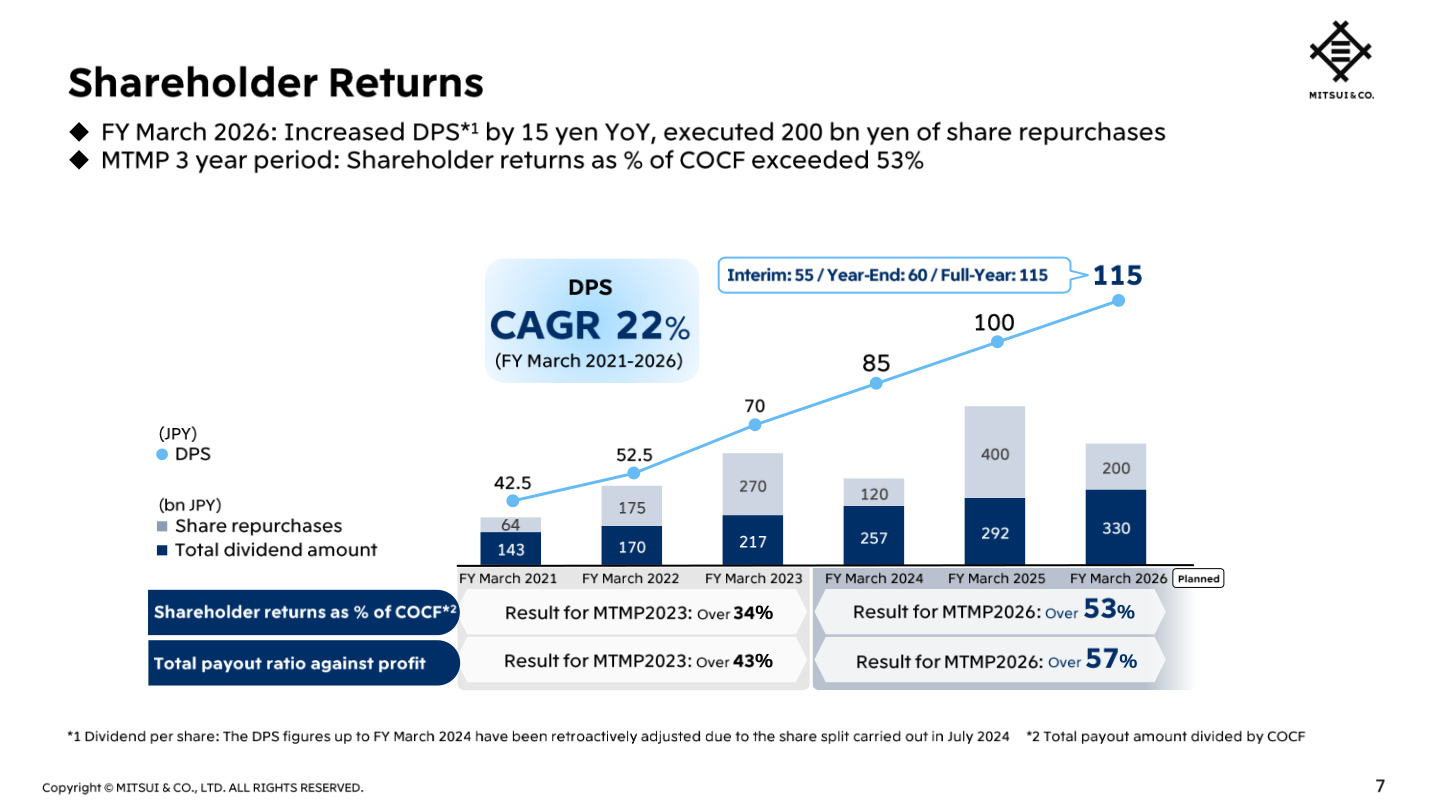
For FY March 2026, the full-year dividend per share was 115 yen (interim 55 yen, year-end 60 yen), up 15 yen year-on-year, matching the company’s forecast. Share repurchases of 200 bn yen were executed during the year, also matching the forecast. DPS CAGR was 22% for FY March 2021-2026. Over the three-year Medium-term Management Plan 2026 period (FY March 2024-2026), shareholder returns as a percentage of COCF exceeded 53%, and the total payout ratio against profit exceeded 57%.
Medium-Term Management Plan 2026 Results
Under the Medium-term Management Plan 2026 (FY March 2024-2026), cumulative three-year COCF was 3,002 bn yen against a forecast of 2,930 bn yen, and cumulative asset recycling cash inflows were 1,481 bn yen against a forecast of 1,500 bn yen, bringing total cash inflows to 4,483 bn yen (forecast: 4,430 bn yen). On the outflow side over the three years, sustaining CAPEX was 700 bn yen (forecast: 690 bn yen), investments for growth were 2,412 bn yen (forecast: 2,540 bn yen), share repurchases were 720 bn yen (forecast: 720 bn yen), and dividends were 879 bn yen (forecast: 880 bn yen). For FY March 2026 alone, investments for growth reached 1,127 bn yen, described in the materials as a historical high for a single fiscal year. New projects launched under the plan-spanning the Global Energy Transition, Wellness Ecosystem Creation, and Industrial Business Solutions key strategic initiatives-are stated to have lifted base profit by 54 bn yen in FY March 2026.
This article is an analysis based on publicly available information and is not a recommendation to buy or sell any specific securities. Investment decisions are your own responsibility.
![[Obayashi] Investors’ Guide 2026 — The Complete 24-Article Breakdown](https://japan-equity.com/wp-content/uploads/2026/07/hub_cover-1024x1024.png)
![[Obayashi] IR & SR Policy — Feeding Dialogue Back into Management](https://japan-equity.com/wp-content/uploads/2026/07/p32_sq-1024x1024.jpg)
![[Obayashi] Real Estate Development — 18.7% Margin, ¥287.7bn Unrealized Gains](https://japan-equity.com/wp-content/uploads/2026/07/p20_sq-1024x1024.jpg)
![[Obayashi] Domestic Civil Engineering — Resilience Spending Supports 9.6% Margin](https://japan-equity.com/wp-content/uploads/2026/07/p11_sq-1024x1024.jpg)
![[Obayashi] Share Price & External Ratings — vs TOPIX, ESG Index Inclusion](https://japan-equity.com/wp-content/uploads/2026/07/p40_sq-1024x1024.jpg)
![[Construction] ¥75.5tn Investment, Shrinking Workforce — Big-5 Market Share](https://japan-equity.com/wp-content/uploads/2026/07/p12_sq-1024x1024.jpg)



![[Obayashi] Capital Policy & Shareholder Returns — ROE 10%+, DOE ~5%, ¥100bn Buyback](https://japan-equity.com/wp-content/uploads/2026/07/p27_sq-1024x1024.jpg)
![[Obayashi] Reducing Cross-Shareholdings — ¥285.2bn Sold in Five Years](https://japan-equity.com/wp-content/uploads/2026/07/p29_sq-1024x1024.jpg)
![[Obayashi] ¥750bn Investment Plan — ¥300bn to Development, ¥190bn to Tech/DX](https://japan-equity.com/wp-content/uploads/2026/07/p30_sq-1024x1024.jpg)
![[Obayashi] MTP2022 KPIs — Operating Profit ~2x Target, ROE 14.4%](https://japan-equity.com/wp-content/uploads/2026/07/p25_sq-1024x1024.jpg)
![[Obayashi] Cash Allocation — ¥420bn Investment CF Over Five Years](https://japan-equity.com/wp-content/uploads/2026/07/p26_sq-1024x1024.jpg)
![[Obayashi] Green Energy — 44 Plants, 344MW, and the Green Hydrogen Challenge](https://japan-equity.com/wp-content/uploads/2026/07/p21_sq-1024x1024.jpg)
![[Obayashi] Tackling the Labor Shortage — Robotics Construction®](https://japan-equity.com/wp-content/uploads/2026/07/p14_sq-1024x1024.jpg)
