
This article is based on publicly available IR materials and is not a recommendation to buy or sell any specific securities.
Chori Co., Ltd. reported FY03/2026 (April 1, 2025 to March 31, 2026) net sales of ¥299.3 billion (-3.9% YoY) and operating profit of ¥13.1 billion (-9.9% YoY), the final year of its medium-term management plan, Chori Innovation Plan 2025 (CIP2025). Although net sales fell short of the plan, net profit attributable to owners of parent, ROE and other key indicators met their targets. Net profit attributable to owners of parent increased to ¥12.0 billion (+3.0% YoY), as a decrease in income tax expenses offset the decline in operating and ordinary profit. The company also disclosed its new medium-term management plan, Chori Innovation Plan 2028 (CIP2028), and raised the year-end dividend to ¥75 per share, lifting the annual dividend to ¥147 per share.
Consolidated Results (Full-Year Actual)
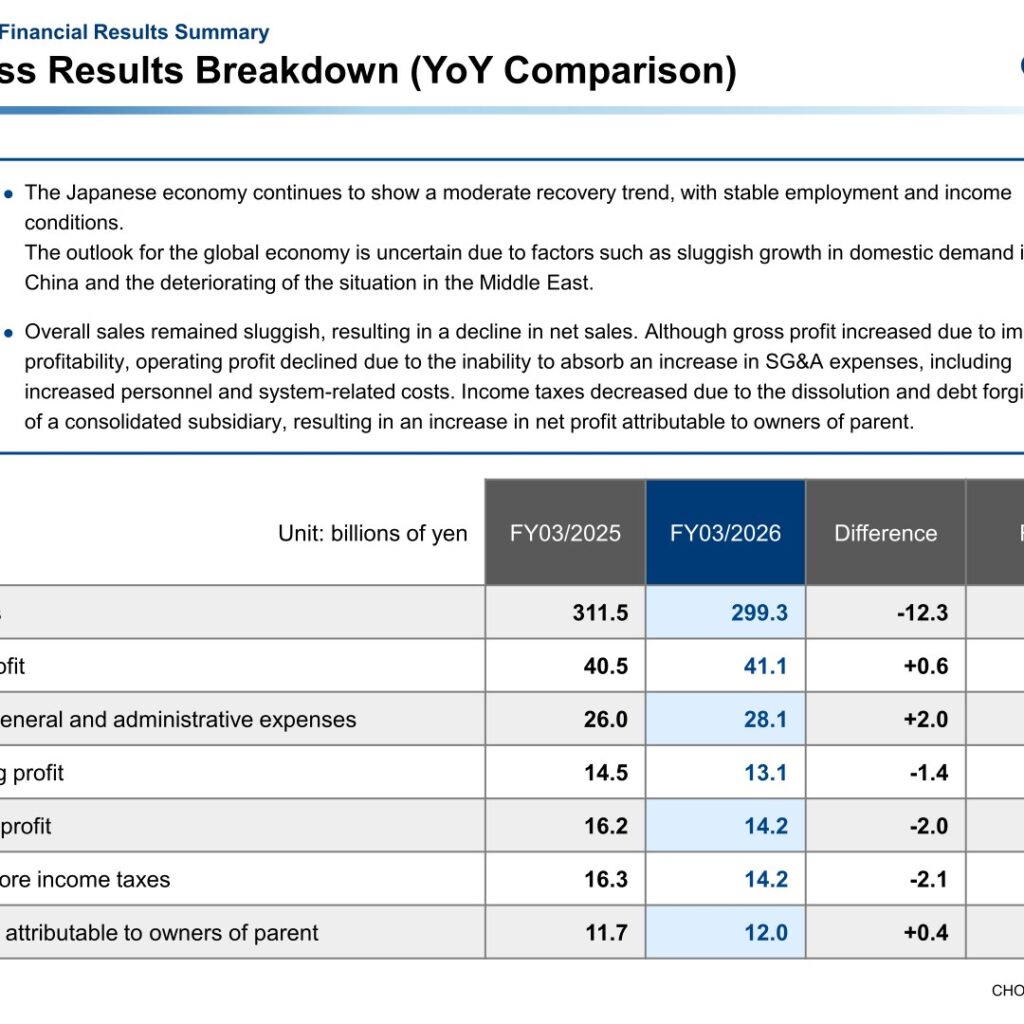
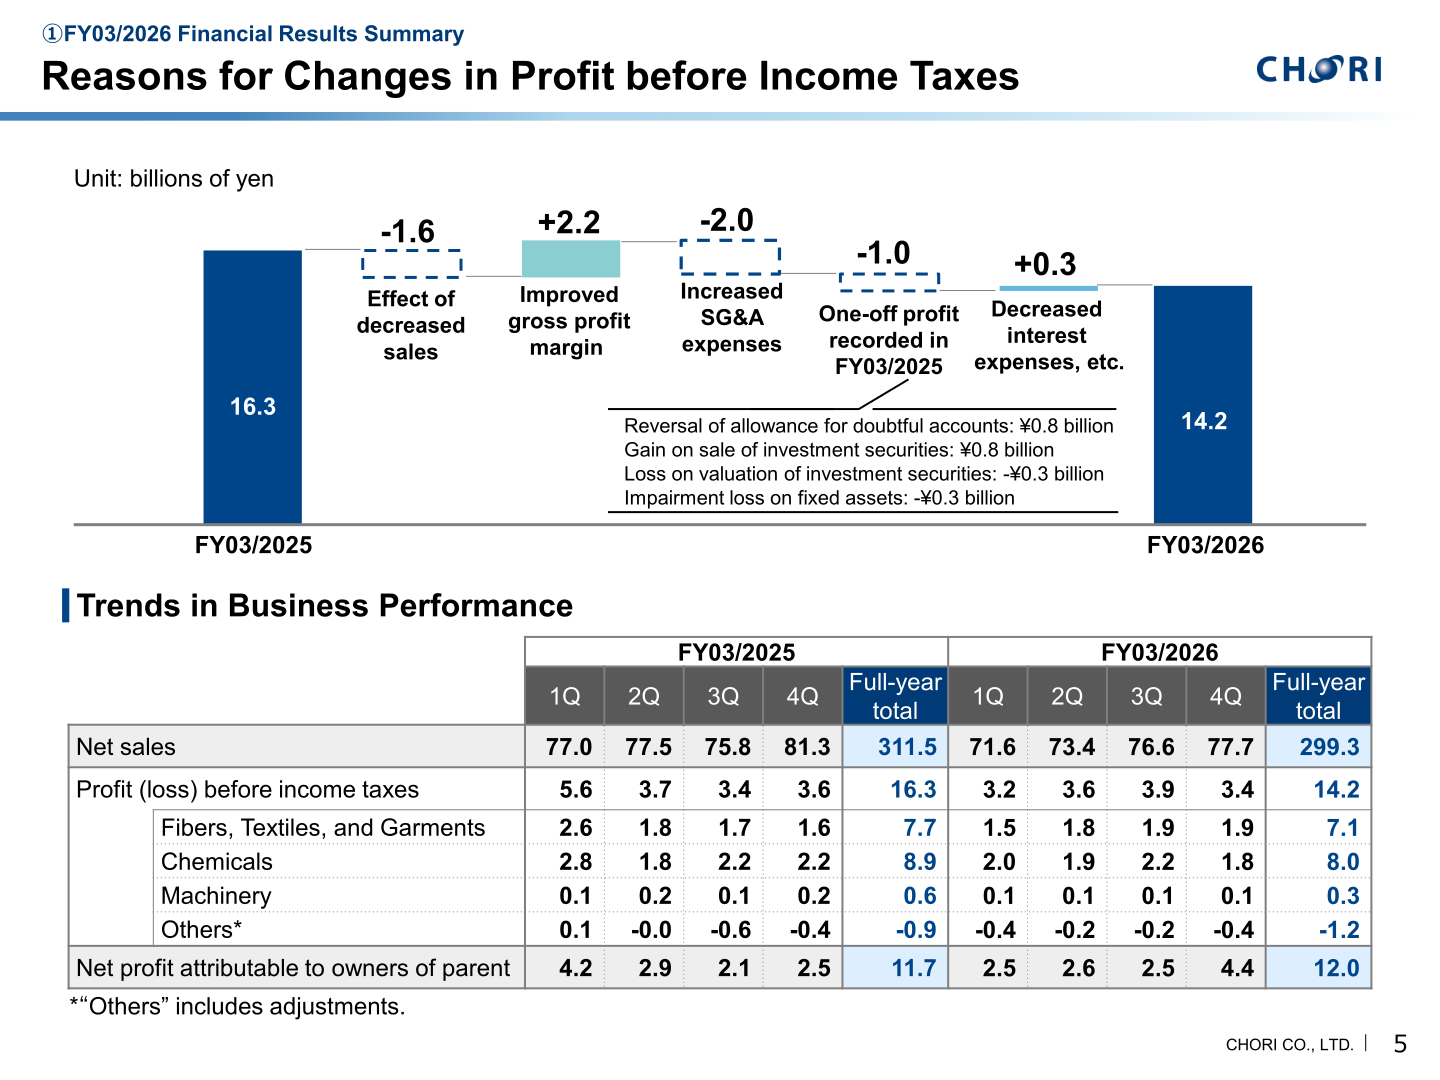
Overall sales remained sluggish, resulting in a decline in net sales. Although gross profit increased due to improved profitability, operating profit declined due to the inability to absorb an increase in SG&A expenses, including increased personnel and system-related costs. Income taxes decreased due to the dissolution and debt forgiveness of a consolidated subsidiary, resulting in an increase in net profit attributable to owners of parent. In the bridge from profit before income taxes of ¥16.3 billion in FY03/2025 to ¥14.2 billion in FY03/2026, the effect of decreased sales was -¥1.6 billion, improved gross profit margin was +¥2.2 billion, increased SG&A expenses was -¥2.0 billion, the absence of one-off profit recorded in FY03/2025 (reversal of allowance for doubtful accounts ¥0.8 billion and gain on sale of investment securities ¥0.8 billion, partly offset by loss on valuation of investment securities -¥0.3 billion and impairment loss on fixed assets -¥0.3 billion) was -¥1.0 billion, and decreased interest expenses, etc. was +¥0.3 billion.
| Item (Billions of yen) | FY03/2025 | FY03/2026 | Difference | Ratio |
|---|---|---|---|---|
| Net sales | 311.5 | 299.3 | -12.3 | -3.9% |
| Gross profit | 40.5 | 41.1 | +0.6 | +1.5% |
| Selling, general and administrative expenses | 26.0 | 28.1 | +2.0 | +7.9% |
| Operating profit | 14.5 | 13.1 | -1.4 | -9.9% |
| Ordinary profit | 16.2 | 14.2 | -2.0 | -12.4% |
| Profit before income taxes | 16.3 | 14.2 | -2.1 | -13.0% |
| Net profit attributable to owners of parent | 11.7 | 12.0 | +0.4 | +3.0% |
Segment Results
In the Fibers, Textiles, and Garments Business, net sales decreased mainly due to sluggish performance in the fibers, textiles, and industrial textiles fields; profit declined as a result of factors such as deteriorating geopolitical conditions and weak market demand in the Middle East within the textile field, as well as environmental and structural changes in the apparel field. Amid generally challenging conditions, career apparel and workwear remained solid. In the Chemicals Business, net sales decreased mainly due to sluggish market conditions in the performance chemicals field, and profit decreased as a result of the absence of the reversal of allowance for doubtful accounts due to partial collection of the receivables from a chemical manufacturing group in China in FY03/2025; the fine chemicals field performed steadily as market-wide inventory adjustments came to an end. In the Machinery Business, net sales and profit decreased mainly due to sluggish automotive sales for Europe, while automotive sales to Central and South America remained solid and the impact of U.S. tariff policies was limited.
| Segment (Billions of yen) | Net Sales FY03/2025 | Net Sales FY03/2026 | Profit before income taxes (Segment profit) FY03/2025 | Profit before income taxes (Segment profit) FY03/2026 |
|---|---|---|---|---|
| Fibers, Textiles, and Garments | 152.7 | 145.8 | 7.7 | 7.1 |
| Chemicals | 157.9 | 152.7 | 8.9 | 8.0 |
| Machinery | 0.9 | 0.8 | 0.6 | 0.3 |
Net Sales by Operation
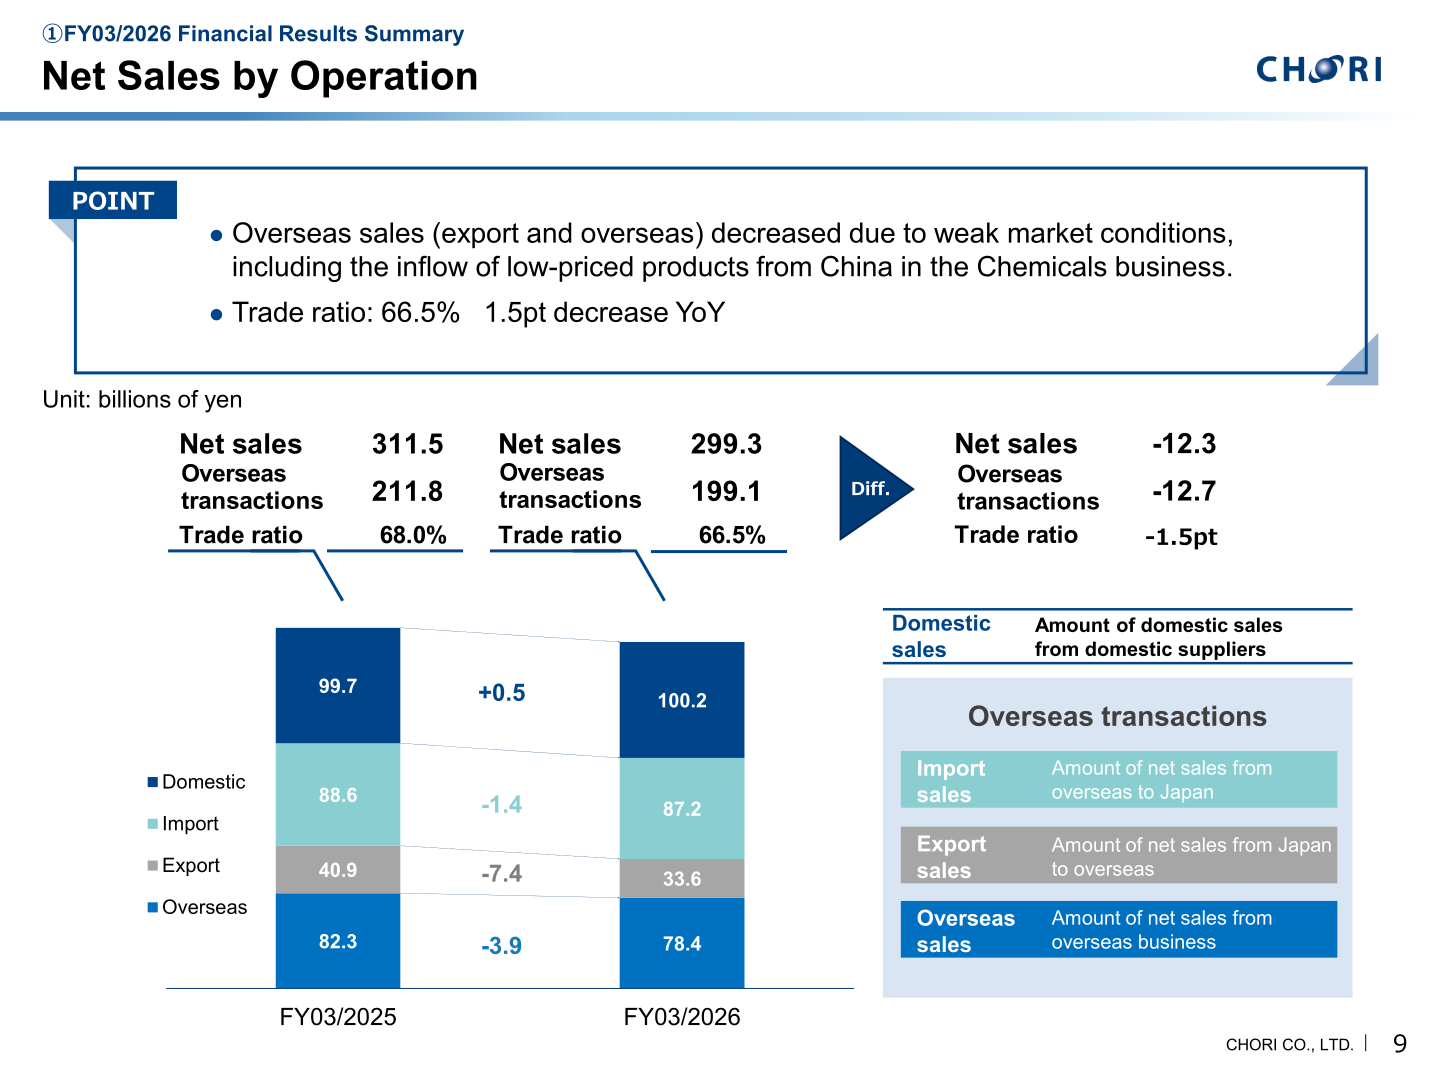
Overseas sales (export and overseas) decreased due to weak market conditions, including the inflow of low-priced products from China in the Chemicals business. The trade ratio (overseas transactions as a proportion of net sales) was 66.5%, a 1.5pt decrease YoY.
| Category (Billions of yen) | FY03/2025 | FY03/2026 | Difference |
|---|---|---|---|
| Domestic sales | 99.7 | 100.2 | +0.5 |
| Import sales | 88.6 | 87.2 | -1.4 |
| Export sales | 40.9 | 33.6 | -7.4 |
| Overseas sales | 82.3 | 78.4 | -3.9 |
| Overseas transactions (Import + Export + Overseas) | 211.8 | 199.1 | -12.7 |
| Trade ratio | 68.0% | 66.5% | -1.5pt |
Financial Position
Total assets and equity both increased, and the equity ratio improved. ROE declined slightly while ROIC was flat YoY.
| Item | 31-Mar-25 | 31-Mar-26 | Difference |
|---|---|---|---|
| Total assets (Billions of yen) | 146.1 | 153.4 | +7.3 |
| Equity (Billions of yen) | 92.0 | 102.3 | +10.3 |
| Equity ratio | 63.0% | 66.7% | +3.7pt |
| ROA | 8.1% | 8.0% | -0.1pt |
| ROE | 13.4% | 12.4% | -1.0pt |
| ROIC | 11.1% | 11.1% | +0.0pt |
| (Reference) ROA (Ordinary profit basis) | 11.2% | 9.5% | -1.7pt |
FY03/2027 Forecast
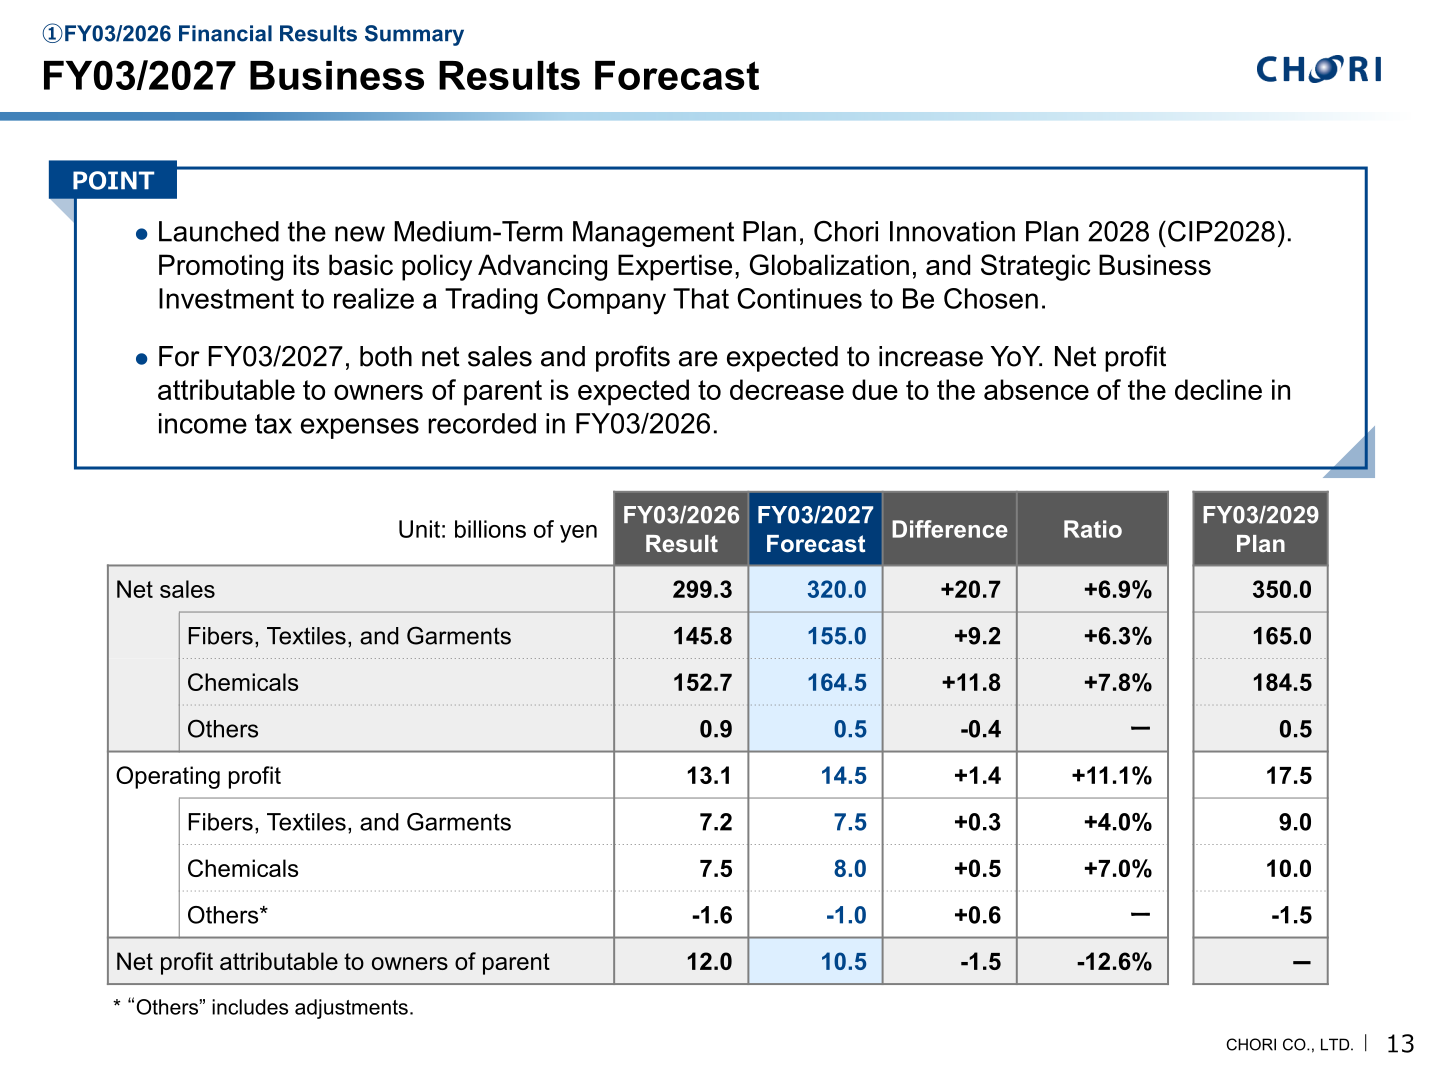
Chori launched its new Medium-Term Management Plan, Chori Innovation Plan 2028 (CIP2028), promoting its basic policy of Advancing Expertise, Globalization, and Strategic Business Investment to realize a “Trading Company That Continues to Be Chosen.” For FY03/2027, both net sales and profits are expected to increase YoY. Net profit attributable to owners of parent is expected to decrease due to the absence of the decline in income tax expenses recorded in FY03/2026.
| Item (Billions of yen) | FY03/2026 Result | FY03/2027 Forecast | Difference | Ratio | FY03/2029 Plan |
|---|---|---|---|---|---|
| Net sales | 299.3 | 320.0 | +20.7 | +6.9% | 350.0 |
| Fibers, Textiles, and Garments | 145.8 | 155.0 | +9.2 | +6.3% | 165.0 |
| Chemicals | 152.7 | 164.5 | +11.8 | +7.8% | 184.5 |
| Others | 0.9 | 0.5 | -0.4 | — | 0.5 |
| Operating profit | 13.1 | 14.5 | +1.4 | +11.1% | 17.5 |
| Fibers, Textiles, and Garments | 7.2 | 7.5 | +0.3 | +4.0% | 9.0 |
| Chemicals | 7.5 | 8.0 | +0.5 | +7.0% | 10.0 |
| Others | -1.6 | -1.0 | +0.6 | — | -1.5 |
| Net profit attributable to owners of parent | 12.0 | 10.5 | -1.5 | -12.6% | — |
Shareholder Returns
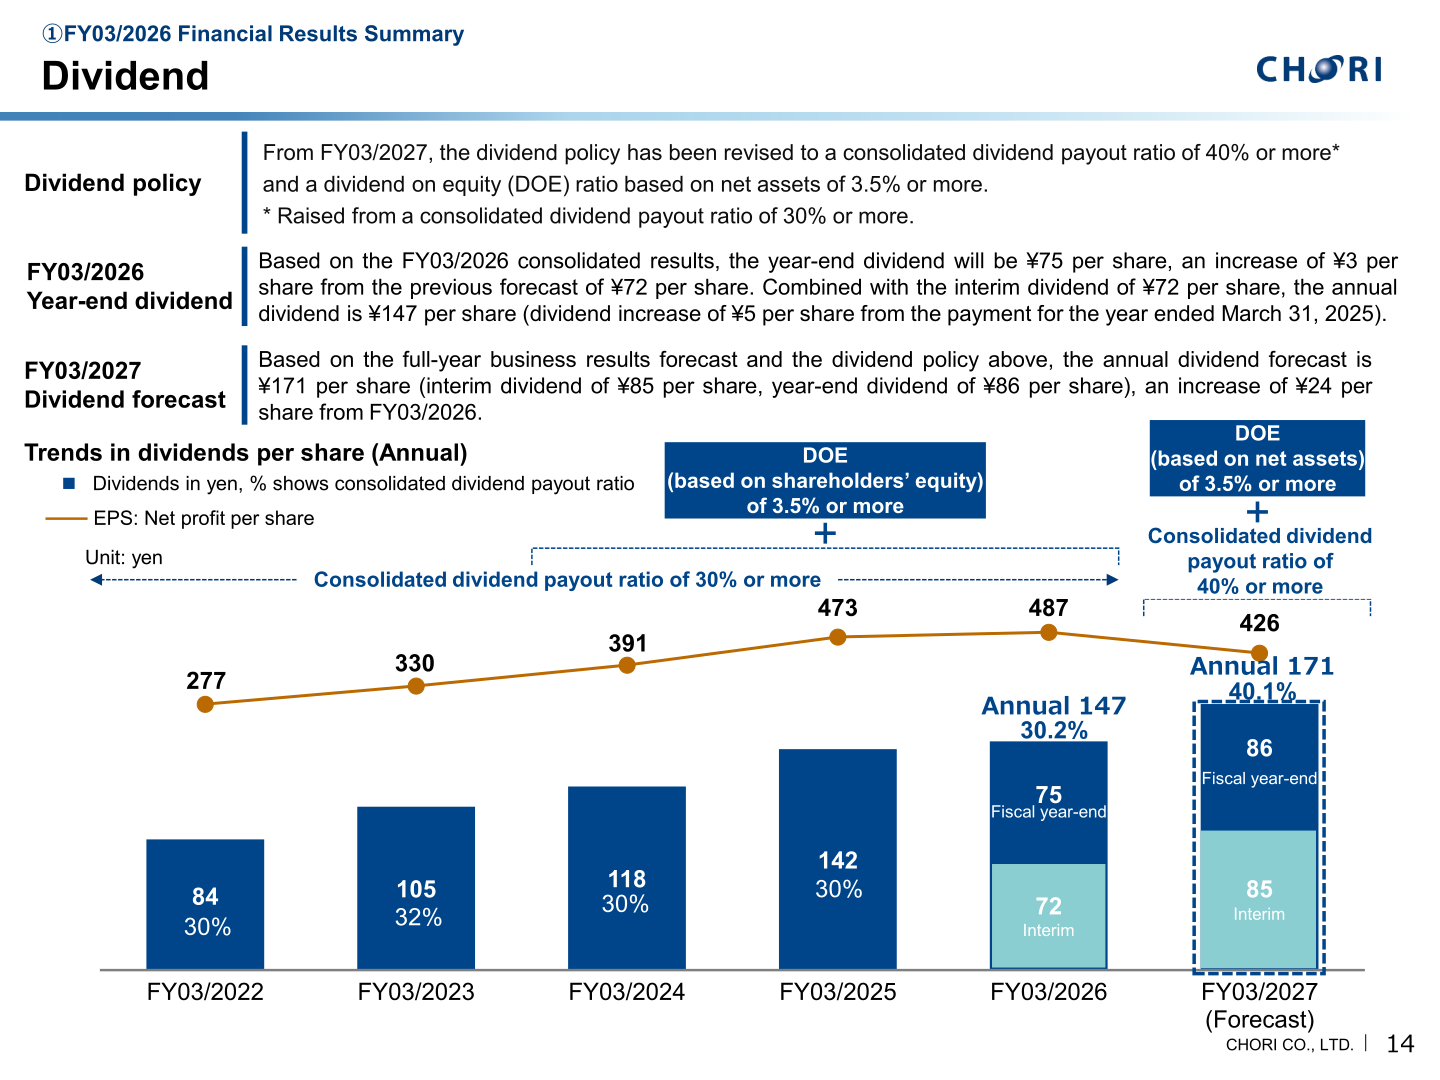
Based on the FY03/2026 consolidated results, the year-end dividend will be ¥75 per share, an increase of ¥3 per share from the previous forecast of ¥72 per share. Combined with the interim dividend of ¥72 per share, the annual dividend is ¥147 per share, a dividend increase of ¥5 per share from the payment for the year ended March 31, 2025. The consolidated dividend payout ratio was 30.2% and the dividend on shareholders’ equity (DOE) ratio was 4.1%. From FY03/2027, the dividend policy has been revised to a consolidated dividend payout ratio of 40% or more (raised from 30% or more) and a dividend on equity (DOE) ratio based on net assets of 3.5% or more. Based on the full-year business results forecast and the revised dividend policy, the FY03/2027 annual dividend forecast is ¥171 per share (interim dividend of ¥85 per share, year-end dividend of ¥86 per share), an increase of ¥24 per share from FY03/2026.
| Fiscal Year | Interim Dividend | Year-end Dividend | Annual Dividend | Payout Ratio |
|---|---|---|---|---|
| FY03/2026 | 72 | 75 | 147 | 30.2% |
| FY03/2027 (Forecast) | 85 | 86 | 171 | 40.1% |
This article is an analysis based on publicly available information and is not a recommendation to buy or sell any specific securities. Investment decisions are your own responsibility.
















