
This article is based on publicly available IR materials and is not a recommendation to buy or sell any specific securities.
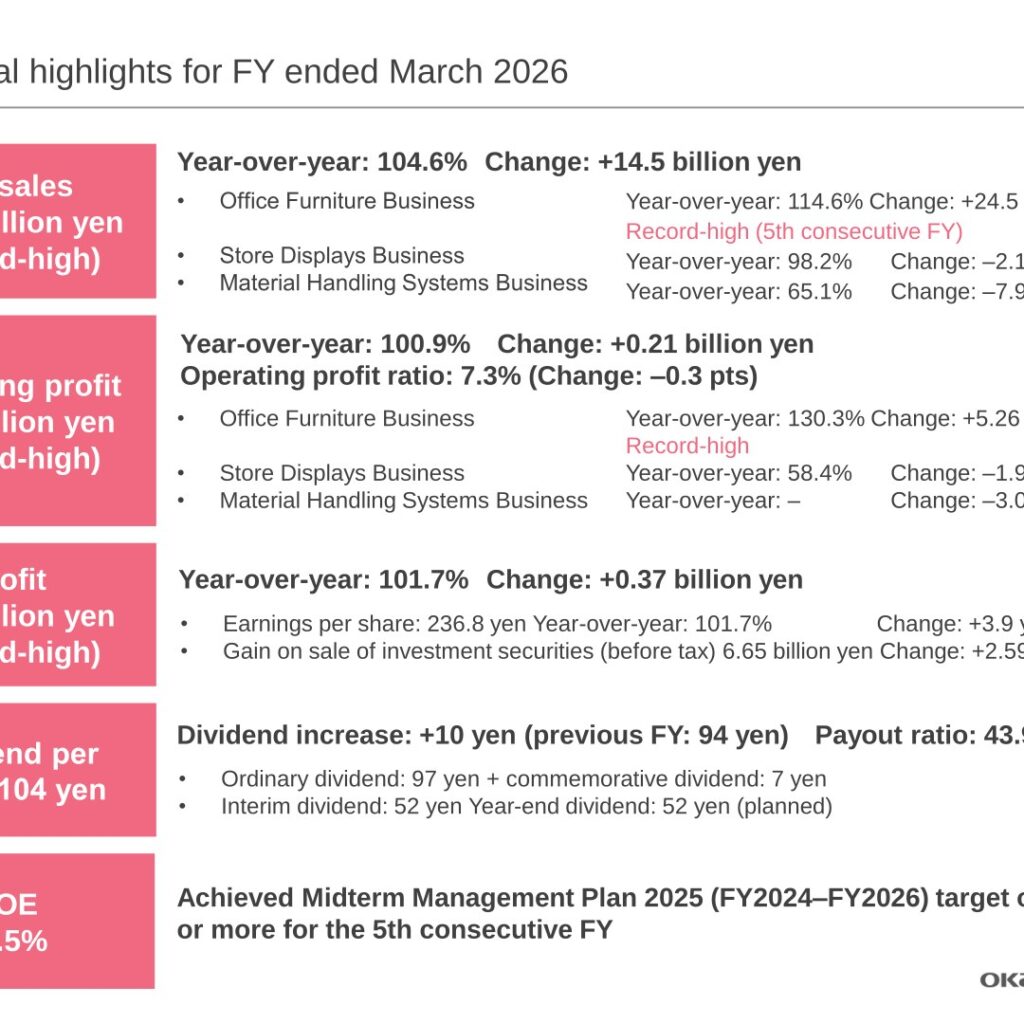
Okamura Corporation reported record-high consolidated net sales, operating profit and profit for the fiscal year ended March 31, 2026 (referred to as FY2025 in this article), driven by strong demand for office renovations and the consolidation of newly acquired overseas subsidiaries in the Office Furniture Business. Net sales rose to 104.6% of the previous year at 329.0 billion yen, operating profit rose to 100.9% at 24.1 billion yen, and profit attributable to owners of parent rose to 101.7% at 22.4 billion yen. Return on equity (ROE) came to 11.5%, marking the fifth consecutive fiscal year above the company’s 10% target under its Midterm Management Plan 2025.
Consolidated Results (Full-Year Actual)
Net sales, operating profit and profit all reached record highs. Ordinary profit declined 2.3% year-over-year to 25.8 billion yen. The equity ratio improved to 67.6% from 64.0% a year earlier, net assets per share rose to 2,156.14 yen, and basic earnings per share came to 236.80 yen.
| Item | FY ended March 2026 | FY ended March 2025 | Year-over-year |
|---|---|---|---|
| Net sales | 329.0 billion yen | 314.5 billion yen | 104.6% |
| Operating profit | 24.1 billion yen | 23.9 billion yen | 100.9% |
| Ordinary profit | 25.8 billion yen | 26.5 billion yen | 97.7% |
| Profit attributable to owners of parent | 22.4 billion yen | 22.0 billion yen | 101.7% |
Segment Results
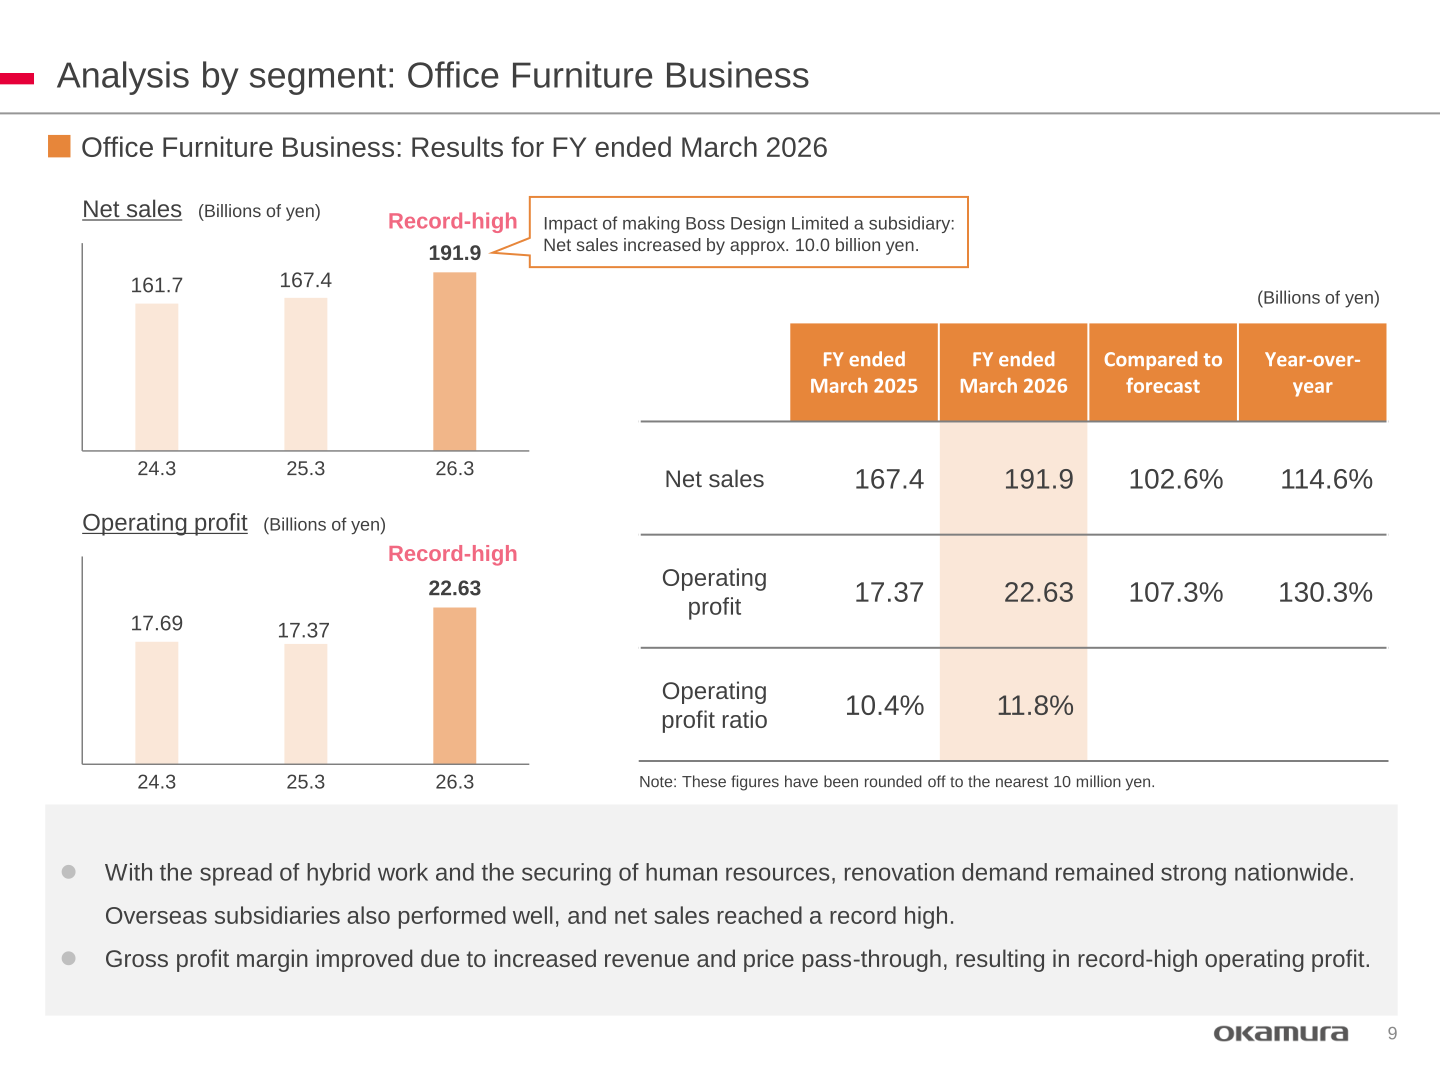
The Office Furniture Business drove overall growth, with net sales rising to 114.6% and operating profit rising to 130.3% of the previous year’s level, aided by strong domestic renovation demand and the addition of Boss Design Limited (U.K.), which became a wholly owned subsidiary on April 1, 2025 and added approximately 10.0 billion yen in net sales. The Store Displays Business saw net sales fall to 98.2% and operating profit fall to 58.4% of the previous year’s level after the cancellation of large-scale projects and higher personnel and relocation expenses. The Material Handling Systems Business saw net sales fall to 65.1% of the previous year’s level and swung to an operating loss of 1.47 billion yen, as large-scale projects were postponed amid rising construction material costs.
| Segment | Metric | FY ended March 2026 | FY ended March 2025 |
|---|---|---|---|
| Office Furniture Business | Net sales | 191.9 billion yen | 167.4 billion yen |
| Office Furniture Business | Operating profit | 22.63 billion yen | 17.37 billion yen |
| Office Furniture Business | Operating profit ratio | 11.8% | 10.4% |
| Store Displays Business | Net sales | 116.1 billion yen | 118.3 billion yen |
| Store Displays Business | Operating profit | 2.80 billion yen | 4.79 billion yen |
| Store Displays Business | Operating profit ratio | 2.4% | 4.1% |
| Material Handling Systems Business | Net sales | 14.7 billion yen | 22.6 billion yen |
| Material Handling Systems Business | Operating profit | -1.47 billion yen | 1.62 billion yen |
| Material Handling Systems Business | Operating profit ratio | Not meaningful (operating loss) | 7.2% |
FY2026 Forecast
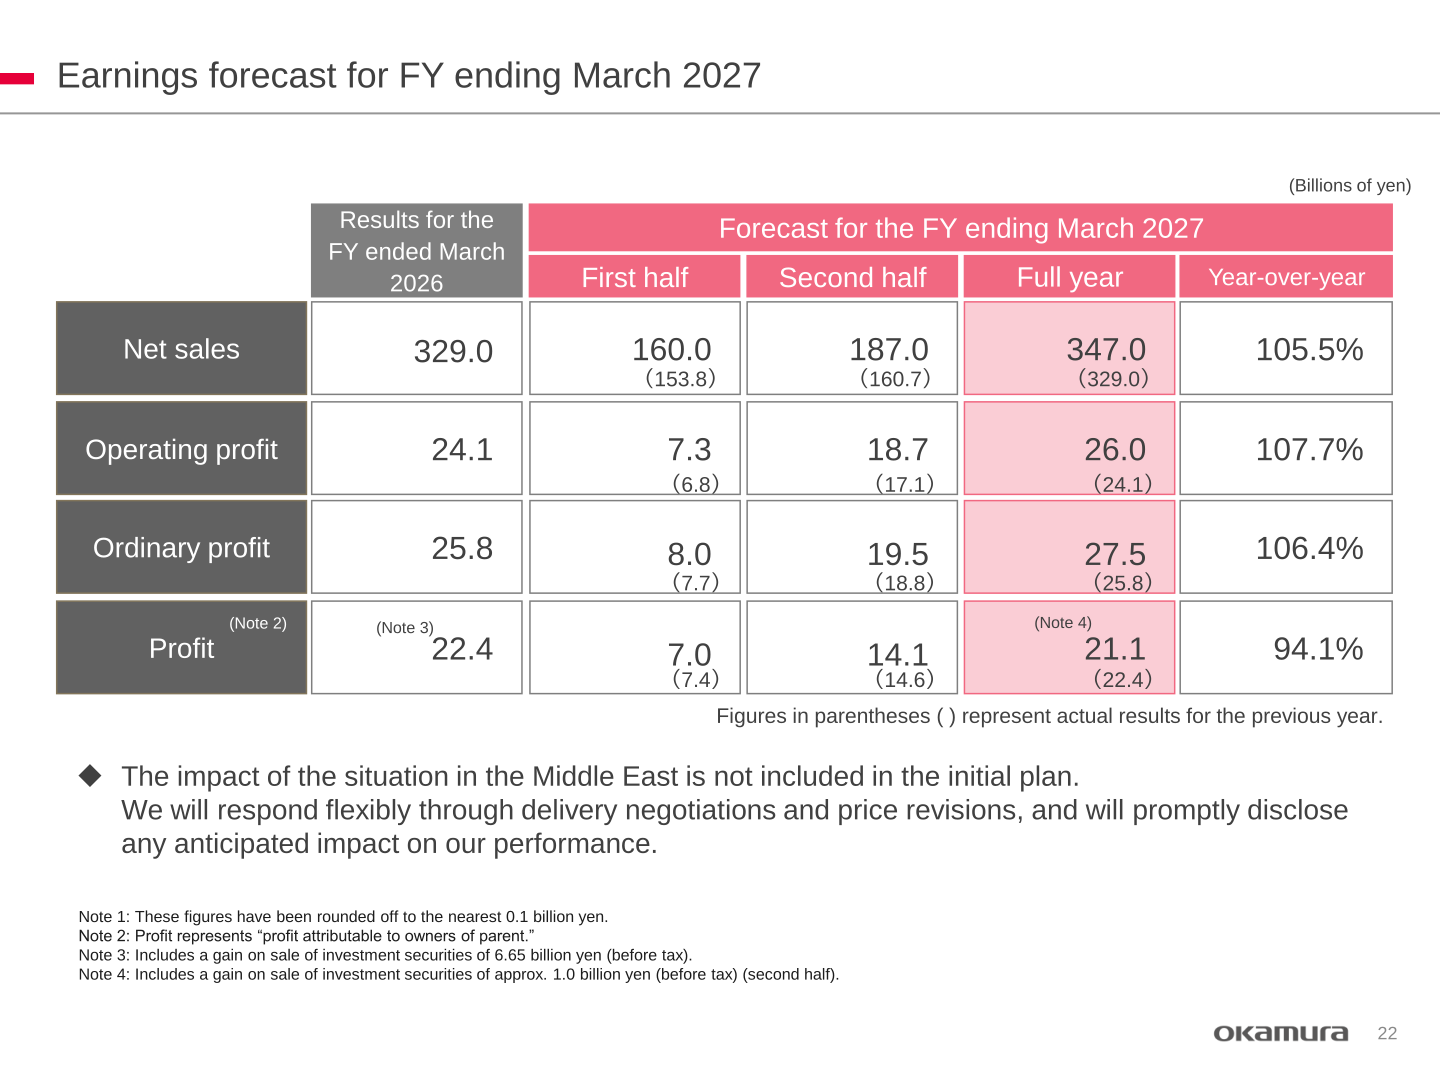
For the fiscal year ending March 31, 2027 (referred to as FY2026 in this article), Okamura forecasts net sales of 347.0 billion yen, rising to 105.5% of FY ended March 2026’s level, operating profit of 26.0 billion yen (107.7%) and ordinary profit of 27.5 billion yen (106.4%), while profit is expected to fall to 94.1% at 21.1 billion yen. By segment, the Office Furniture Business is expected to keep growing on continued strong demand, the Store Displays Business aims to improve its gross profit margin, and the Material Handling Systems Business aims to return to profitability. The forecast does not include any impact from the situation in the Middle East.
| Item | Forecast (FY ending March 2027) | FY ended March 2026 (Actual) | Year-over-year |
|---|---|---|---|
| Net sales | 347.0 billion yen | 329.0 billion yen | 105.5% |
| Operating profit | 26.0 billion yen | 24.1 billion yen | 107.7% |
| Ordinary profit | 27.5 billion yen | 25.8 billion yen | 106.4% |
| Profit attributable to owners of parent | 21.1 billion yen | 22.4 billion yen | 94.1% |
| Segment | Net sales forecast | Operating profit forecast |
|---|---|---|
| Office Furniture Business | 207.0 billion yen (+15.1) | 24.5 billion yen (+1.9) |
| Store Displays Business | 120.0 billion yen (+3.8) | 3.5 billion yen (+0.7) |
| Material Handling Systems Business | 14.0 billion yen (-0.7) | 0.0 billion yen (+1.5) |
| Powertrain / Others | 6.0 billion yen (+0.1) | 0.2 billion yen (+0.0) |
| Adjustments | – | -2.2 billion yen |
| Total | 347.0 billion yen (+18.0) | 26.0 billion yen (+1.9) |
Shareholder Returns
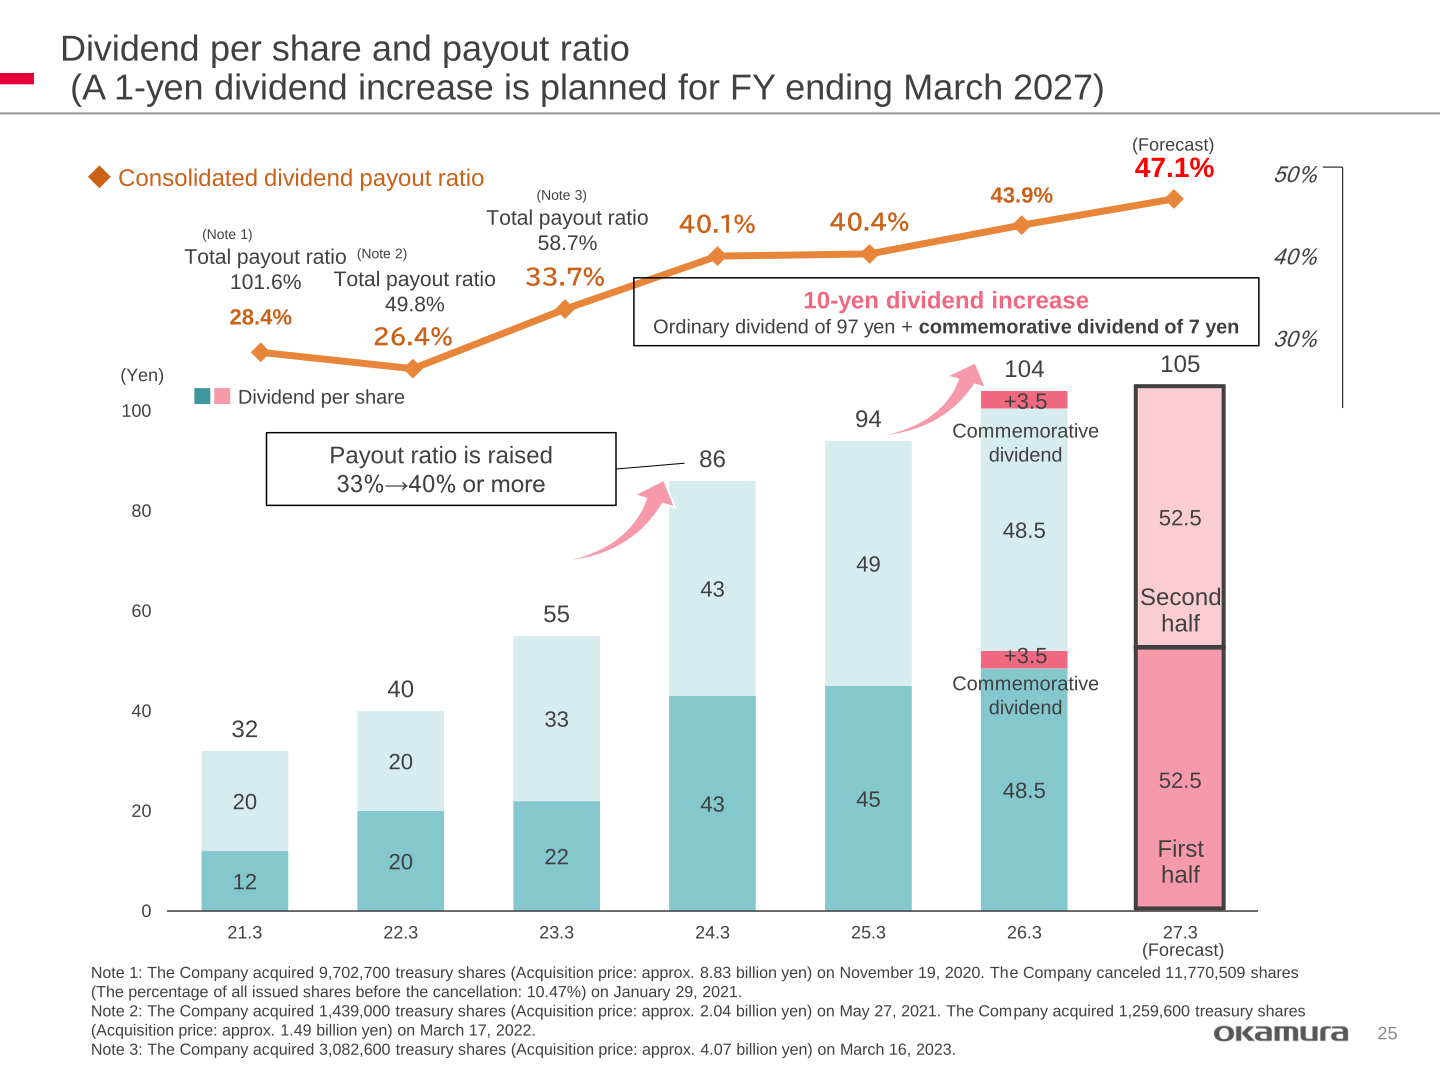
For FY ended March 2026, Okamura paid a dividend per share of 104 yen (interim 52 yen, year-end 52 yen), up 10 yen year-over-year, comprising an ordinary dividend of 97 yen plus a commemorative dividend of 7 yen. The consolidated dividend payout ratio was 43.9%. For the fiscal year ending March 2027, the company forecasts a further 1-yen increase to a dividend per share of 105 yen, with a payout ratio of 47.1%. Under its capital allocation policy, Okamura maintains a shareholder return ratio of 40% or more of after-tax profit (raised from one-third under the previous Midterm Management Plan), with share repurchases to be conducted flexibly based on the status of investments and the external environment.
Medium-Term Plan / Topics
Under the Midterm Management Plan 2025 (FY2023-FY2025), Okamura achieved ROE of 10% or more for five consecutive fiscal years, with FY2025 (ended March 2026) results of net sales of 329.0 billion yen, an operating profit ratio of 7.3%, operating profit of 24.1 billion yen and ROE of 11.5%, roughly in line with the plan’s revised (November 2025) targets. The company also continued to reduce its cross-shareholdings, which fell to 28 listed companies (14.8% of net assets) at the end of FY ended March 2026. Okamura plans to announce its new Midterm Management Plan 2028 as a timely disclosure on May 29, 2026, with a hybrid-format briefing for institutional investors scheduled for June 1, 2026.
This article is an analysis based on publicly available information and is not a recommendation to buy or sell any specific securities. Investment decisions are your own responsibility.
















