
This article is based on publicly available IR materials and is not a recommendation to buy or sell any specific securities.
Note: FP Corporation’s own results materials label the fiscal year ended March 31, 2026 as “FY2026” (for example, the presentation title “Financial Results for the Fiscal Year Ended March 2026” and the “Financial Strategy: Achievements (FY2026)” slide); this article follows japan-equity.com’s convention of designating the most recently completed fiscal year as “FY2025.” To avoid confusion, the fiscal-year labels used in the text and tables below follow the source presentation’s own dating (i.e., “FY ended March 2026” refers to the results covered in this article, and “FY ended March 2025” to the prior year).
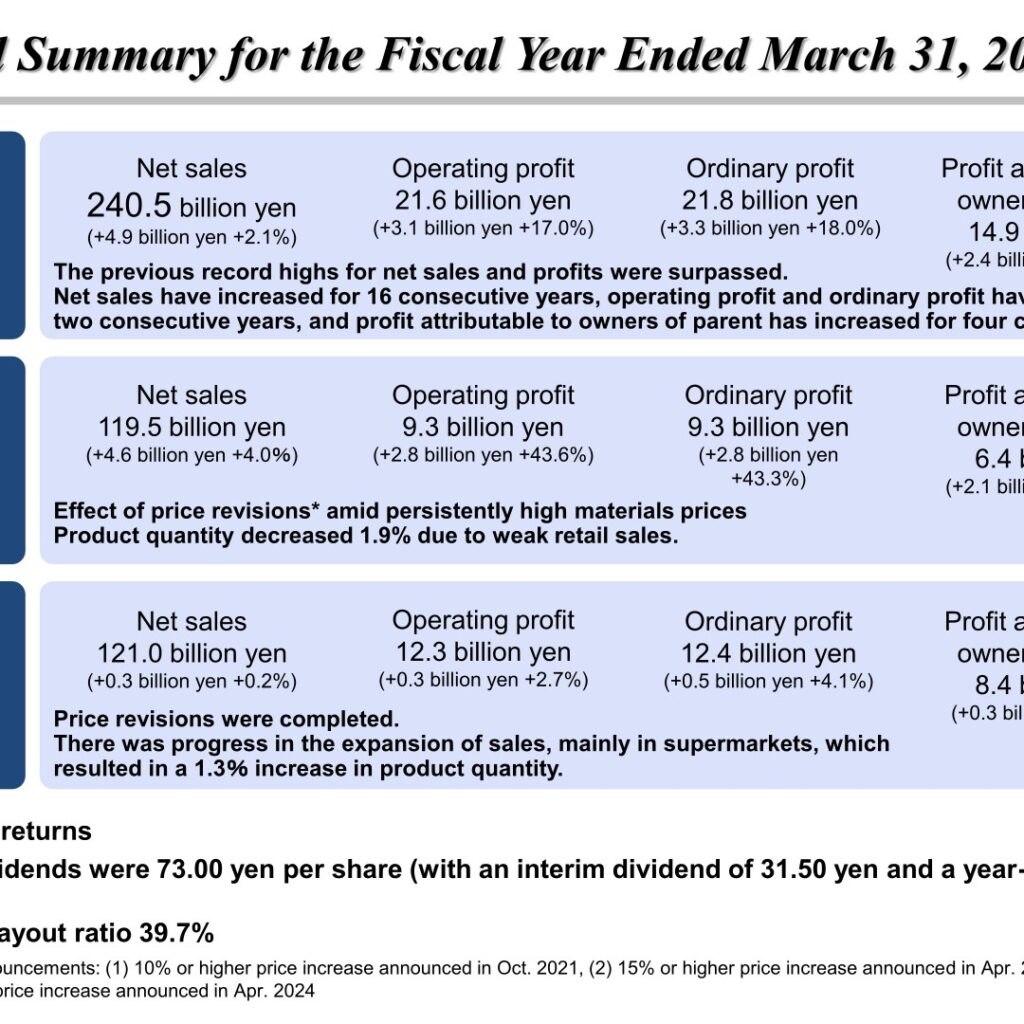
FP Corporation (TSE Prime, securities code 7947), a manufacturer of food trays and lunch-box containers, reported consolidated net sales of 240,490 million yen for the fiscal year ended March 31, 2026, up 102.1% year on year and a new record high, marking the 16th consecutive year of net sales growth. Operating profit rose to 21,614 million yen (117.0% year on year) and ordinary profit to 21,768 million yen (118.0%), both record highs and a second consecutive year of growth, while profit attributable to owners of parent increased to 14,869 million yen (119.1%), a fourth consecutive year of growth. The company raised its annual dividend to 73.00 yen per share, comprising an interim dividend of 31.50 yen and a year-end dividend of 41.50 yen, for a dividend payout ratio of 39.7%.
Consolidated Results (Full-Year Actual)
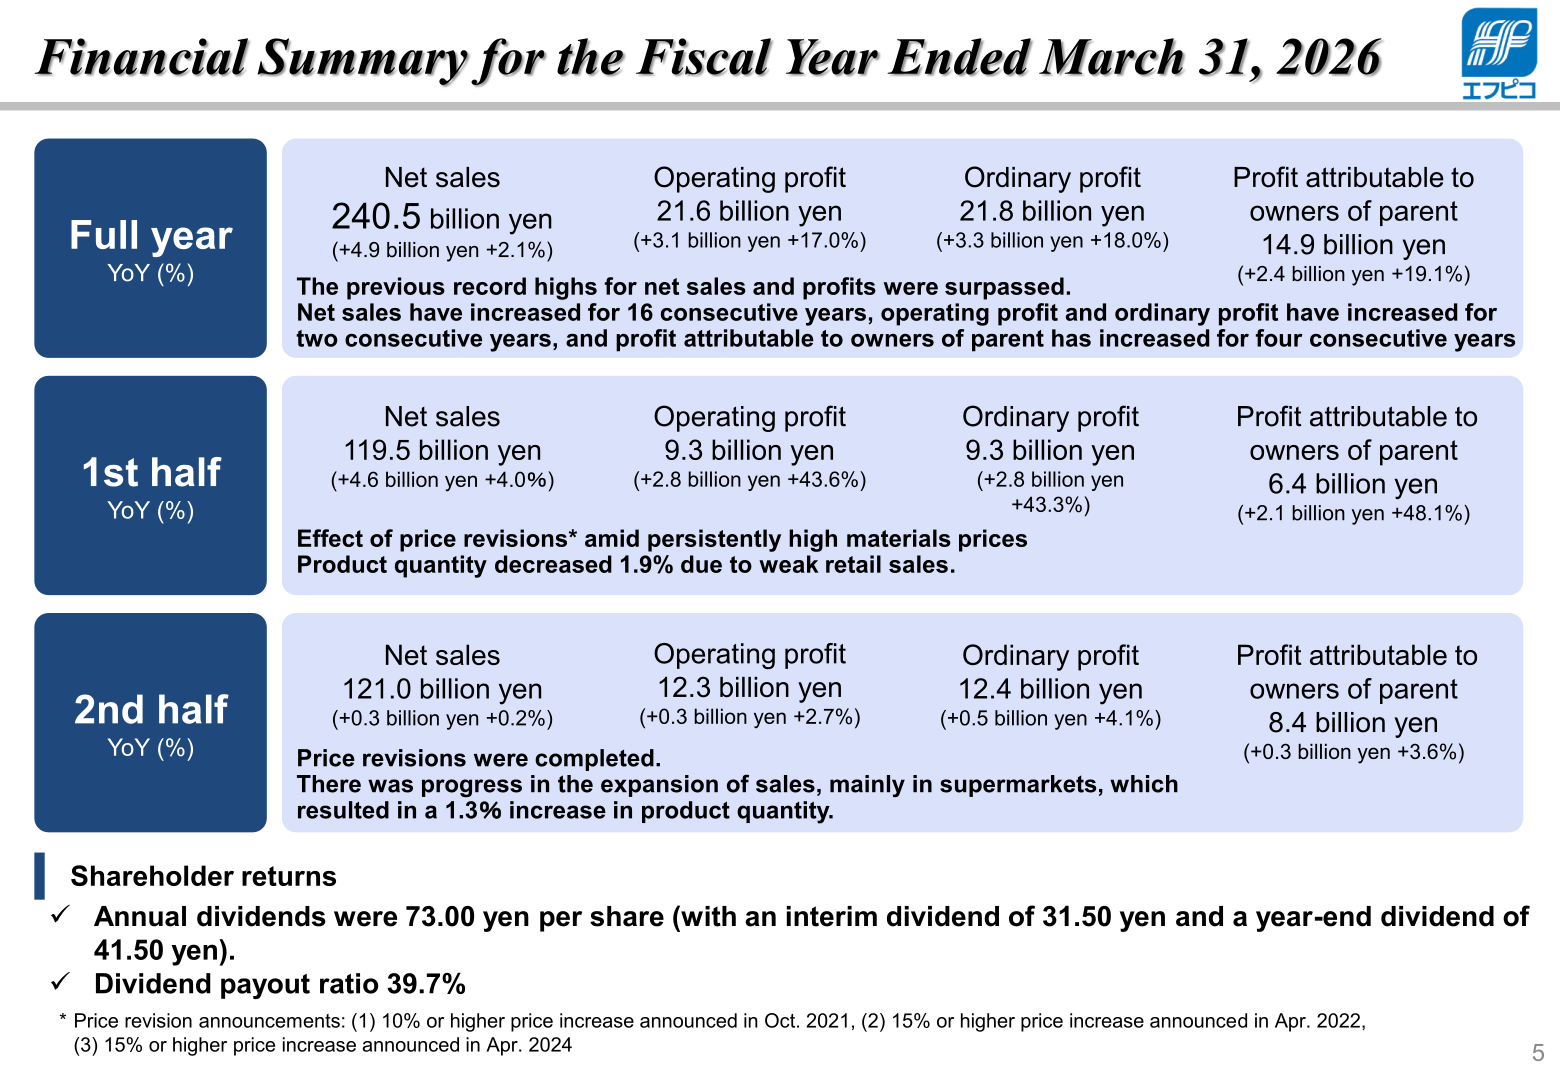
Results reflected the effect of price revisions amid persistently high raw material prices, alongside a recovery in sales volumes led by eco-friendly and other high-value-added products; product quantity for the full year was 99.7% of the prior year, though it turned positive in the third and fourth quarters (101.2% and 101.5%, respectively). By half, net sales were 119.5 billion yen in the first half (+4.6 billion yen, +4.0%) and 121.0 billion yen in the second half (+0.3 billion yen, +0.2%), with the effect of price revisions concentrated in the first half and an expansion of sales in supermarkets driving the second half.
| Item (¥M) | FY ended March 2025 (Actual) | FY ended March 2026 (Actual) | Increase/Decrease | YoY (Index) |
|---|---|---|---|---|
| Net sales | 235,628 | 240,490 | +4,861 | 102.1% |
| Operating profit | 18,471 | 21,614 | +3,143 | 117.0% |
| Ordinary profit | 18,451 | 21,768 | +3,316 | 118.0% |
| Profit attributable to owners of parent | 12,486 | 14,869 | +2,382 | 119.1% |
| Ordinary profit before depreciation | 33,203 | 36,362 | +3,159 | 109.5% |
Sales by Product Category
By product category, sales of products (trays, lunchboxes and prepared food containers, and other products) rose to 184,503 million yen (102.1% year on year), and sales of goods (packaging materials and other goods) rose to 55,986 million yen (102.1%). Within sales of products, lunchboxes and prepared food containers grew to 134,161 million yen (101.0%) on progress in supermarket sales, while trays grew to 47,042 million yen (105.7%). The ordinary profit ratio to net sales rose to 9.1% from 7.8%, and ROE improved to 9.4% from 8.4%.
| Item (¥M) | FY ended March 2025 (Actual) | FY ended March 2026 (Actual) | Increase/Decrease | YoY (Index) |
|---|---|---|---|---|
| Trays | 44,497 | 47,042 | +2,545 | 105.7% |
| Lunchboxes and prepared food containers | 132,817 | 134,161 | +1,344 | 101.0% |
| Subtotal | 177,314 | 181,204 | +3,889 | 102.2% |
| Other products | 3,455 | 3,298 | -156 | 95.5% |
| Sales of products (Total) | 180,770 | 184,503 | +3,733 | 102.1% |
| Packaging materials | 52,802 | 53,796 | +993 | 101.9% |
| Other goods | 2,055 | 2,190 | +134 | 106.5% |
| Sales of goods (Total) | 54,858 | 55,986 | +1,128 | 102.1% |
| Net Sales (Consolidated) | 235,628 | 240,490 | +4,861 | 102.1% |
Balance Sheet and Cash Flow
Total assets increased to 304,062 million yen as of March 31, 2026 (104.1% year on year) from 292,226 million yen a year earlier, mainly reflecting cash and deposits (+6,458 million yen) and construction in progress including new OPP manufacturing equipment (+5,923 million yen, of which +5,196 million yen related to the new OPP equipment). Net assets rose to 165,171 million yen (107.2%), including a 9,088 million yen increase in retained earnings, and the equity ratio improved to 54.1% from 52.5%, which the company describes as a very sound financial standing supported by its A rating. Cash flow from operating activities was 29,981 million yen (up from 27,919 million yen in the prior year), cash flow from investing activities was -16,594 million yen (including -4,496 million yen for new OPP sheet manufacturing equipment), and free cash flow was 13,386 million yen (up from 12,990 million yen). Cash flow from financing activities was -6,928 million yen, including dividends paid of 5,778 million yen, and cash and cash equivalents at the end of the period rose to 25,478 million yen from 19,020 million yen.
| Item (¥M) | Mar. 31, 2025 | Mar. 31, 2026 | Increase/Decrease | YoY (Index) |
|---|---|---|---|---|
| Current assets | 98,847 | 105,439 | +6,591 | 106.7% |
| Noncurrent assets | 193,378 | 198,622 | +5,244 | 102.7% |
| Total assets | 292,226 | 304,062 | +11,836 | 104.1% |
| Current liabilities | 84,372 | 86,218 | +1,846 | 102.2% |
| Noncurrent liabilities | 53,739 | 52,672 | -1,066 | 98.0% |
| Total liabilities | 138,111 | 138,891 | +779 | 100.6% |
| Net assets | 154,114 | 165,171 | +11,056 | 107.2% |
| Equity ratio | 52.5% | 54.1% | – | – |
FY2027 Forecast
FP Corporation has not disclosed quantitative net sales or profit forecasts for the fiscal year ending March 31, 2027, citing an uncertain environment for procuring raw materials amid growing tensions in the Middle East; prices for the company’s main materials, PS, PET and PP, have risen by around 100 yen/kg from April 2026. The company says it expects to be able to continue stable product supply until the end of June and will announce financial forecasts once the outlook for a stable supply of raw materials becomes clearer. This cannot be confirmed from the materials. To pass on the higher raw material costs, the company announced price revisions on April 30, 2026, raising prices by 20% or more for shipments from June 1, 2026.
| Item | FY ended March 2026 (Actual) | FY ending March 2027 (Forecast) |
|---|---|---|
| Dividend per share (yen) | 73.00 | 73.00 |
Shareholder Returns
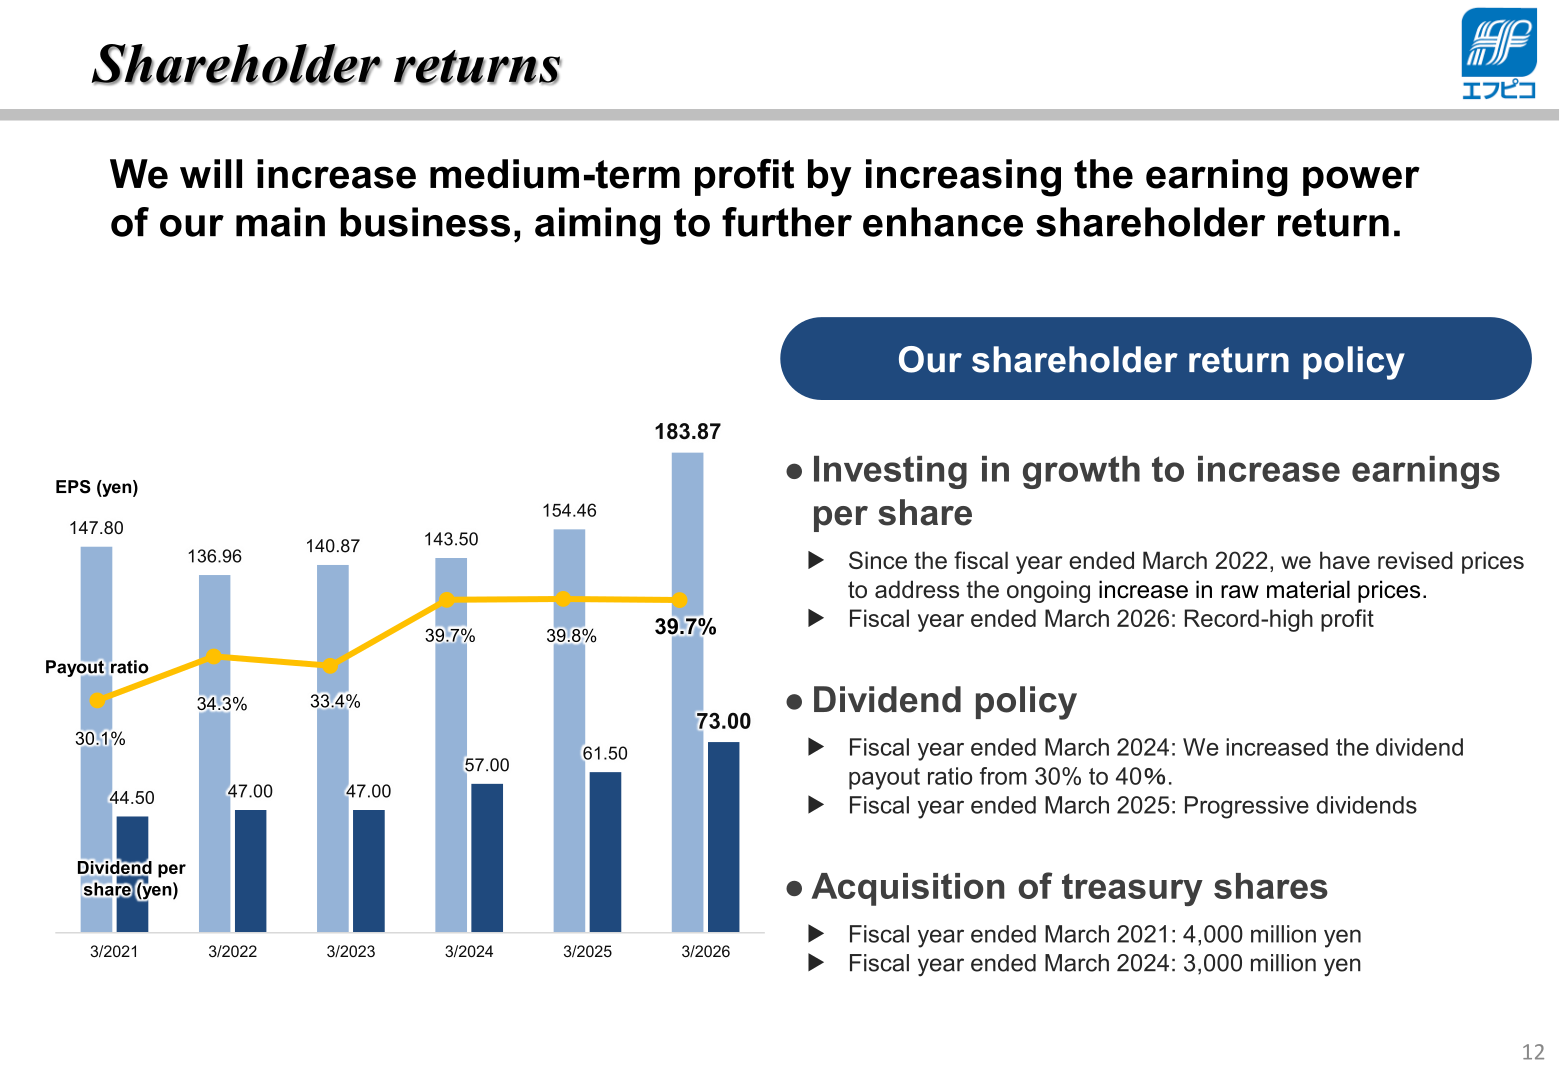
FP Corporation paid an annual dividend of 73.00 yen per share for the fiscal year ended March 31, 2026 (interim 31.50 yen, year-end 41.50 yen), up from 61.50 yen the prior year, for a dividend payout ratio of 39.7% against a target of 40%. The company raised its payout ratio target from 30% to 40% for the fiscal year ended March 2024 and has paid progressive dividends since the fiscal year ended March 2025. The company did not repurchase treasury shares in the fiscal year ended March 2026; its most recent repurchases were 4,000 million yen in the fiscal year ended March 2021 and 3,000 million yen in the fiscal year ended March 2024. For the fiscal year ending March 31, 2027, the company plans to maintain the dividend at 73.00 yen per share based on its progressive dividend policy.
| Fiscal Year | Dividend per Share (yen) | Payout Ratio |
|---|---|---|
| FY ended March 2021 | 44.50 | 30.1% |
| FY ended March 2022 | 47.00 | 34.3% |
| FY ended March 2023 | 47.00 | 33.4% |
| FY ended March 2024 | 57.00 | 39.7% |
| FY ended March 2025 | 61.50 | 39.8% |
| FY ended March 2026 | 73.00 | 39.7% |
Medium-Term Plan and Topics
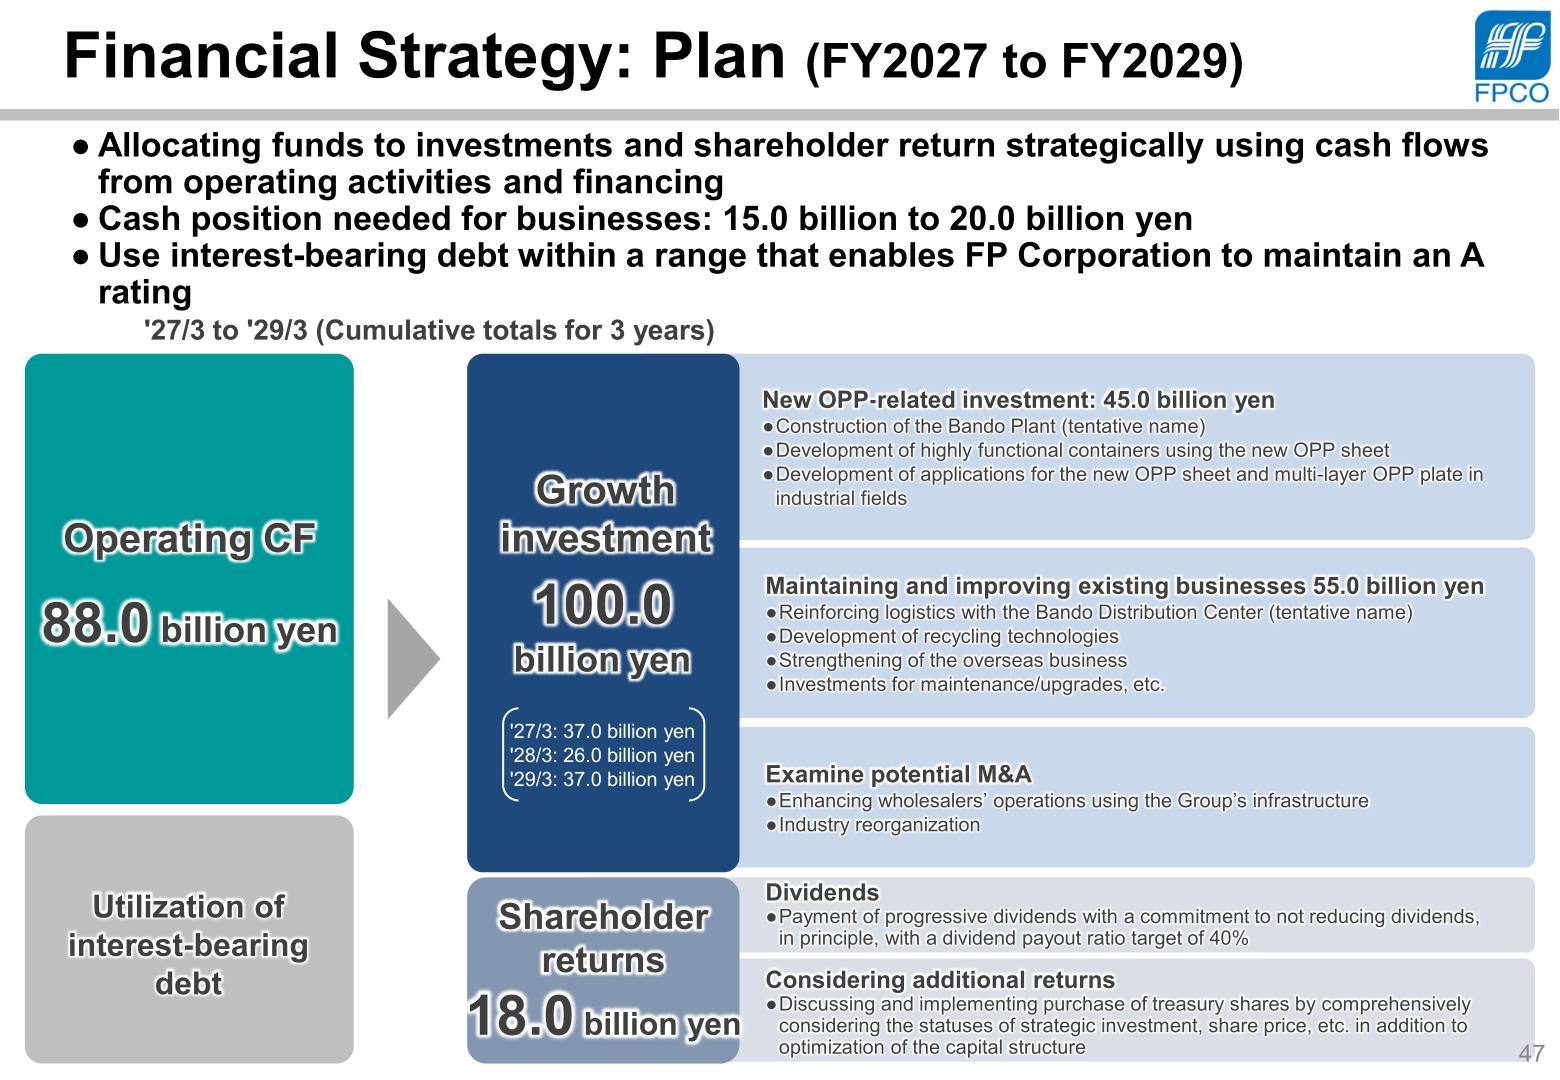
FP Corporation targets net sales of 300.0 billion yen and ordinary profit of 30.0 billion yen for the fiscal year ending March 31, 2030, aiming for near-double-digit growth by expanding into growth domains (including a new OPP material, overseas business, M&A, frozen food, and agriculture) in addition to an expected 2% to 3% annual average growth in existing businesses. For the three years from the fiscal year ending March 2027 to the fiscal year ending March 2029, the company plans cumulative operating cash flow of 88.0 billion yen, growth investment of 100.0 billion yen (comprising 45.0 billion yen in new OPP-related investment, including construction of the Bando Plant, and 55.0 billion yen for maintaining and improving existing businesses), and shareholder returns of 18.0 billion yen, while maintaining a dividend payout ratio target of 40% and a commitment, in principle, not to reduce dividends. The company is also discussing and implementing the purchase of treasury shares as an additional shareholder return, based on a comprehensive assessment of strategic investment needs and share price. As achievements for the fiscal year ended March 2026, operating cash flow was 30.0 billion yen, of which 16.6 billion yen was allocated to growth investment (capital investments and M&A) and 5.8 billion yen to dividends, while net interest-bearing debt decreased by 7.6 billion yen. Separately, the company’s Malaysia-based overseas affiliate, Lee Soon Seng Plastic Industries Sdn. Bhd. (LSSPI; 60% owned by Mitsui & Co., Ltd. and 40% by FP Corporation), is expected to start contributing to earnings in the fiscal year ending March 2027 as productivity improves and the company aims to gain market share in Malaysia and Singapore.
This article is an analysis based on publicly available information and is not a recommendation to buy or sell any specific securities. Investment decisions are your own responsibility.
















