
This article is based on publicly available IR materials and is not a recommendation to buy or sell any specific securities.
Note: TAKARA & COMPANY LTD.’s fiscal year ends May 31. This article classifies the fiscal year ended May 31, 2026 (the company’s 89th term) as “FY2025” in line with our site-wide fiscal-year convention; the periods, labels, and figures below otherwise follow the company’s own “fiscal year ended/ending May 31” notation as presented in its results materials. Consolidated net sales for the fiscal year ended May 31, 2026 rose 5.0% year on year to ¥31,154 million, and operating income rose 9.2% to ¥4,420 million, driven by growth in both the Disclosure-related business and the Interpreting & Translation business. Ordinary income increased 8.1% to ¥4,584 million, but profit attributable to owners of parent decreased 17.0% to ¥3,382 million, reflecting a smaller extraordinary gain than in the prior year.
Consolidated Results (Full-Year Actual)
Net sales of the Disclosure-related business increased 5.0% on favorable trends for multiple products, including WizLabo, consulting, and integrated reports, expanded market share chiefly in the Kanto region, and the consolidation of J Trust Co., Ltd. Net sales of the Interpreting & Translation business increased 4.9%, driven by an increase in the number of customers from new business development and by demand for interpreting associated with international conferences and large-scale events, as well as a focus on sales of AI interpretation and AI translation services. Operating profit margin rose to 14.2% from 13.6%, even as personnel expenses and amortization of goodwill increased. Profit attributable to owners of parent declined because the prior fiscal year’s extraordinary income included a larger gain on the sale of fixed assets, whereas this fiscal year’s extraordinary income reflected a gain on the sale of strategically held shares.
| Item | FY ended May 31, 2026 | FY ended May 31, 2025 | Change |
|---|---|---|---|
| Net sales (¥MM) | 31,154 | 29,678 | 5.0% |
| Operating income (¥MM) | 4,420 | 4,048 | 9.2% |
| Operating Profit Margin | 14.2% | 13.6% | 0.6Pt |
| Ordinary income (¥MM) | 4,584 | 4,239 | 8.1% |
| Profit attributable to owners of parent (¥MM) | 3,382 | 4,075 | △17.0% |
| EPS (Yen) | 261.92 | 314.00 | △52.08 |
| ROE (%) | 10.8% | 14.1% | △3.3Pt |
| Total assets (¥MM) | 42,527 | 40,183 | 5.8% |
| Net assets (¥MM) | 32,806 | 30,727 | 6.8% |
| Equity ratio (%) | 76.2% | 75.5% | 0.7Pt |
Segment Results
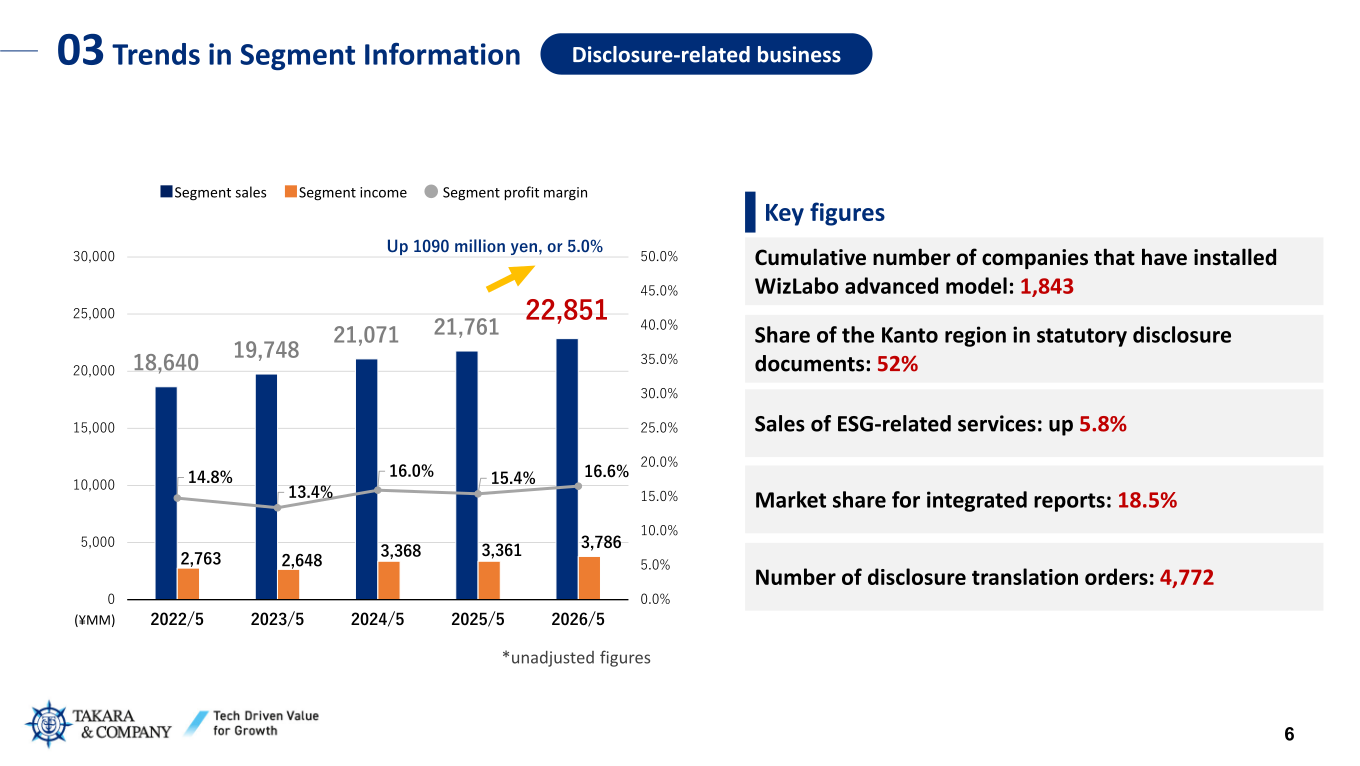
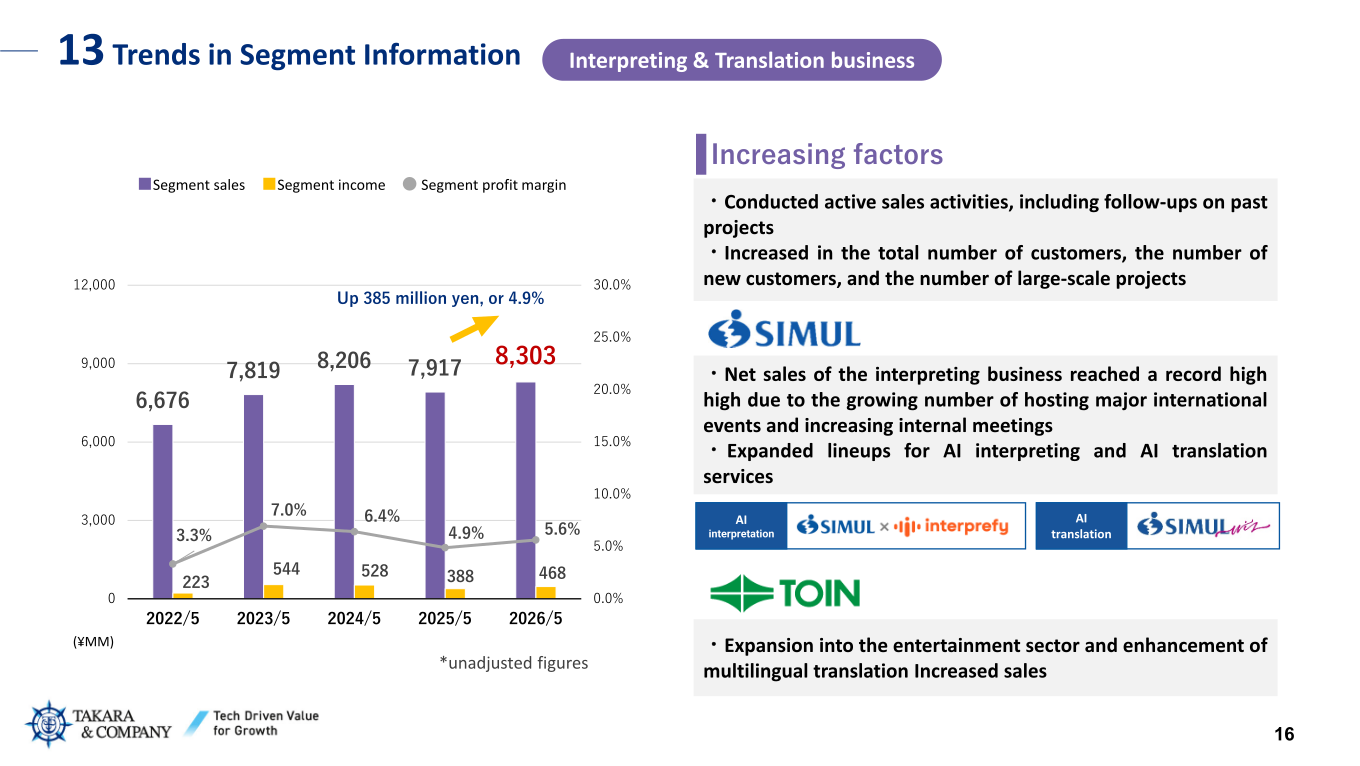
The Disclosure-related business, which supports listed companies and IPO-bound companies with statutory disclosure documents, WizLabo, consulting, translation, and integrated reports, reported segment sales of ¥22,851 million, up 1,090 million yen, or 5.0%, and segment income of ¥3,786 million, with segment profit margin rising to 16.6% from 15.4%. Key figures cited for this segment include a cumulative 1,843 companies using the WizLabo advanced model, a 52% share of the Kanto region in statutory disclosure documents, an 18.5% market share for integrated reports, and 4,772 disclosure translation orders. The Interpreting & Translation business reported segment sales of ¥8,303 million, up 385 million yen, or 4.9%, and segment income of ¥468 million, with segment profit margin of 5.6%, up from 4.9%; interpreting business sales reached a record high on growing numbers of international events and internal meetings, alongside expanded AI interpreting and AI translation service lineups.
| Segment | Metric | FY ended May 31, 2026 | FY ended May 31, 2025 |
|---|---|---|---|
| Disclosure-related business | Segment sales (¥MM) | 22,851 | 21,761 |
| Disclosure-related business | Segment income (¥MM) | 3,786 | 3,361 |
| Disclosure-related business | Segment profit margin | 16.6% | 15.4% |
| Interpreting & Translation business | Segment sales (¥MM) | 8,303 | 7,917 |
| Interpreting & Translation business | Segment income (¥MM) | 468 | 388 |
| Interpreting & Translation business | Segment profit margin | 5.6% | 4.9% |
Fiscal Year Ending May 31, 2027 Forecast
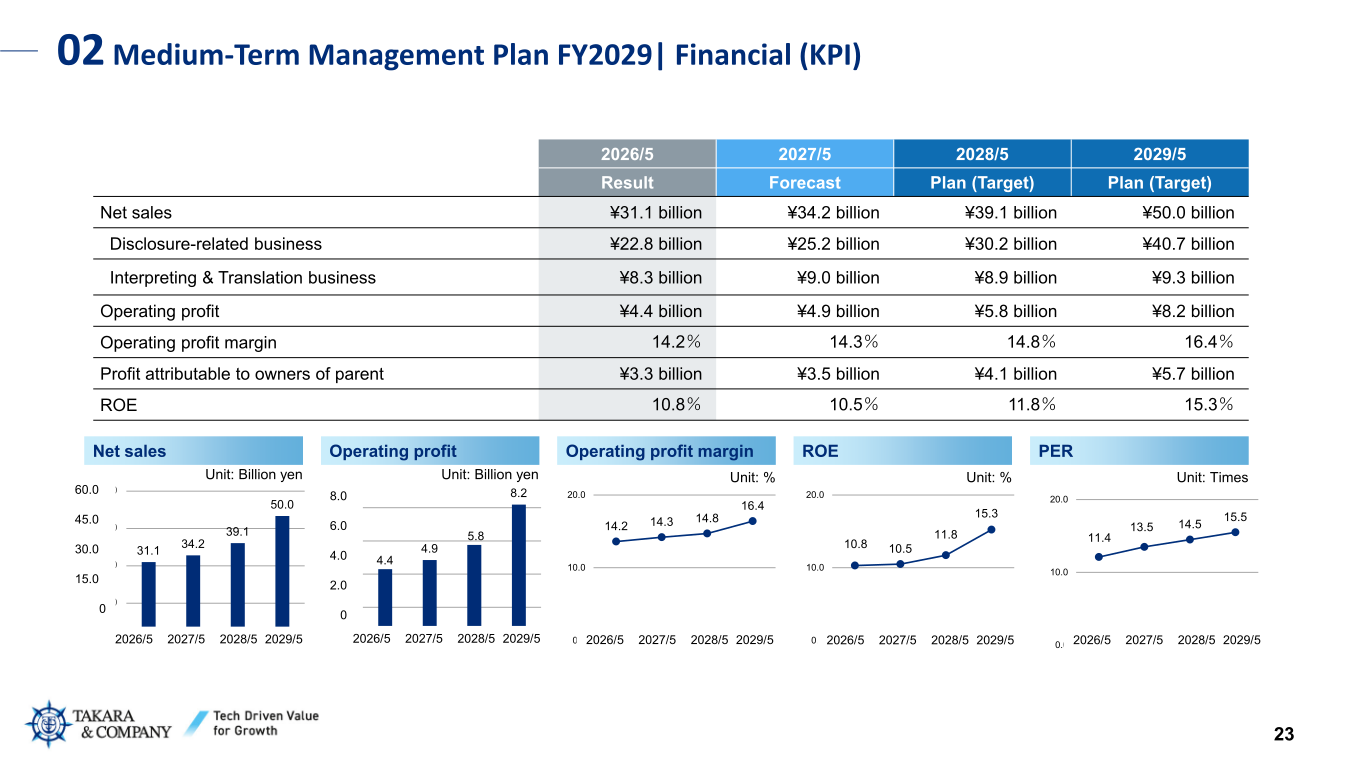
As part of its Medium-Term Management Plan FY2029, TAKARA & COMPANY forecasts consolidated net sales of ¥34.2 billion, operating profit of ¥4.9 billion (operating profit margin of 14.3%), and profit attributable to owners of parent of ¥3.5 billion for the fiscal year ending May 31, 2027, with ROE of 10.5%.
| Item | Forecast (FY ending May 31, 2027) | FY ended May 31, 2026 (Actual) |
|---|---|---|
| Net sales (Billion yen) | 34.2 | 31.1 |
| Operating profit (Billion yen) | 4.9 | 4.4 |
| Operating profit margin | 14.3% | 14.2% |
| Profit attributable to owners of parent (Billion yen) | 3.5 | 3.3 |
| ROE | 10.5% | 10.8% |
Shareholder Returns
TAKARA & COMPANY is shifting its dividend policy from paying “stable dividends” to providing “flexible dividends,” and has introduced DOE (dividend on equity) as a new KPI, aiming for 7.5% or higher; the targeted dividend payout ratio has also been changed from “approximately 50%” to a range of “50%-100%.” For the fiscal year ended May 31, 2026, the company paid an annual dividend of ¥120 per share (interim dividend of ¥60 plus year-end dividend of ¥60), for a dividend payout ratio of 45.8% and DOE of 5.3%. For the fiscal year ending May 31, 2027, the company forecasts an annual dividend of ¥180 per share (interim dividend of ¥90 plus year-end dividend of ¥90), for a payout ratio of 66.4% and DOE of 7.6%. Under its capital policy, the company said it will explore all possibilities and measures for shareholder returns — including commemorative dividends during the term of its current medium-term management plan, the resumption of its shareholder benefit program, and share buybacks — and will optimize them as options for consideration.
| Metric | FY2022/5 | FY2023/5 | FY2024/5 | FY2025/5 | FY2026/5 |
|---|---|---|---|---|---|
| Dividends per share (Yen) | 58 | 70 | 80 | 120 | 120 |
Medium-Term Management Plan
Under its previous Medium-Term Management Plan (2024-2026), TAKARA & COMPANY added J Trust Co., Ltd. to the group, strengthening its financial-products disclosure business, and continued system development focused on bolstering WizLabo functionality, drawing on approximately ¥16 billion or more in operating cash flow as its source of funds; the company rated its progress on growth investment as needing improvement, while it rated progress on strengthening its management base and on shareholder returns highly, having continued to pay stable dividends targeting a payout ratio of approximately 50% (annual dividend per share for the fiscal year ended May 31, 2026: ¥120). The company has now formulated a new Medium-Term Management Plan FY2029, targeting net sales of ¥50.0 billion, operating profit of ¥8.2 billion (operating profit margin of 16.4%), profit attributable to owners of parent of ¥5.7 billion, and ROE of 15.3% for the fiscal year ending May 31, 2029. The plan calls for actively utilizing AI to strengthen product competitiveness, including incorporating AI into WizLabo, and for improving internal business efficiency.
This article is an analysis based on publicly available information and is not a recommendation to buy or sell any specific securities. Investment decisions are your own responsibility.
















