
This article is based on publicly available IR materials and is not a recommendation to buy or sell any specific securities.
Note: Hagihara Industries uses an October fiscal year-end and labels the year covered here as “FY10/25” (November 1, 2024 – October 31, 2025); this site classifies it as FY2025. All figures below follow the labels used in the company’s English-language full-year results presentation dated December 8, 2025 (“Results briefing materials, FY10/25 results”).
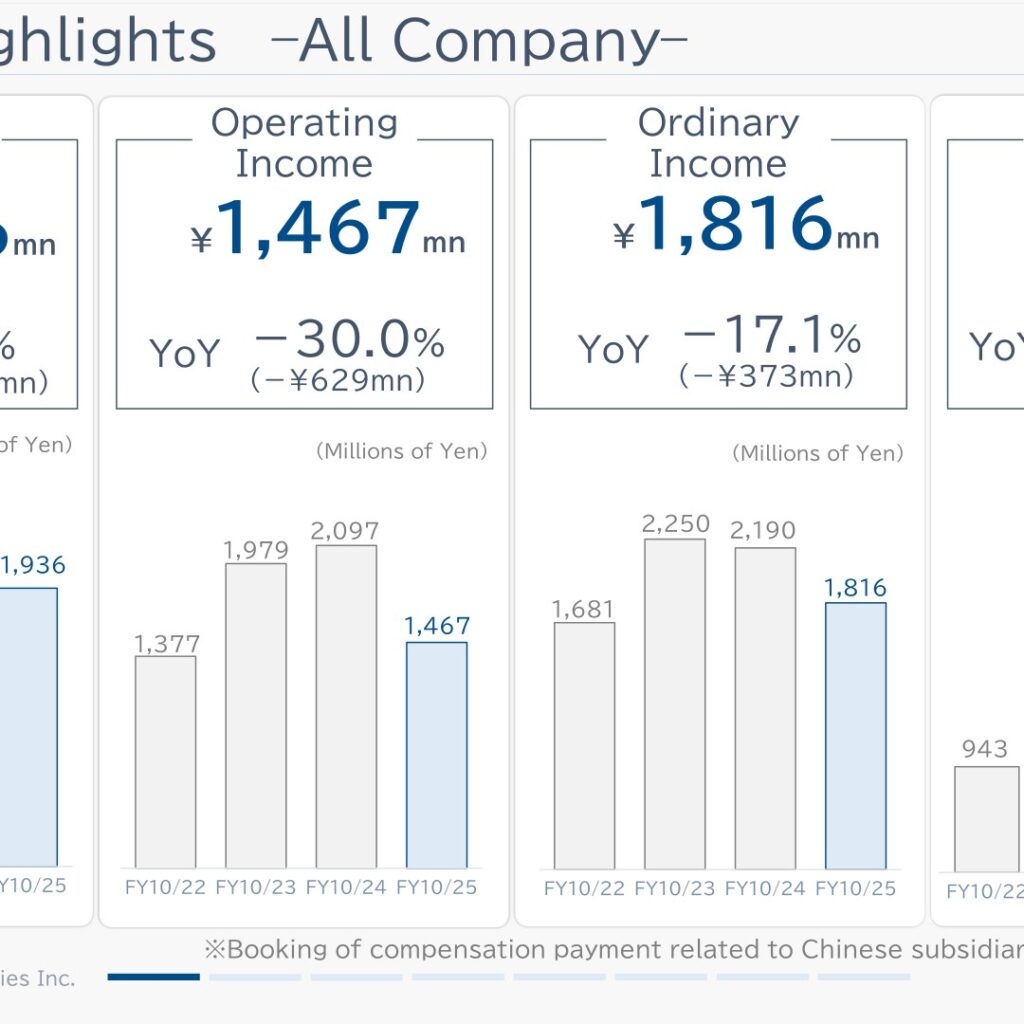
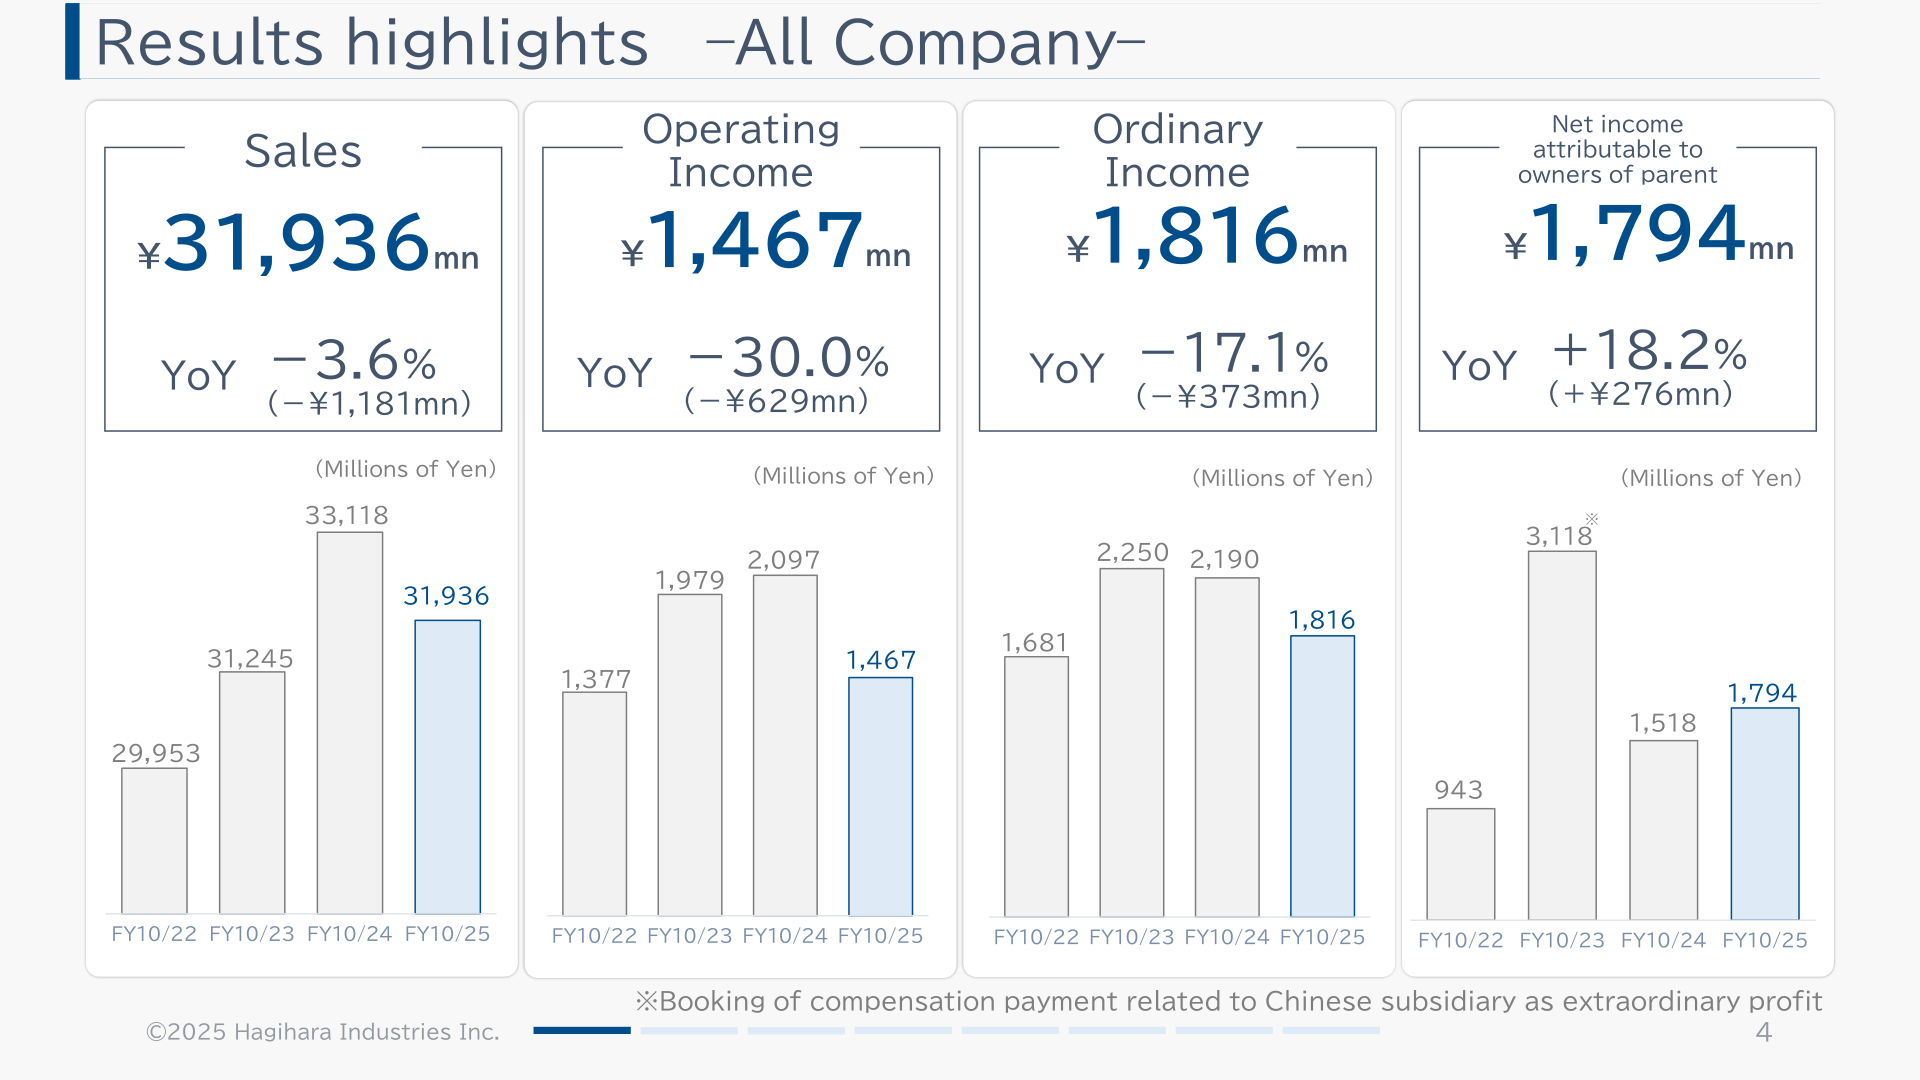
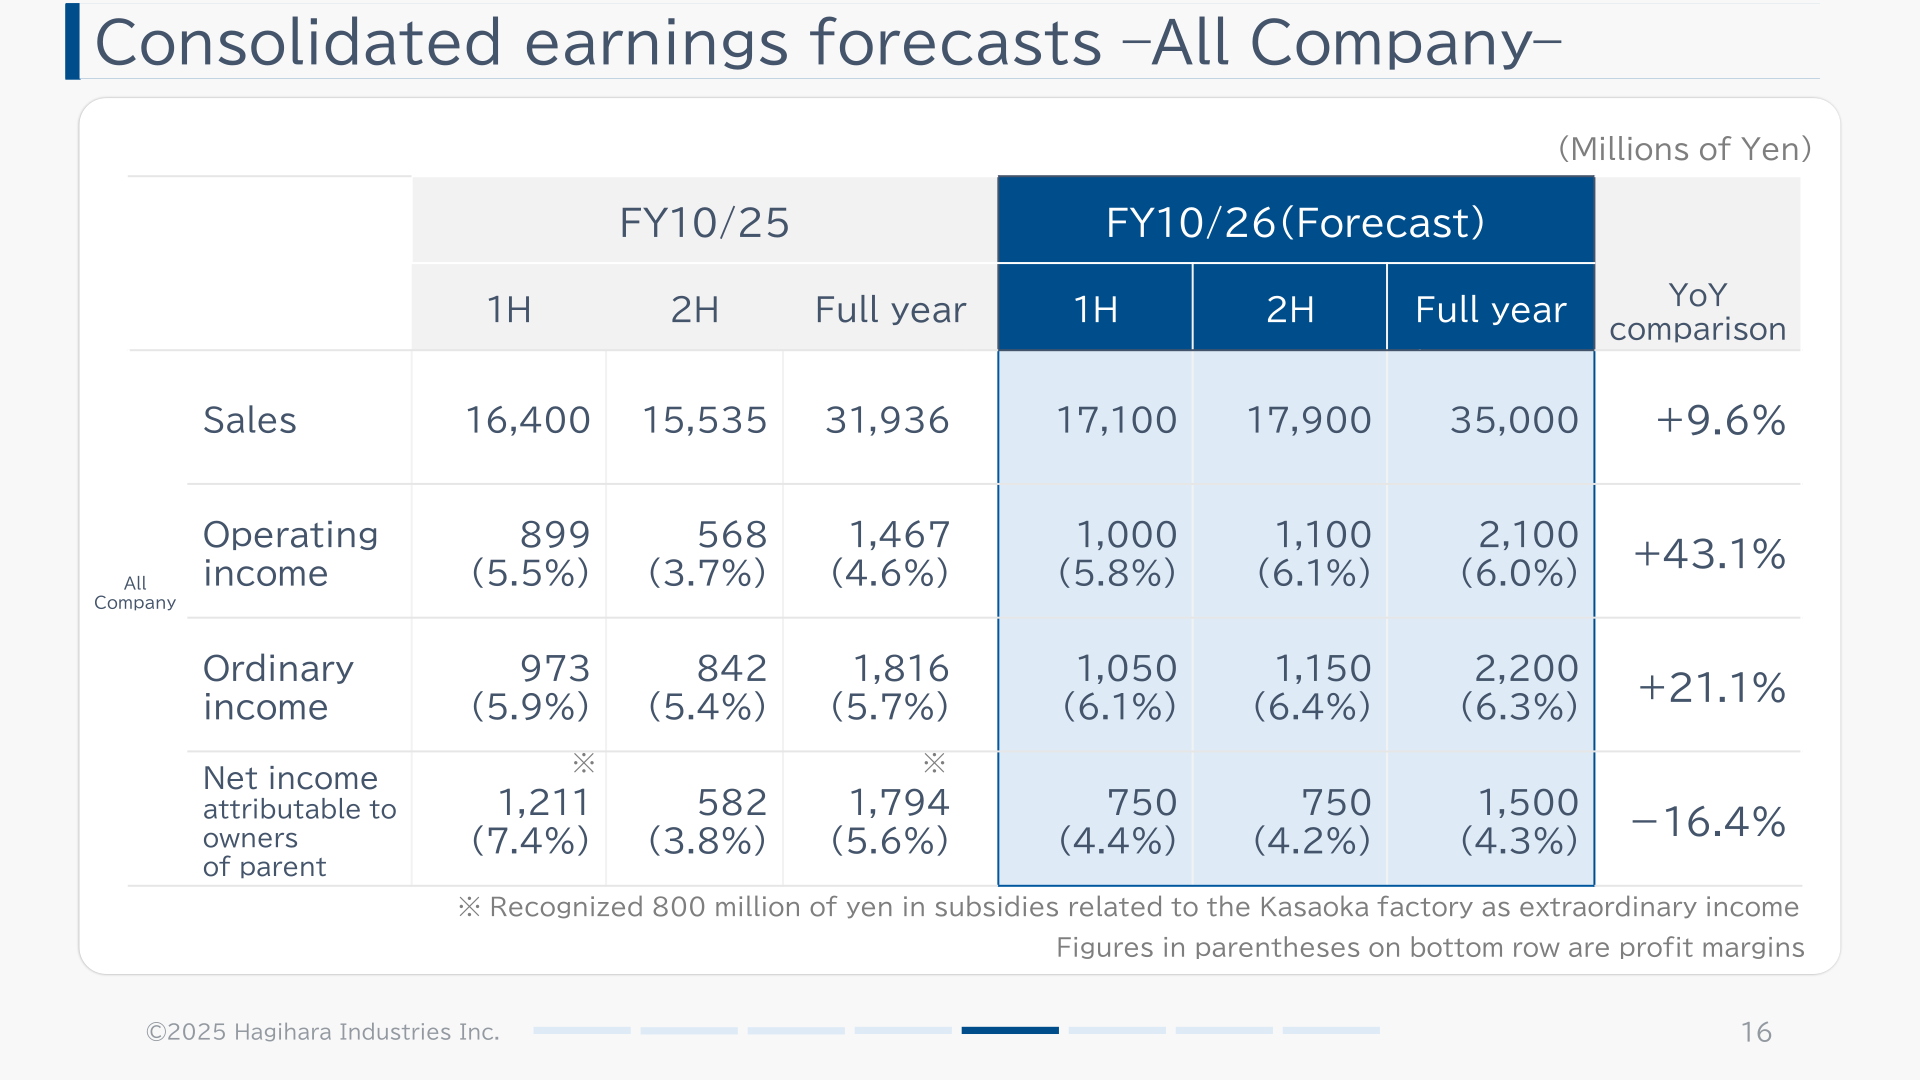
Hagihara Industries reported consolidated net sales of 31,936 million yen for FY10/25, down 3.6% year on year, with operating income of 1,467 million yen, down 30.0%, and ordinary income of 1,816 million yen, down 17.1%. Net income attributable to owners of parent rose 18.2% to 1,794 million yen, which the company attributes in part to recognizing 800 million yen in subsidies related to the Kasaoka factory as extraordinary income. For FY10/26 the company forecasts net sales of 35,000 million yen (+9.6%), operating income of 2,100 million yen (+43.1%), ordinary income of 2,200 million yen (+21.1%) and net income of 1,500 million yen (-16.4%). The annual dividend per share for FY10/25 was 65 yen, up from 60 yen in FY10/24.
Consolidated Results (Full-Year Actual)
Net sales declined 3.6% year on year and all three profit lines from operating income through ordinary income declined, while net income attributable to owners of parent increased. On the sales bridge, the company attributes the year-on-year change to a +42 million yen impact from sales price increases (raising unit prices to pass through higher raw material and other input costs), a -473 million yen impact from lower sales volume in the Plastic-processed Products (PLS) segment (Sheet, Laminated cloth, Meltac cloth, etc.), a -20 million yen foreign exchange effect, and a -731 million yen decline in the Engineering (ENG) segment (Paper slitters, screen changers). On the operating income bridge, the decline reflects a -265 million yen impact from decreased sales and a -236 million yen impact from deteriorating gross profit margin (increased depreciation expenses, etc.) in the PLS segment, together with a -194 million yen impact from decreased sales, a +220 million yen impact from gross profit margin improvement, and a -154 million yen impact from increased selling, general and administrative expenses (system updates, etc.) in the ENG segment.
| Item (million yen) | FY10/25 | FY10/24 | Year-on-year change |
|---|---|---|---|
| Net sales | 31,936 | 33,118 | -3.6% (-1,181) |
| Operating income | 1,467 | 2,097 | -30.0% (-629) |
| Ordinary income | 1,816 | 2,190 | -17.1% (-373) |
| Net income attributable to owners of parent | 1,794 | 1,518 | +18.2% (+276) |
Segment Results
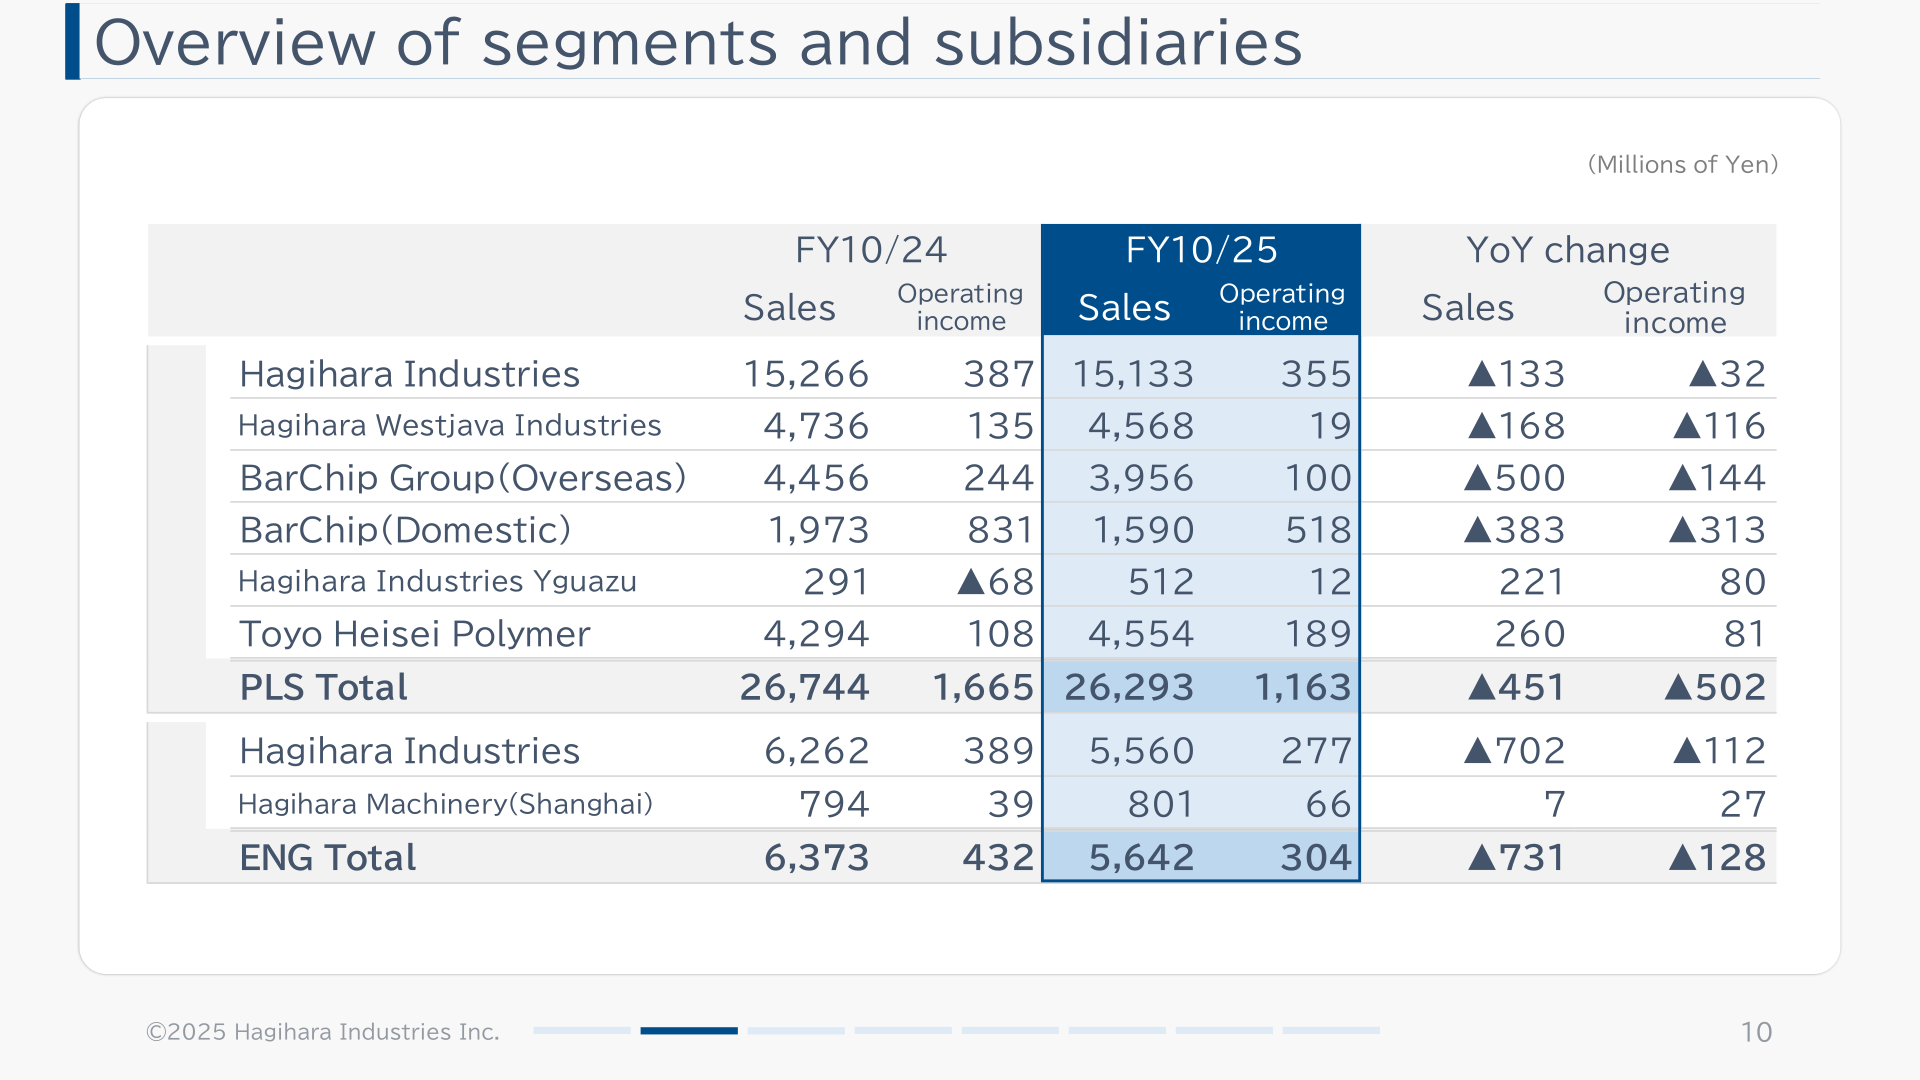
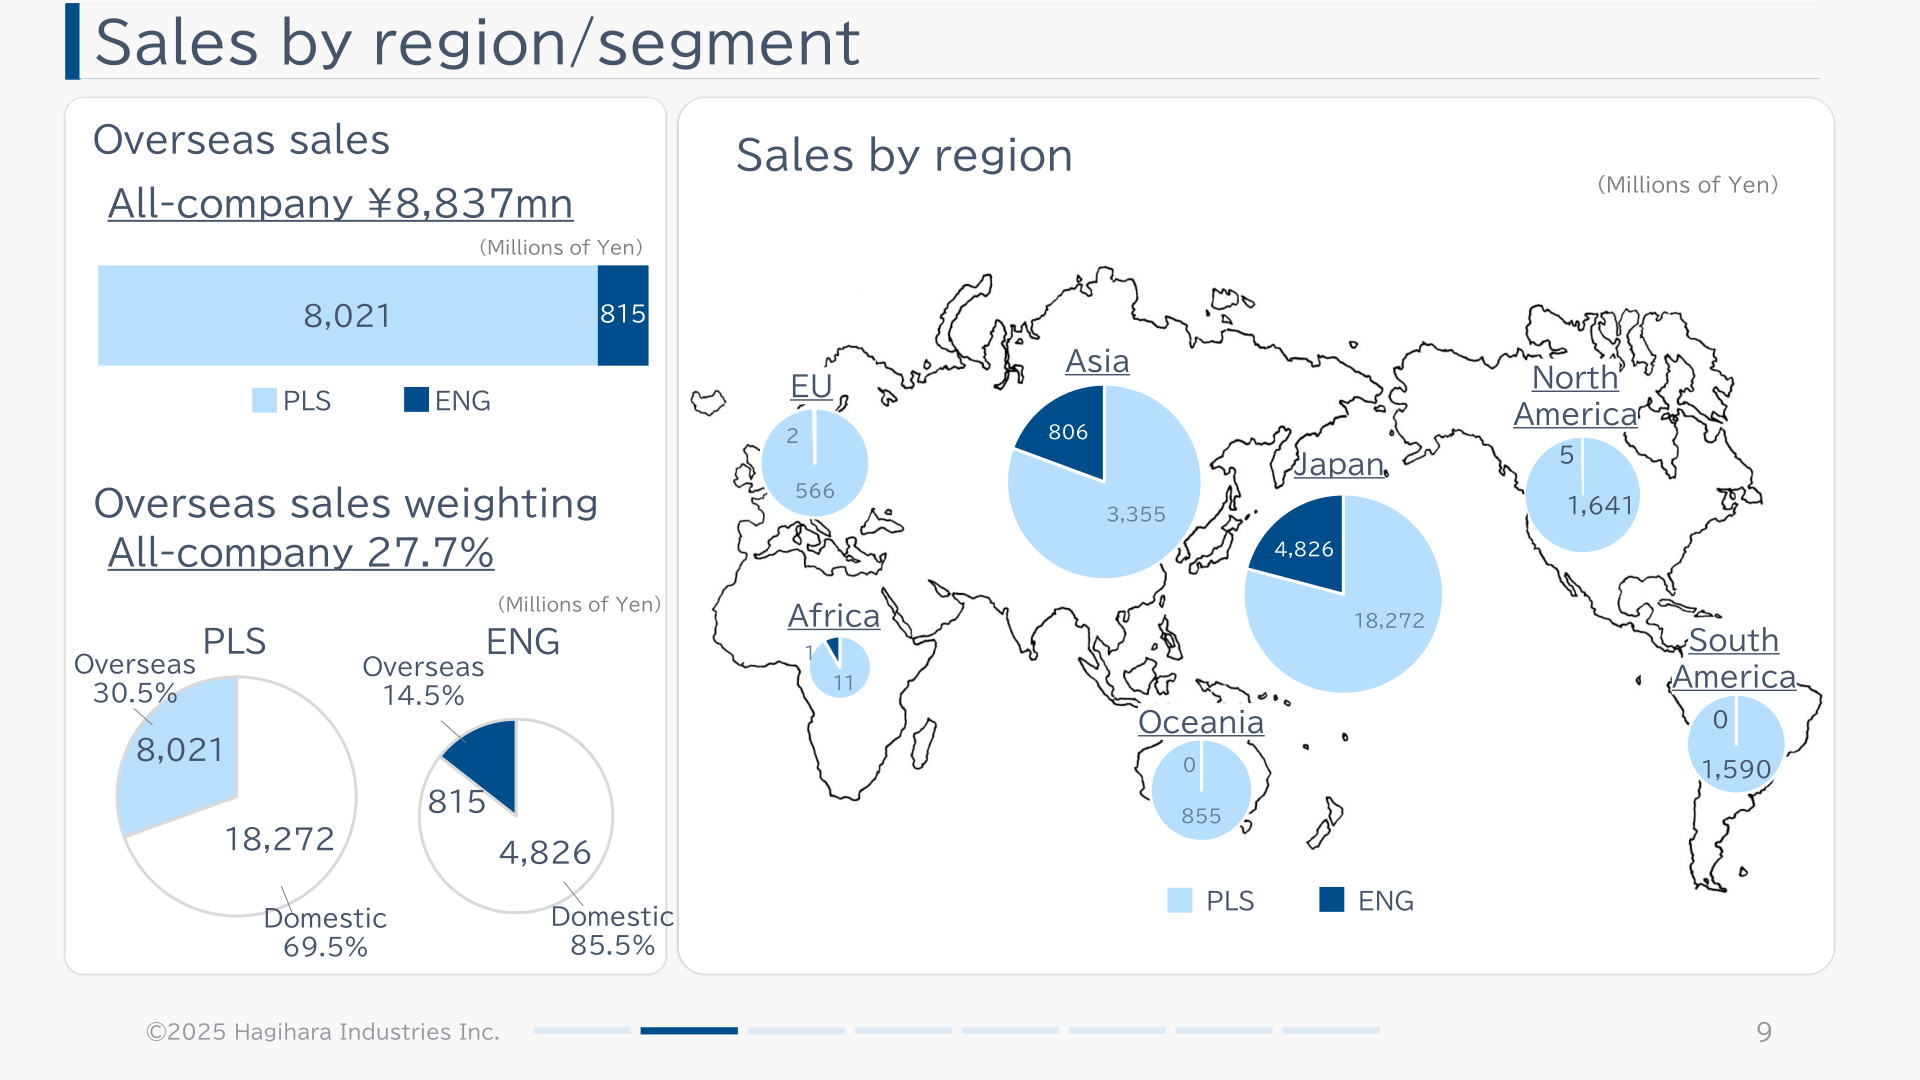
The company reports results in two segments: Plastic-processed Products (PLS) and Engineering (ENG). PLS net sales declined 1.7% year on year to 26,293 million yen and PLS operating income fell 30.1% to 1,163 million yen. ENG net sales declined 11.5% year on year to 5,642 million yen and ENG operating income fell 29.6% to 304 million yen, while the ENG order backlog rose 3.8% year on year to 5,076 million yen. At the subsidiary level, Hagihara Westjava Industries operating income fell to 19 million yen from 135 million yen and BarChip Group (Overseas) fell to 100 million yen from 244 million yen, while Hagihara Industries Yguazu improved to operating income of 12 million yen from an operating loss of 68 million yen and Toyo Heisei Polymer’s operating income rose to 189 million yen from 108 million yen. Overseas sales for the year totaled 8,837 million yen, or 27.7% of all-company sales, comprising an overseas ratio of 30.5% for PLS and 14.5% for ENG; by region, Japan led with PLS sales of 18,272 million yen and ENG sales of 4,826 million yen, followed by Asia at 3,355 million yen (PLS) and 806 million yen (ENG).
| Segment (million yen) | Metric | FY10/25 | FY10/24 | Year-on-year change |
|---|---|---|---|---|
| Plastic-processed Products (PLS) | Net sales | 26,293 | 26,744 | -1.7% (-450) |
| Plastic-processed Products (PLS) | Operating income | 1,163 | 1,665 | -30.1% (-501) |
| Engineering (ENG) | Net sales | 5,642 | 6,373 | -11.5% (-731) |
| Engineering (ENG) | Operating income | 304 | 432 | -29.6% (-128) |
| Engineering (ENG) | Order backlog | 5,076 | 4,888 | +3.8% (+188) |
| Company (million yen) | Metric | FY10/24 | FY10/25 | Year-on-year change |
|---|---|---|---|---|
| Hagihara Industries (PLS) | Net sales | 15,266 | 15,133 | -133 |
| Hagihara Industries (PLS) | Operating income | 387 | 355 | -32 |
| Hagihara Westjava Industries | Net sales | 4,736 | 4,568 | -168 |
| Hagihara Westjava Industries | Operating income | 135 | 19 | -116 |
| BarChip Group (Overseas) | Net sales | 4,456 | 3,956 | -500 |
| BarChip Group (Overseas) | Operating income | 244 | 100 | -144 |
| BarChip (Domestic) | Net sales | 1,973 | 1,590 | -383 |
| BarChip (Domestic) | Operating income | 831 | 518 | -313 |
| Hagihara Industries Yguazu | Net sales | 291 | 512 | +221 |
| Hagihara Industries Yguazu | Operating income | -68 | 12 | +80 |
| Toyo Heisei Polymer | Net sales | 4,294 | 4,554 | +260 |
| Toyo Heisei Polymer | Operating income | 108 | 189 | +81 |
| PLS Total | Net sales | 26,744 | 26,293 | -451 |
| PLS Total | Operating income | 1,665 | 1,163 | -502 |
| Hagihara Industries (ENG) | Net sales | 6,262 | 5,560 | -702 |
| Hagihara Industries (ENG) | Operating income | 389 | 277 | -112 |
| Hagihara Machinery (Shanghai) | Net sales | 794 | 801 | +7 |
| Hagihara Machinery (Shanghai) | Operating income | 39 | 66 | +27 |
| ENG Total | Net sales | 6,373 | 5,642 | -731 |
| ENG Total | Operating income | 432 | 304 | -128 |
| Region (million yen) | PLS | ENG |
|---|---|---|
| Japan | 18,272 | 4,826 |
| Asia | 3,355 | 806 |
| North America | 1,641 | 5 |
| South America | 1,590 | 0 |
| Oceania | 855 | 0 |
| EU | 566 | 2 |
| Africa | 11 | 1 |
FY10/26 Forecast
For FY10/26, the company forecasts consolidated net sales of 35,000 million yen, up 9.6% year on year, operating income of 2,100 million yen (6.0% margin), up 43.1%, ordinary income of 2,200 million yen (6.3% margin), up 21.1%, and net income attributable to owners of parent of 1,500 million yen (4.3% margin), down 16.4%. By half, the company forecasts 1H FY10/26 net sales of 17,100 million yen and operating income of 1,000 million yen (5.8% margin), and 2H FY10/26 net sales of 17,900 million yen and operating income of 1,100 million yen (6.1% margin), compared with 1H FY10/25 actual net sales of 16,400 million yen and operating income of 899 million yen (5.5% margin), and 2H FY10/25 actual net sales of 15,535 million yen and operating income of 568 million yen (3.7% margin).
| Item (million yen) | FY10/26 Forecast | FY10/25 Actual | Year-on-year change |
|---|---|---|---|
| Net sales | 35,000 | 31,936 | +9.6% |
| Operating income | 2,100 | 1,467 | +43.1% |
| Ordinary income | 2,200 | 1,816 | +21.1% |
| Net income attributable to owners of parent | 1,500 | 1,794 | -16.4% |
Shareholder Returns
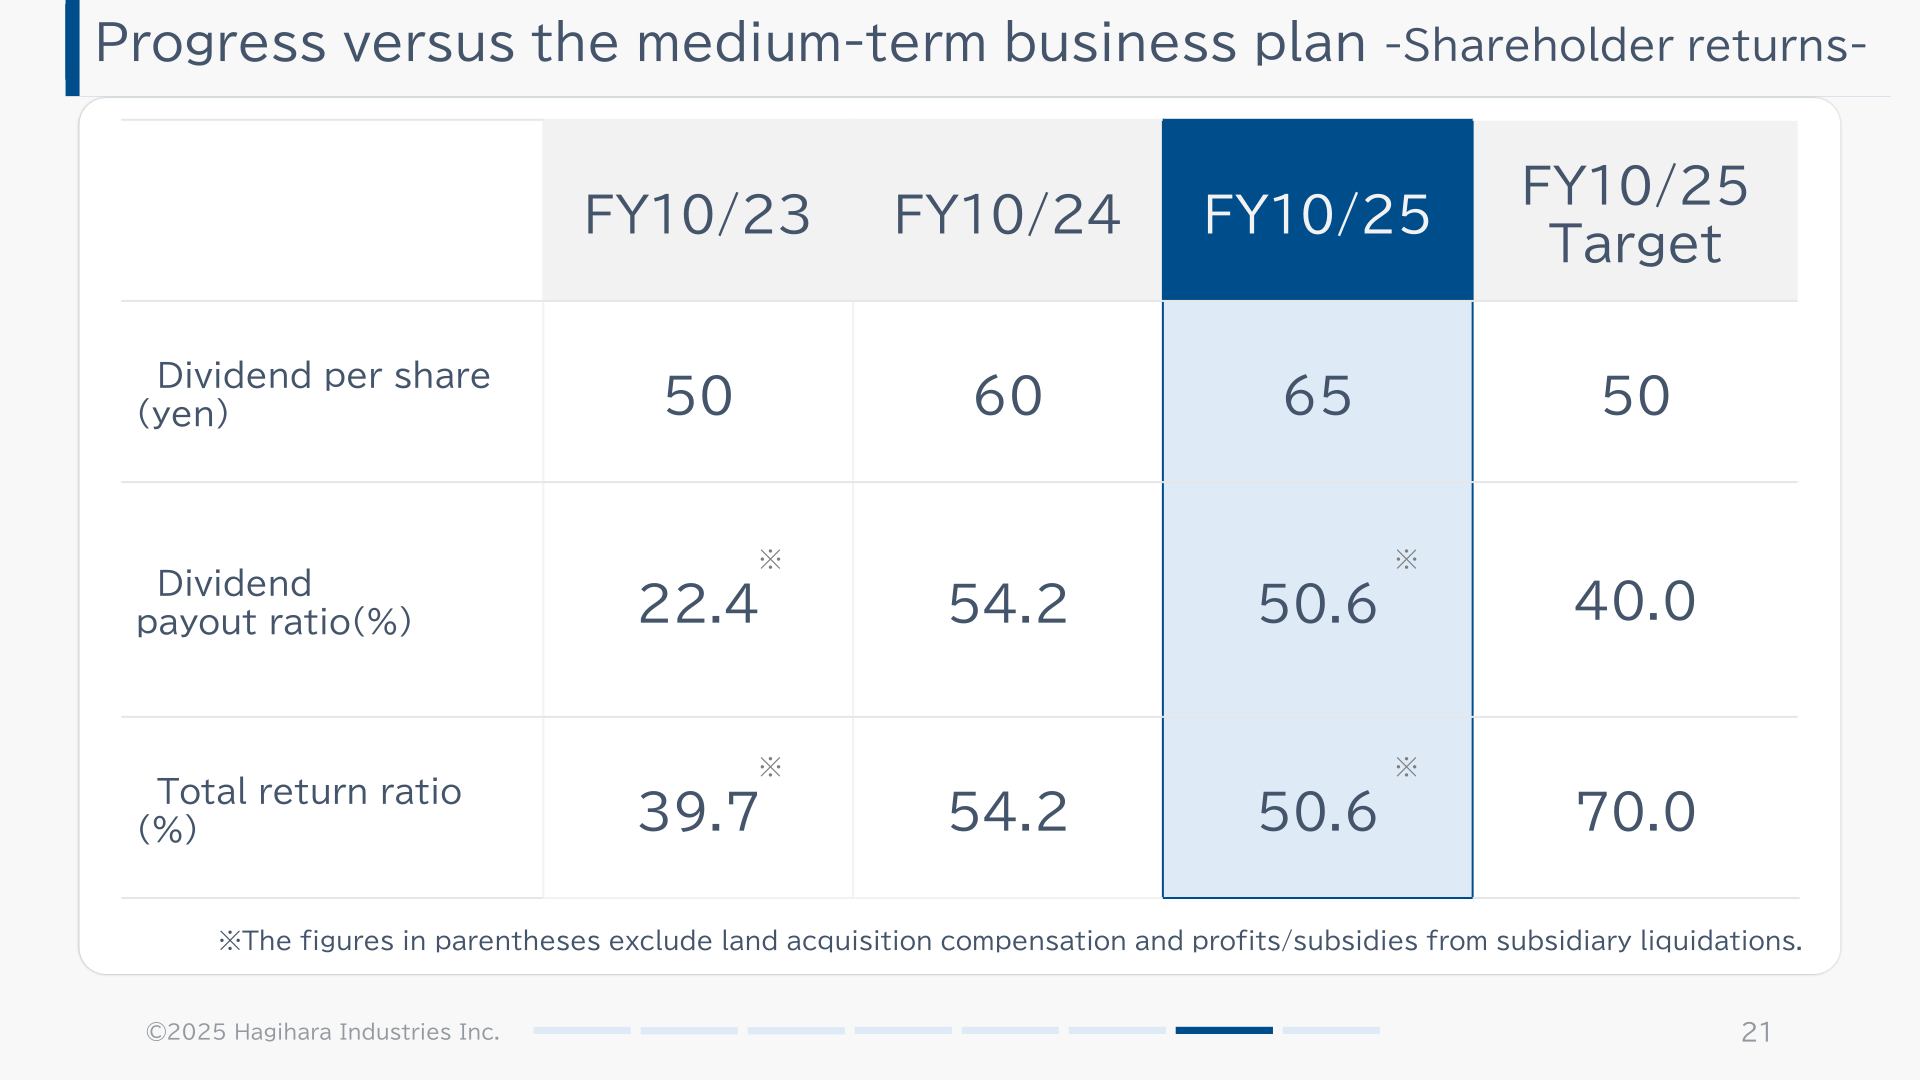
The annual dividend per share for FY10/25 was 65 yen, up from 60 yen in FY10/24, comprising an interim dividend of 30 yen and a year-end dividend of 35 yen, for a dividend payout ratio of 50.6%. Net assets per share rose to 2,197.41 yen from 2,088.91 yen, and the number of shareholders increased to 38,289 from 35,686. Against the medium-term business plan’s FY10/25 targets, the dividend per share of 65 yen exceeded the 50 yen target and the payout ratio of 50.6% exceeded the 40.0% target, while the total return ratio of 50.6% remained below the 70.0% target; the presentation notes that the payout ratio and total return ratio figures exclude land acquisition compensation and profits/subsidies from subsidiary liquidations.
| Item | FY10/22 | FY10/23 | FY10/24 | FY10/25 | FY10/25 Target |
|---|---|---|---|---|---|
| Dividend per share (yen) | 36 | 50 | 60 | 65 | 50 |
| Dividend payout ratio | 54.7% | 22.4% | 54.2% | 50.6% | 40.0% |
| Total return ratio | — | 39.7% | 54.2% | 50.6% | 70.0% |
| Net assets per share (yen) | 1,856.11 | 2,045.00 | 2,088.91 | 2,197.41 | — |
| Share price at fiscal year-end (yen) | 1,021 | 1,605 | 1,470 | 1,611 | — |
| Price-to-book ratio (PBR) | 0.55 | 0.78 | 0.70 | 0.73 | — |
Medium-Term Plan / Topics
Under the medium-term business plan, in units of Hundred Million Yen as stated in the presentation, three-year cumulative investment through FY10/25 totaled 102 against a three-year target of 105, comprising strategic investment of 41 (target: 40; including BarChip production facilities, Meltac production facilities, and a laminator at the Kasaoka Factory), Kasaoka Factory building investment of 25 (target: 25), and investment in maintenance/upgrades of 36 (target: 40). On financial strategy, FY10/25 ROE was 4.2% against a target of 8.0%, and the D/E ratio (debt/shareholders’ equity) was 0.4 against a target of 0.6, both calculated excluding expropriation compensation, gains from subsidiary liquidation, and subsidies. Topics for the period included the Narrow-Width Roll Straightening Machine “RSF-106-200” winning the Good Design Award, the opening of a new U.S. factory, a shareholder factory tour, and the company receiving the Minister of Land, Infrastructure, Transport and Tourism Commendation for the “8th JAPAN CONSTRUCTION International Award.”
This article is an analysis based on publicly available information and is not a recommendation to buy or sell any specific securities. Investment decisions are your own responsibility.
















