
This article is based on publicly available IR materials and is not a recommendation to buy or sell any specific securities.
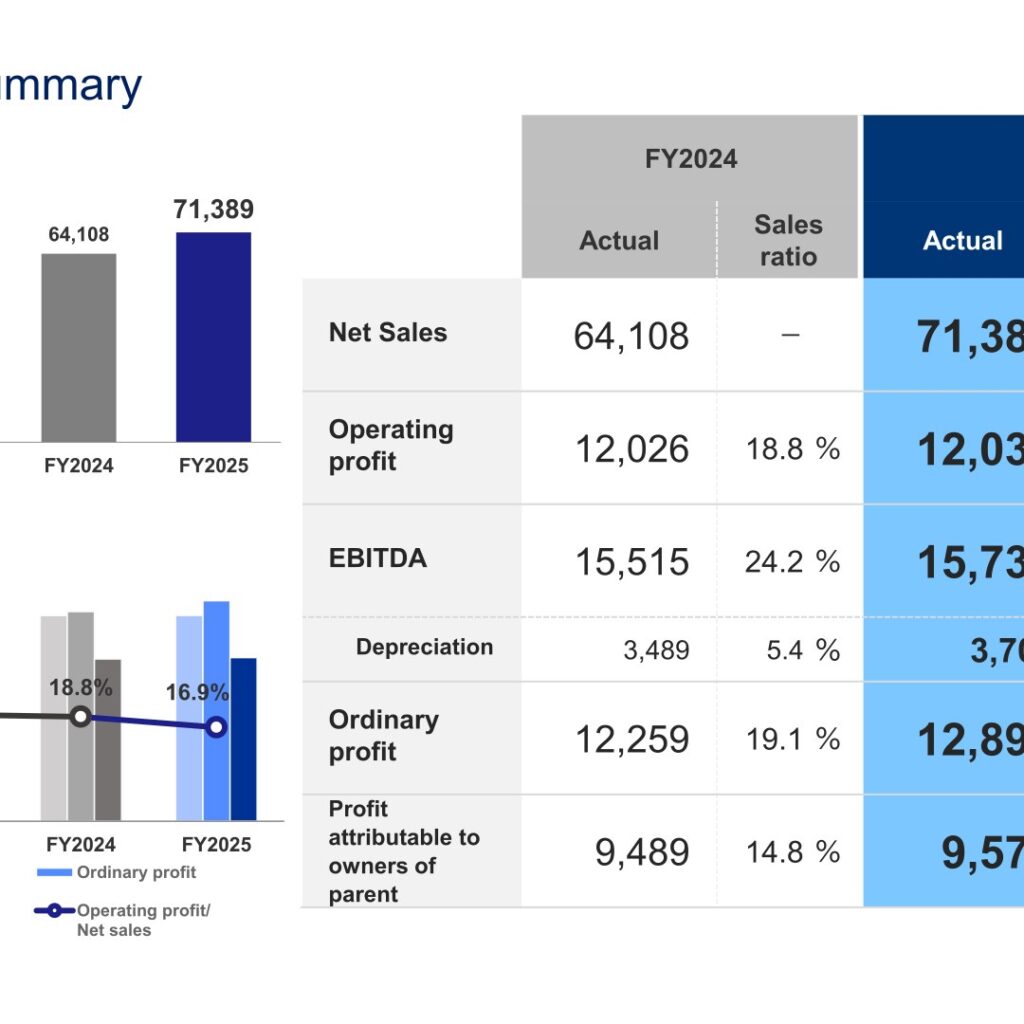
MAEDAKOSEN CO., LTD. (7821) posted record-high results across all major metrics for the fiscal year ended June 30, 2026, which the Company designates “FY2025” (July 1, 2025 – June 30, 2026). Consolidated net sales rose 11.4% year on year to ¥71,389 million, operating profit edged up 0.1% to ¥12,033 million, ordinary profit grew 5.2% to ¥12,892 million, and profit attributable to owners of parent increased 0.9% to ¥9,571 million. The results exceeded the Company’s initial full-year plan, which had called for higher sales but lower profit at the start of the period.
Consolidated Results (Full-Year Actual)
The Company attributed the record performance to (1) the contribution from two M&A deals completed in the previous fiscal year, (2) the progress of yen depreciation in foreign exchange, (3) the development of measures in response to changes in the external environment, and (4) the adoption of a sales management system. Each Group company also implemented a review of sales prices and strengthened its purchasing department for stable procurement of raw materials in anticipation of soaring raw material and fuel prices. Against its full-year plan, net sales achieved an achievement rate of 105.8%, operating profit 109.4%, EBITDA 107.1%, ordinary profit 117.2%, and profit attributable to owners of parent 125.9%. Return on equity (ROE) was 13.2% for FY2025 (down from 14.5% in FY2024), while return on invested capital (ROIC) was 12.4% against an estimated weighted average cost of capital (WACC) of 8.1%, a spread of 4.2 percentage points.
| Item | FY2025 | FY2024 | Change (YoY) |
|---|---|---|---|
| Net sales (millions of yen) | 71,389 | 64,108 | +11.4% |
| Operating profit (millions of yen / margin) | 12,033 (16.9%) | 12,026 (18.8%) | +0.1% |
| EBITDA* (millions of yen / margin) | 15,737 (22.0%) | 15,515 (24.2%) | +1.4% |
| Depreciation (millions of yen / ratio) | 3,703 (5.2%) | 3,489 (5.4%) | +6.1% |
| Ordinary profit (millions of yen / margin) | 12,892 (18.1%) | 12,259 (19.1%) | +5.2% |
| Profit attributable to owners of parent (millions of yen / margin) | 9,571 (13.4%) | 9,489 (14.8%) | +0.9% |
Segment Results
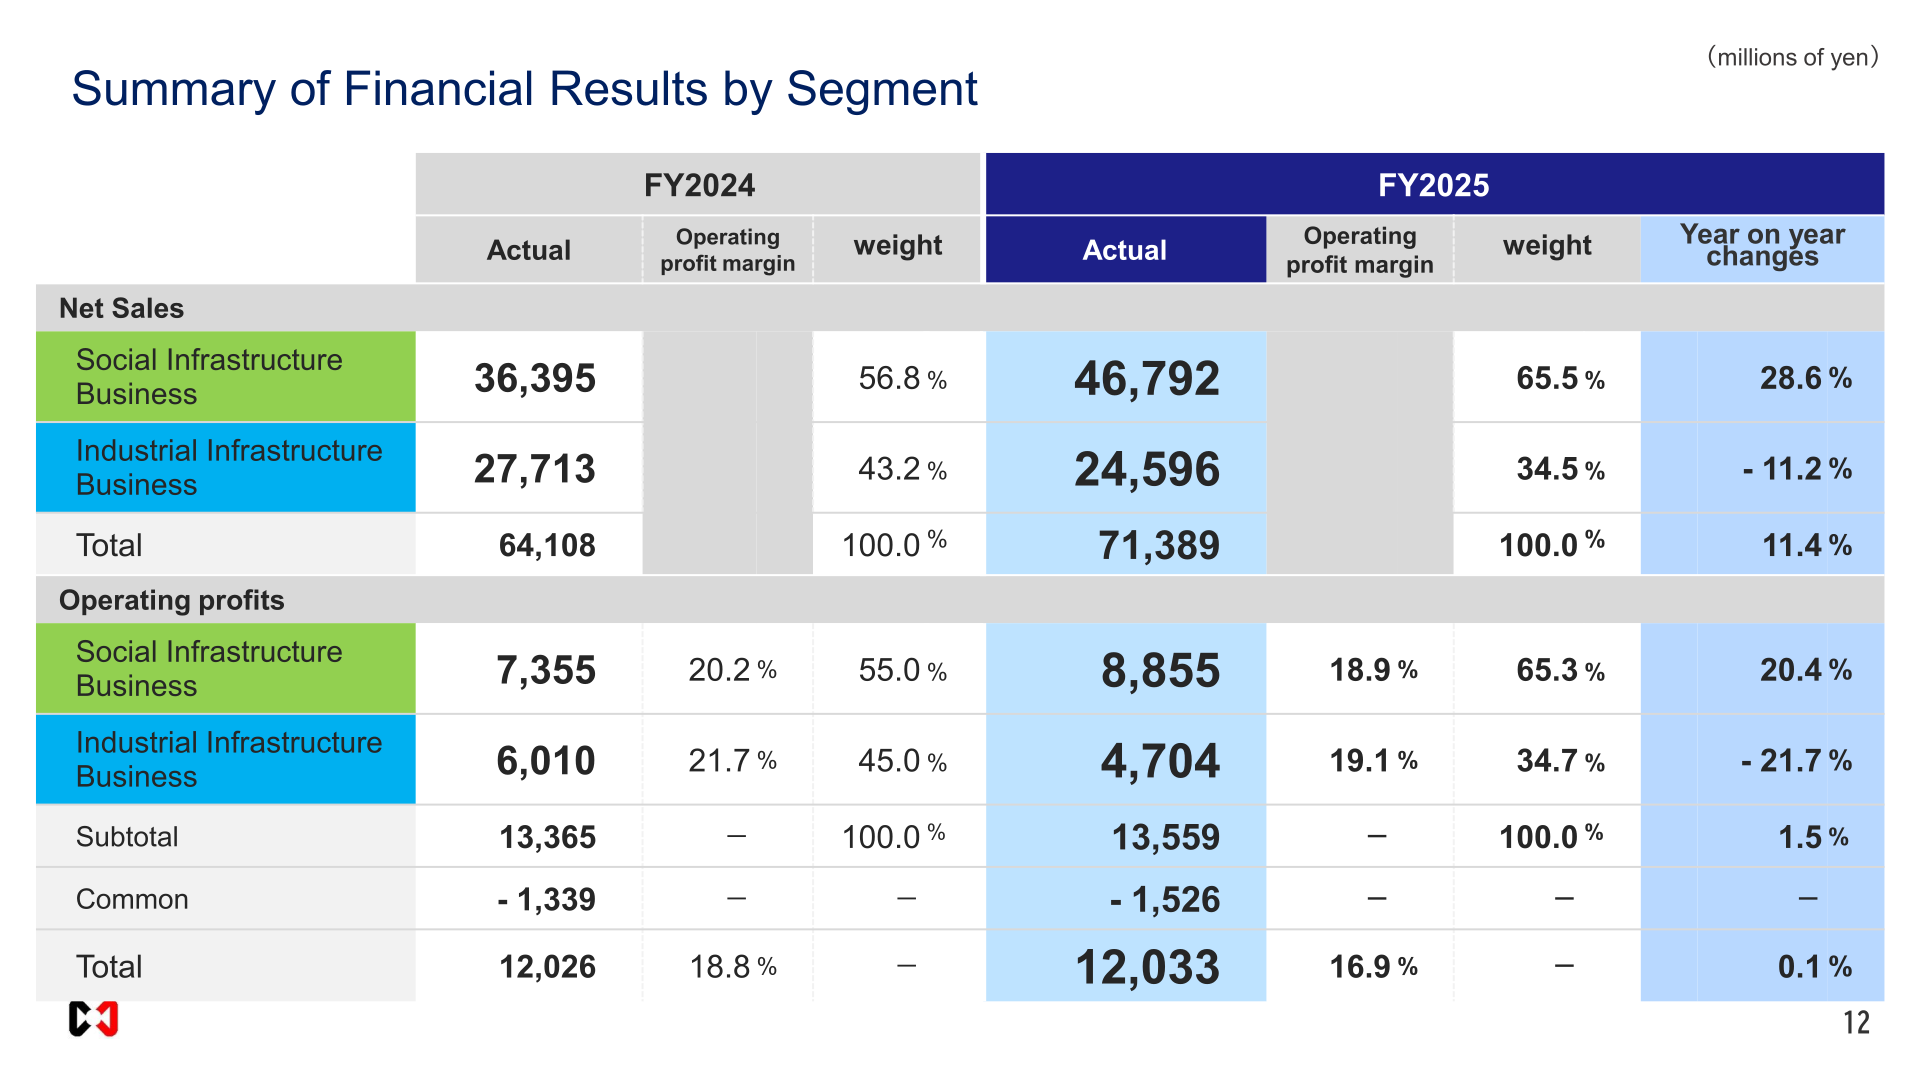
By segment, Social Infrastructure Business net sales rose 28.6% year on year to ¥46,792 million, accounting for 65.5% of total net sales, and operating profit increased 20.4% to ¥8,855 million. Industrial Infrastructure Business net sales declined 11.2% to ¥24,596 million (34.5% of total), and operating profit decreased 21.7% to ¥4,704 million. In the year-on-year analysis of the change in operating profit, net sales growth contributed +¥10,397 million from the Social Infrastructure Business and -¥3,116 million from the Industrial Infrastructure Business. In the Social Infrastructure Business, all product areas in the mainstay civil engineering materials business out-performed the plan, with national resilience-related and defense-related projects growing steadily and subsidiaries Maedakosen Industrial Products Co., Ltd. and MIRAI no AGRI CO., LTD. also performing strongly; the non-woven fabric business and subsidiary Kushiro Highmeal Co., Ltd. performed below plan, with Kushiro Highmeal significantly impacted by a decline in the selling price of fishmeal, its core product. In the Industrial Infrastructure Business, the BBS business performed well as BBS Japan’s strong domestic and overseas OEM sales exceeded the initial plan and new capital investment (a new coating line) was completed, while MIRAI KOSEN CO., LTD. achieved record-high performance on strong sales of wiping cloths for semiconductors; sales and profit at BBS Germany were significantly lower than the previous term, as initially expected, with recovery anticipated from the next fiscal year.
| Segment | Metric | FY2025 | FY2024 |
|---|---|---|---|
| Social Infrastructure Business | Net sales (millions of yen / weight) | 46,792 (65.5%) | 36,395 (56.8%) |
| Social Infrastructure Business | Operating profit (millions of yen / margin) | 8,855 (18.9%) | 7,355 (20.2%) |
| Industrial Infrastructure Business | Net sales (millions of yen / weight) | 24,596 (34.5%) | 27,713 (43.2%) |
| Industrial Infrastructure Business | Operating profit (millions of yen / margin) | 4,704 (19.1%) | 6,010 (21.7%) |
| Total | Net sales (millions of yen) | 71,389 | 64,108 |
| Total | Operating profit (millions of yen / margin) | 12,033 (16.9%) | 12,026 (18.8%) |
FY2026 Forecast
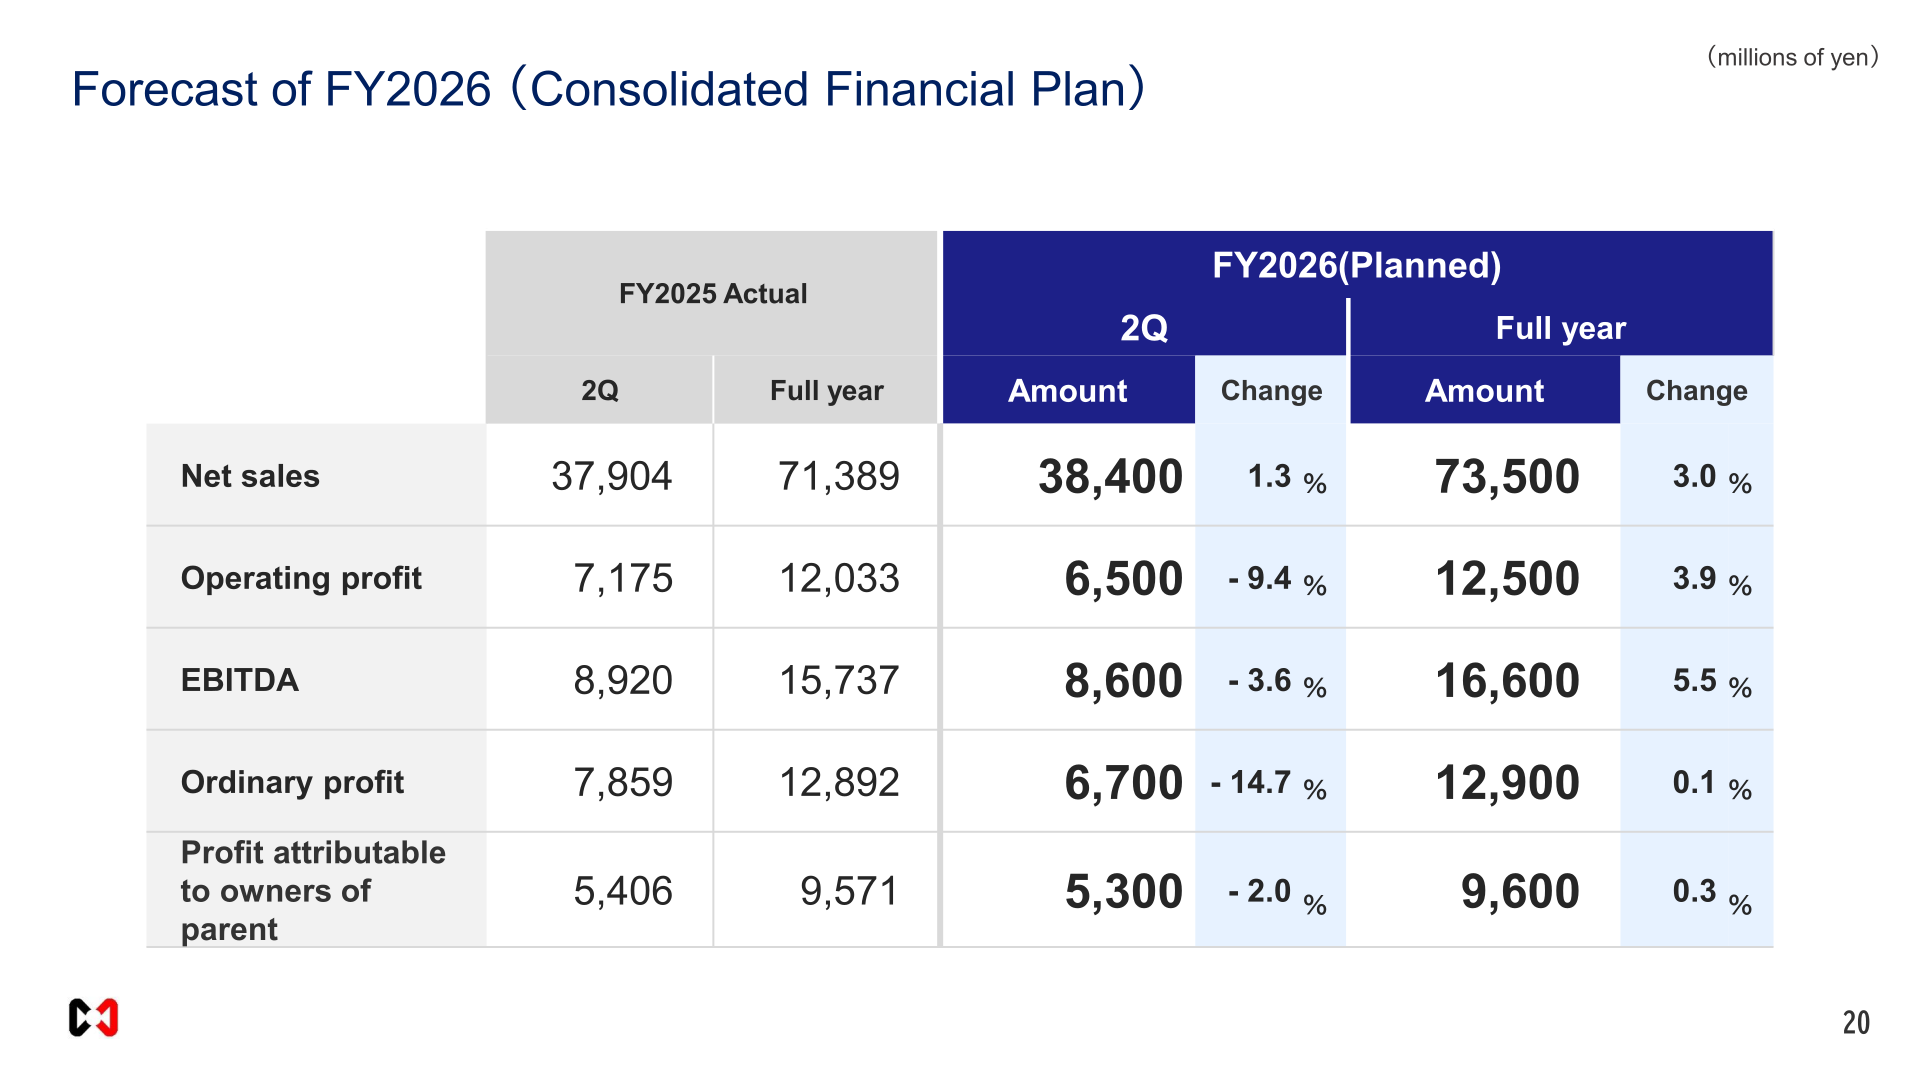
For FY2026 (the final year of the medium-term business plan “GLOBAL VISION ∞ – PART Ⅱ-”), the Company forecasts consolidated net sales of ¥73,500 million (+3.0% year on year), operating profit of ¥12,500 million (+3.9%), EBITDA of ¥16,600 million (+5.5%), ordinary profit of ¥12,900 million (+0.1%), and profit attributable to owners of parent of ¥9,600 million (+0.3%). By segment, the Social Infrastructure Business is expected to post net sales of ¥47,000 million (+0.4%) and operating profit of ¥9,300 million (+5.0%), while the Industrial Infrastructure Business is expected to post net sales of ¥26,500 million (+7.7%) and operating profit of ¥5,000 million (+6.3%); Common (unallocated) operating profit is forecast at -¥1,800 million.
| Item | FY2026 Forecast | FY2025 (Actual) |
|---|---|---|
| Net sales (millions of yen) | 73,500 | 71,389 |
| Operating profit (millions of yen) | 12,500 | 12,033 |
| EBITDA (millions of yen) | 16,600 | 15,737 |
| Ordinary profit (millions of yen) | 12,900 | 12,892 |
| Profit attributable to owners of parent (millions of yen) | 9,600 | 9,571 |
Shareholder Returns
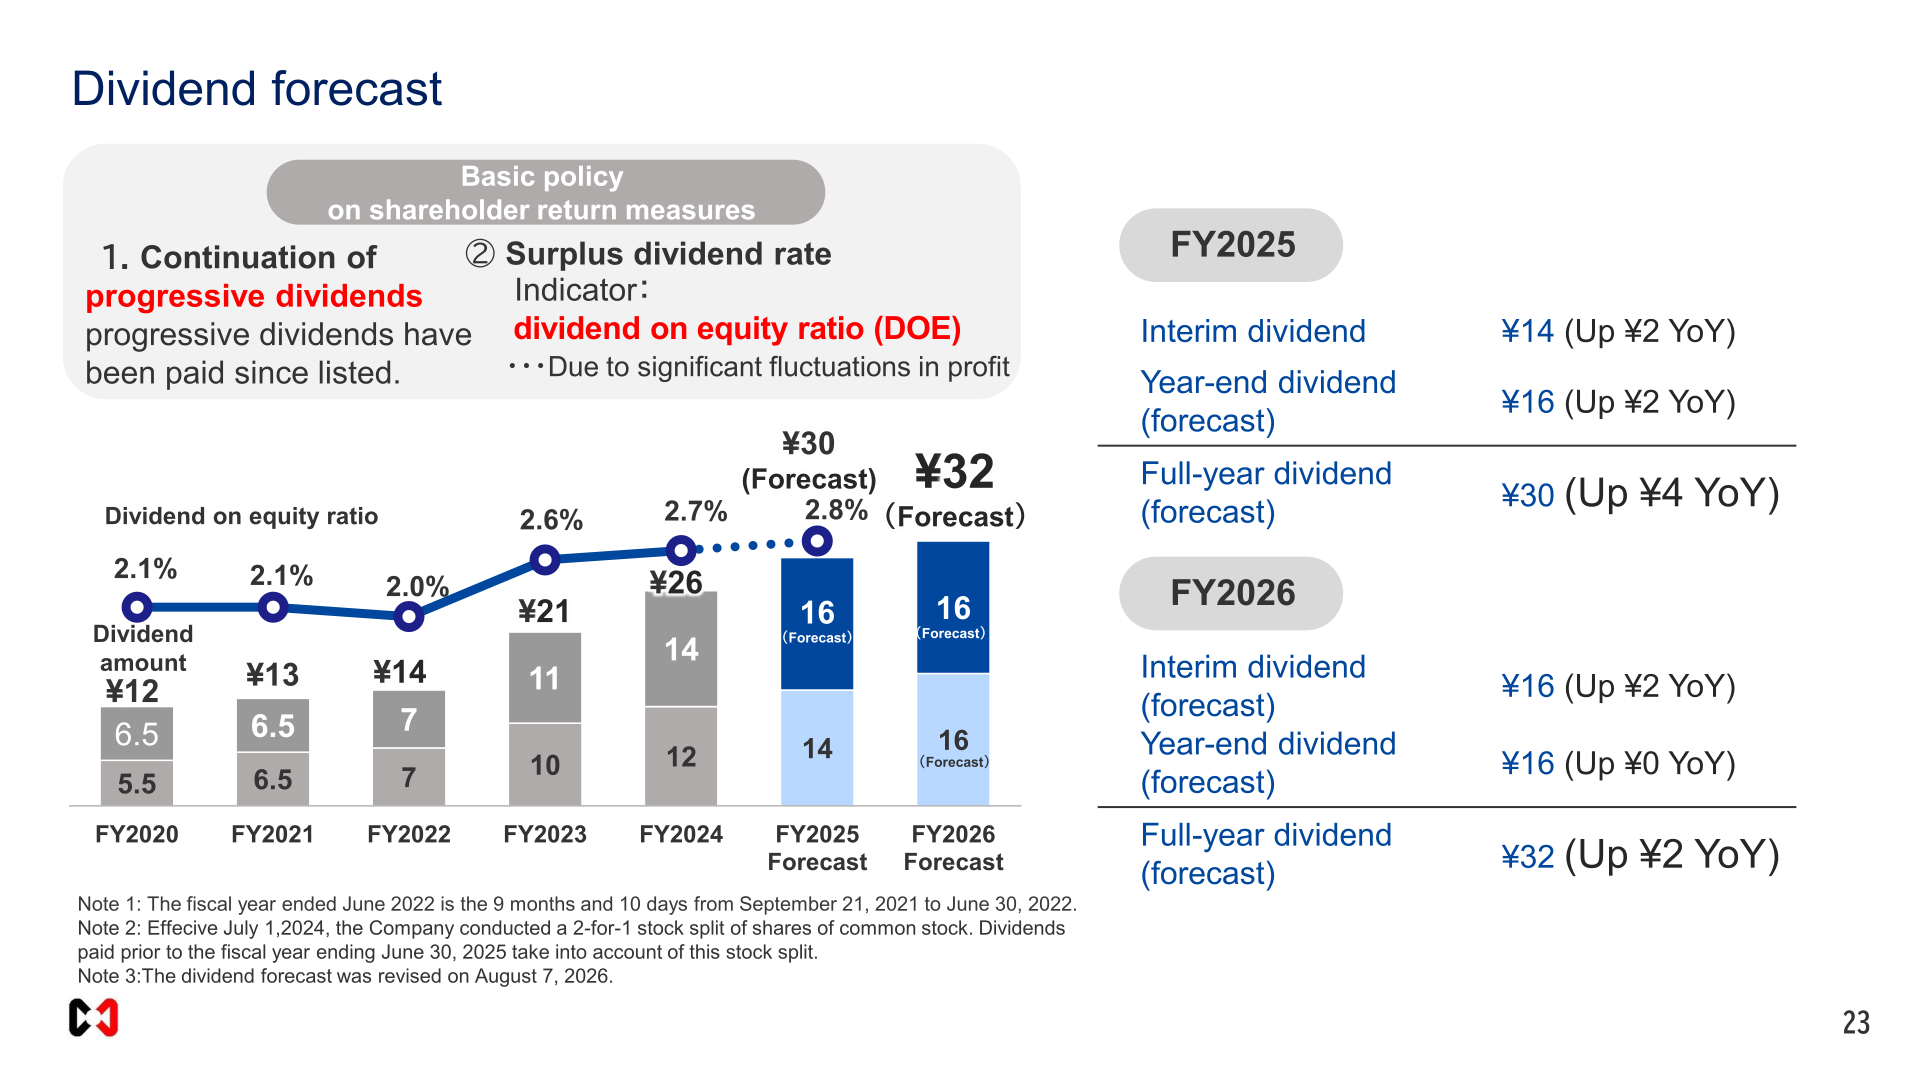
For FY2025 (the fiscal year ended June 30, 2026), the Company paid an interim dividend of ¥14 per share (up ¥2 year on year) and plans a year-end dividend of ¥16 per share (up ¥2), for a full-year dividend of ¥30 per share (up ¥4). For FY2026, the Company forecasts an interim dividend of ¥16 per share (up ¥2) and a year-end dividend of ¥16 per share (unchanged), for a full-year dividend of ¥32 per share (up ¥2). The Company’s basic policy on shareholder returns is continuation of progressive dividends, which have been paid since listing, using the dividend on equity ratio (DOE) as the indicator for the surplus dividend rate given significant fluctuations in profit. Effective July 1, 2024, the Company conducted a 2-for-1 stock split of its common stock; dividends paid prior to the fiscal year ended June 30, 2025 take this stock split into account. The dividend forecast was revised on August 7, 2026.
| Item | FY2025 (Actual/Proposed) | FY2026 (Forecast) |
|---|---|---|
| Interim dividend | ¥14 | ¥16 |
| Year-end dividend | ¥16 | ¥16 |
| Full-year dividend | ¥30 | ¥32 |
Medium-Term Plan / Topics
The current medium-term business plan, “GLOBAL VISION ∞ – PART Ⅱ-,” covers the four-year period from the fiscal year ended June 30, 2024 to the fiscal year ending June 30, 2027. Under the plan, the Company has set a four-year capital investment budget of ¥15,000 million and an M&A investment budget of ¥20,000 million, and targets an overseas sales ratio of 30% by FY2026. The plan’s FY2026 performance targets were revised on August 7, 2026: net sales of ¥73,500 million (initial plan: ¥70,000 million), operating profit of ¥12,500 million (initial plan: ¥12,000 million), EBITDA of ¥16,600 million (initial plan: ¥15,000 million), profit attributable to owners of parent of ¥9,600 million (initial plan: ¥8,000 million), and ROE of 12% (initial plan: 12% or more). As part of its M&A growth strategy, the Company pursues “mix-oriented” M&A with manufacturing companies, aiming to guide growth by combining management resources such as customers, technologies and production while maintaining employment after each acquisition, and is working to enhance its M&A execution capabilities through greater use of AI in the M&A process.
This article is an analysis based on publicly available information and is not a recommendation to buy or sell any specific securities. Investment decisions are your own responsibility.
















