
This article is based on publicly available IR materials and is not a recommendation to buy or sell any specific securities.
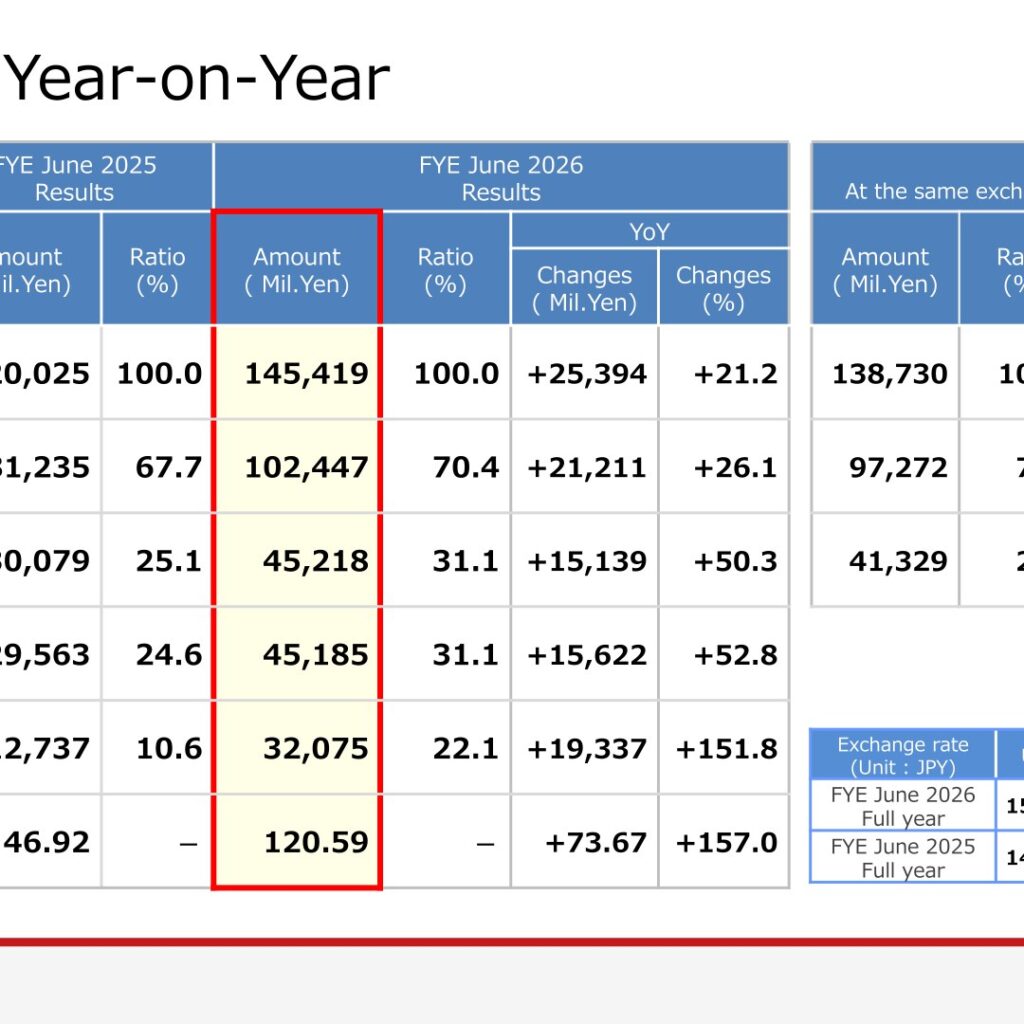
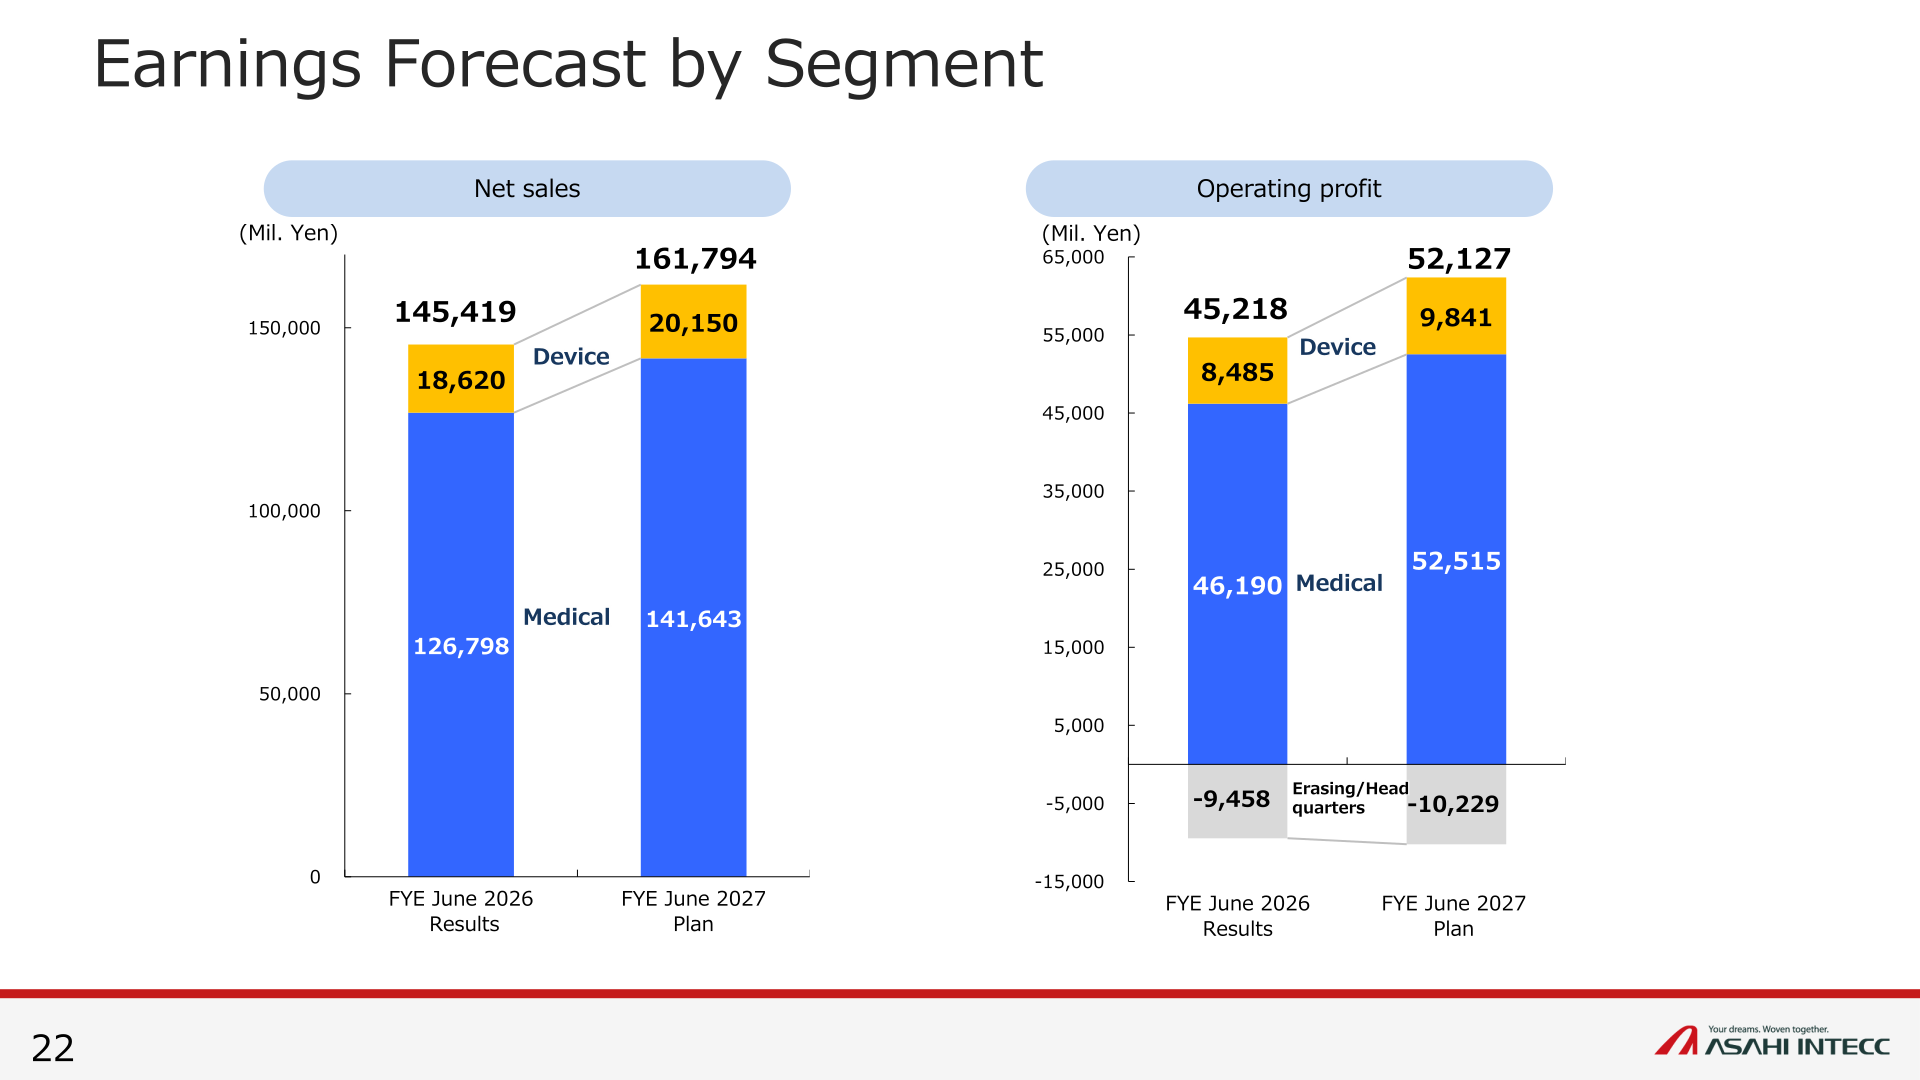
Note: Asahi Intecc closes its books at the end of June, and the company labels the year covered here “FYE June 2026”; this site classifies the most recently completed fiscal year as FY2025, while the text, tables and segment data below keep the company’s own labels. For the fiscal year ended June 2026, Asahi Intecc reported net sales of 145,419 Mil. Yen (YoY +21.2%), operating profit of 45,218 Mil. Yen (YoY +50.3%), ordinary profit of 45,185 Mil. Yen (YoY +52.8%) and net income attributable to parent company shareholders of 32,075 Mil. Yen (YoY +151.8%). Both the Medical Division and the Device Division increased, driven by growing demand as well as the impact of exchange rates, with yen depreciation adding 6,689 Mil. Yen to net sales. For FYE June 2027 the company plans net sales of 161,794 Mil. Yen (YoY +11.3%) and operating profit of 52,127 Mil. Yen (YoY +15.3%).
Consolidated Results (Full-Year Actual)
Gross profit rose to 102,447 Mil. Yen (YoY +26.1%) as the gross profit margin improved from 67.7% to 70.4% on productivity improvement, etc. The materials note that U.S. tariffs increased cost of sales by 1,149 Mil. Yen year on year. SGA expenses increased 6,072 Mil. Yen to 57,228 Mil. Yen (39.4% of sales) on sales-related expenses, R&D expenses and performance-linked bonuses, but the growth rate of SGA expenses remained below the growth rate of net sales. R&D expenses were 13,372 Mil. Yen (YoY +1,124 Mil. Yen, sales ratio 9.2%), while goodwill amortization, etc. decreased 1,137 Mil. Yen. Below the operating line, non-operating income fell 654 Mil. Yen on lower subsidy income and non-operating expenses fell 1,137 Mil. Yen on smaller foreign exchange losses. Net income more than doubled as extraordinary income rose on a gain on sale of investment securities (YoY +1,504 Mil. Yen) and extraordinary loss fell on lower impairment losses (YoY -8,183 Mil. Yen), with extraordinary loss down from 11,031 Mil. Yen to 2,018 Mil. Yen. Results also came in above the revised plan for the year: net sales exceeded the revised plan of 141,142 Mil. Yen by 4,277 Mil. Yen (+3.0%) and operating profit exceeded the revised plan of 42,220 Mil. Yen by 2,998 Mil. Yen (+7.1%). Full-year exchange rates were 154.45 yen to the U.S. dollar, 180.11 yen to the euro, 22.10 yen to the Chinese yuan and 4.80 yen to the Thai baht, against 149.72, 162.83, 20.73 and 4.41 respectively in the prior year.
| Item | FYE June 2026 Results | FYE June 2025 Results | Change (Mil. Yen) | Change (%) |
|---|---|---|---|---|
| Net sales | 145,419 | 120,025 | +25,394 | +21.2 |
| Gross profit | 102,447 | 81,235 | +21,211 | +26.1 |
| Operating profit | 45,218 | 30,079 | +15,139 | +50.3 |
| Ordinary profit | 45,185 | 29,563 | +15,622 | +52.8 |
| Net income attributable to parent company shareholders | 32,075 | 12,737 | +19,337 | +151.8 |
| EPS (yen) | 120.59 | 46.92 | +73.67 | +157.0 |
Segment Results
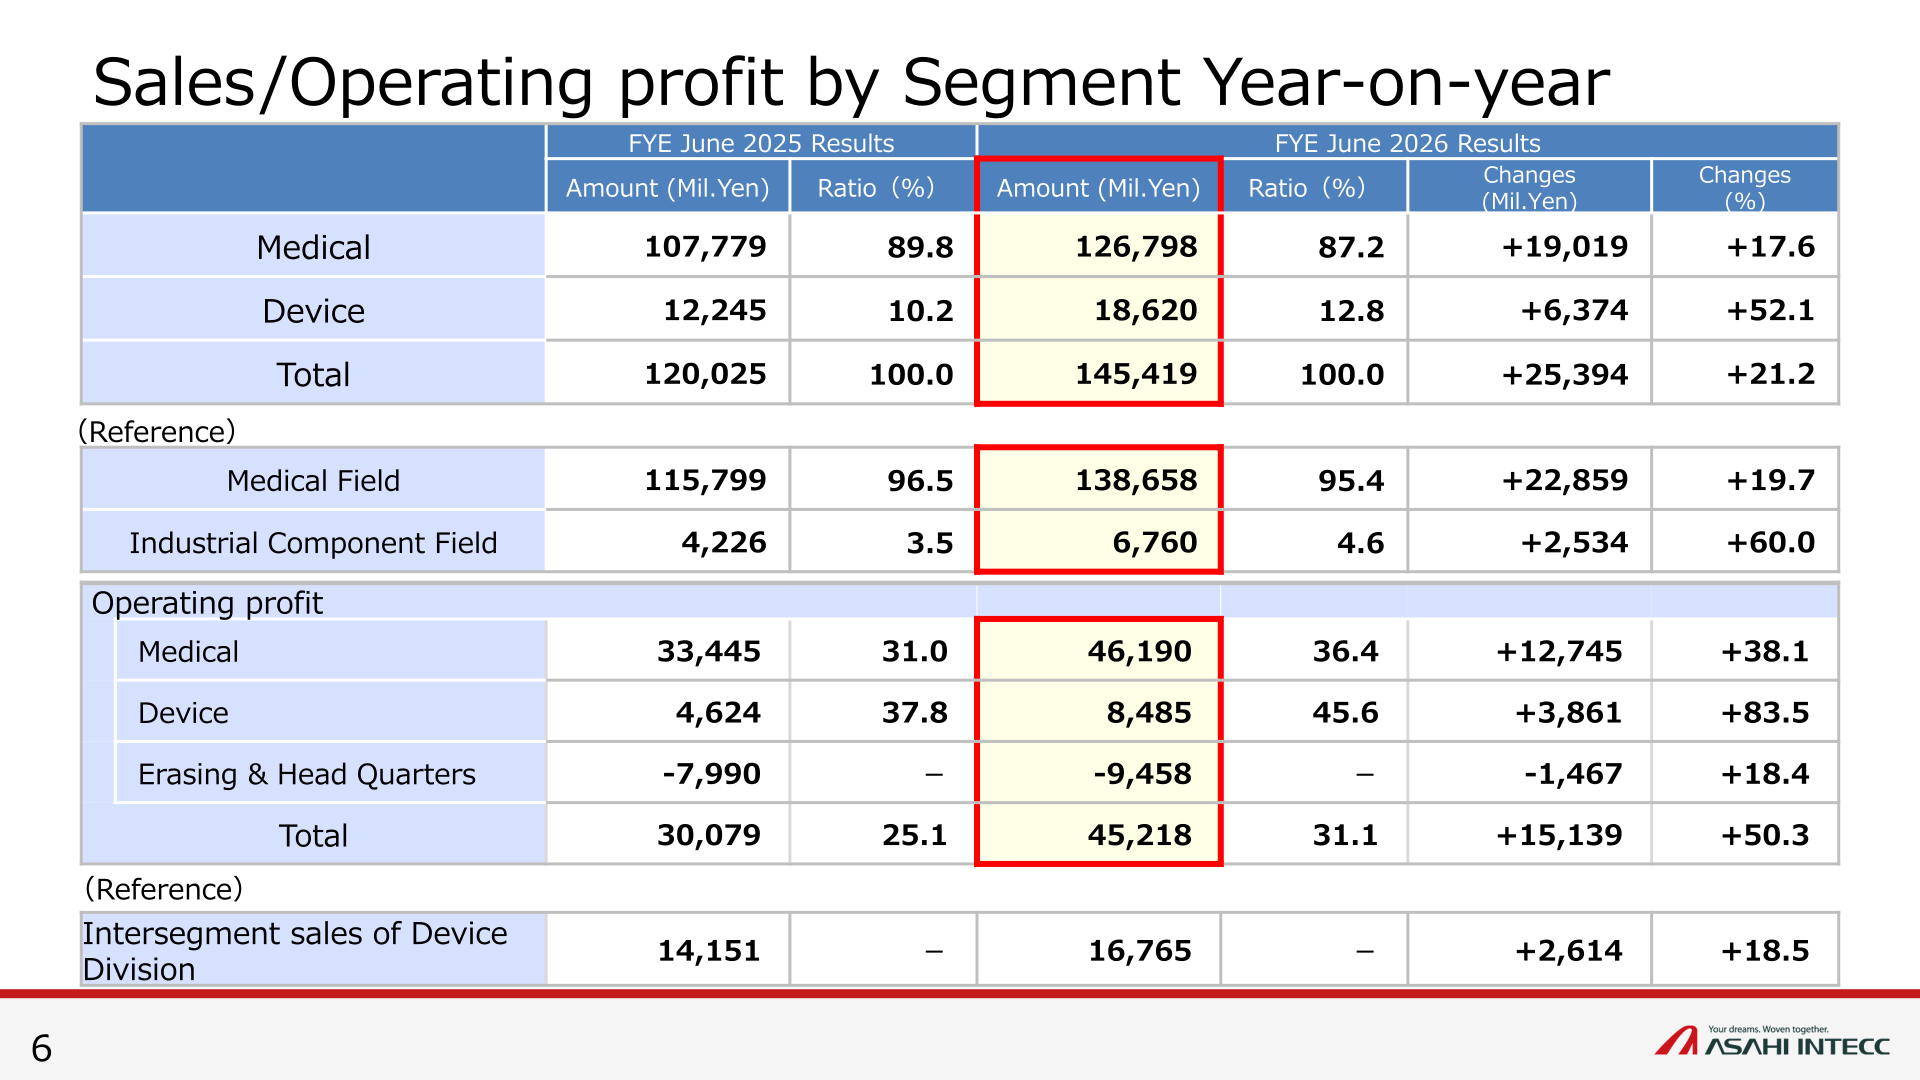
Medical Division net sales were 126,798 Mil. Yen (YoY +17.6%) with operating profit of 46,190 Mil. Yen (YoY +38.1%). In the cardiovascular field, sales increased mainly in PCI GW and penetration catheters in all regions; in the non-cardiovascular field, peripheral (all regions), abdominal (all overseas regions) and neurovascular (overseas regions) progressed favorably. Device Division net sales were 18,620 Mil. Yen (YoY +52.1%) with operating profit of 8,485 Mil. Yen (YoY +83.5%). Within the Device Division, medical components were 11,859 Mil. Yen (YoY +47.9%) on cardiovascular inspection catheter components for the U.S. and cardiovascular ultrasound catheter components for Asian markets, and industrial components were 6,760 Mil. Yen (YoY +60.0%) on overseas leisure-related transactions. The consolidation of Nitta Mold as a subsidiary contributed 2,713 Mil. Yen of the Device Division’s sales increase; excluding that effect, divisional sales still rose 3,660 Mil. Yen (+29.9%). Intersegment sales of the Device Division were 16,765 Mil. Yen (YoY +18.5%).
| Segment | Metric | FYE June 2026 Results | FYE June 2025 Results | Change (%) |
|---|---|---|---|---|
| Medical | Net sales | 126,798 | 107,779 | +17.6 |
| Device | Net sales | 18,620 | 12,245 | +52.1 |
| Total | Net sales | 145,419 | 120,025 | +21.2 |
| Medical | Operating profit | 46,190 | 33,445 | +38.1 |
| Device | Operating profit | 8,485 | 4,624 | +83.5 |
| Erasing & Head Quarters | Operating profit | -9,458 | -7,990 | +18.4 |
| Total | Operating profit | 45,218 | 30,079 | +50.3 |
Medical Division by Region and Treatment Area
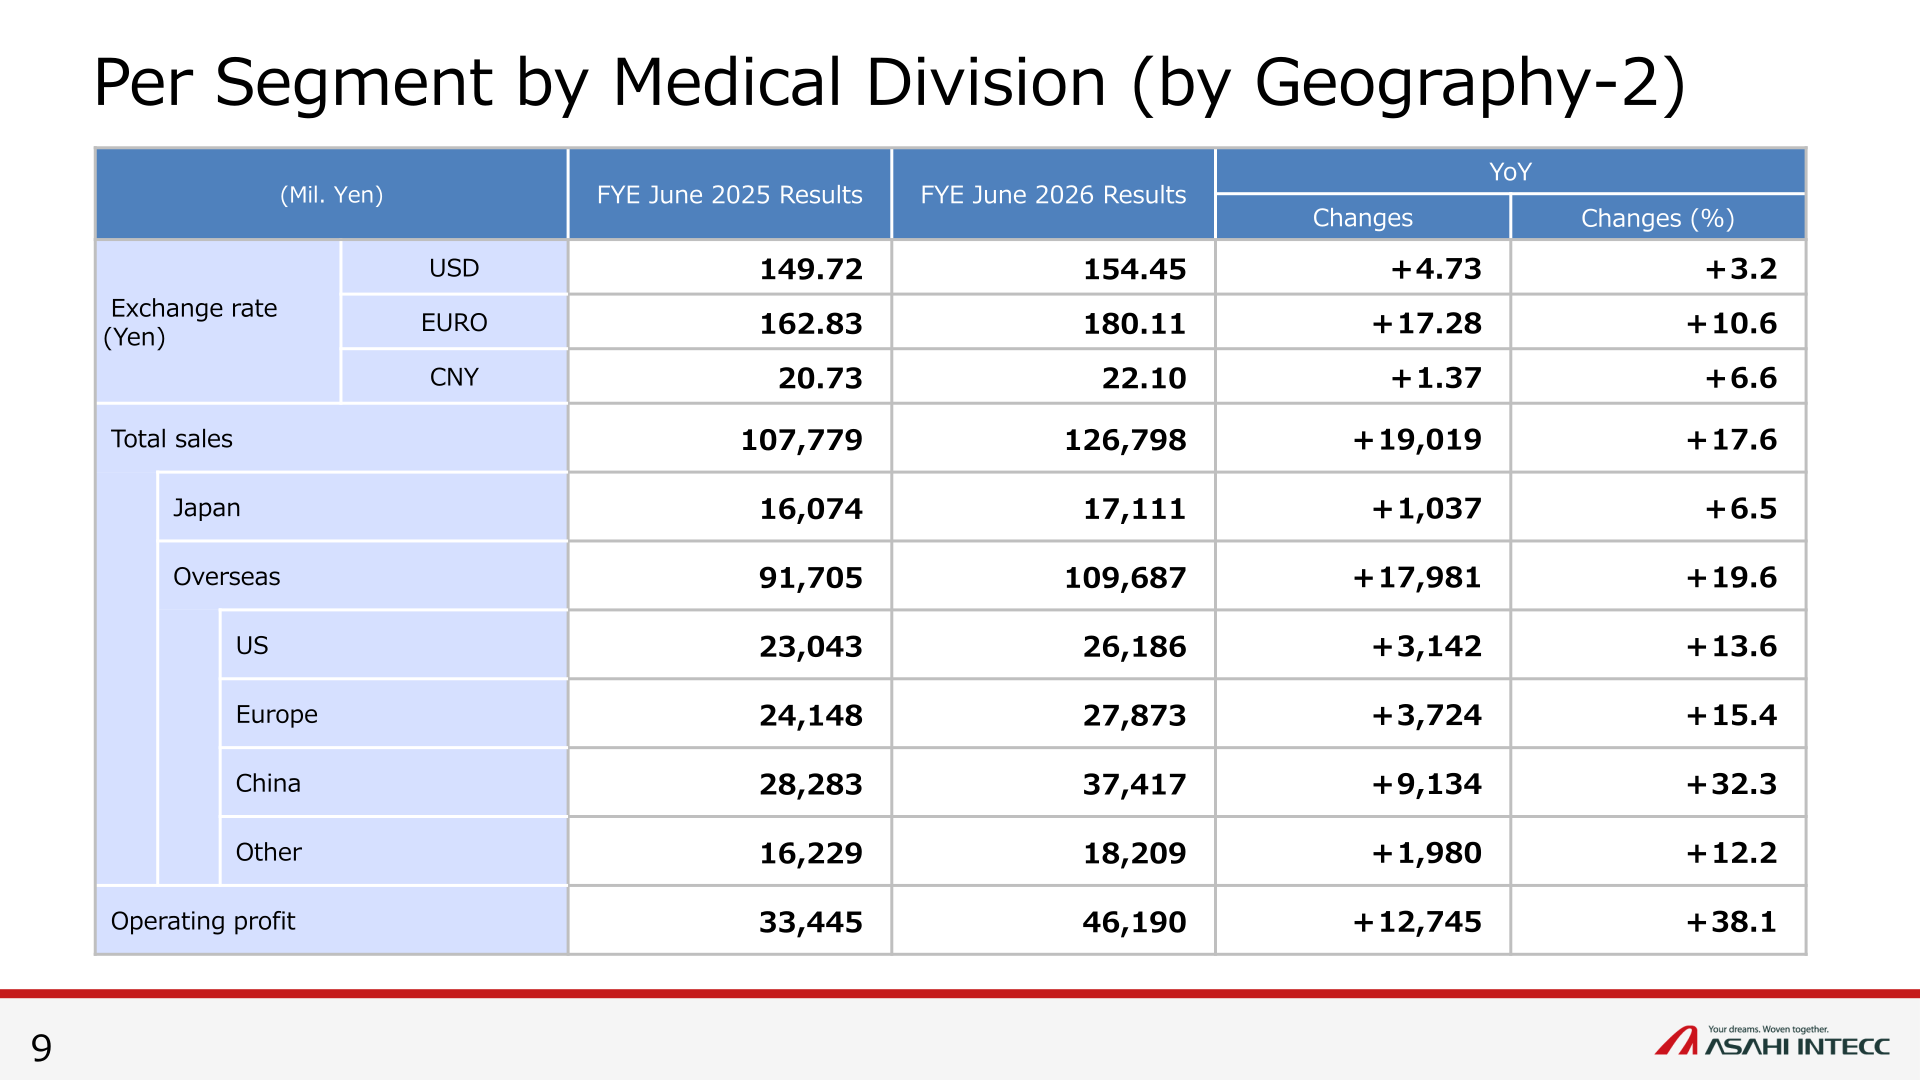
Medical Division sales remained steady in all regions with positive effects from exchange rates. Japan grew 6.5% to 17,111 Mil. Yen on the non-cardiovascular field, where purchased products in peripheral vascular (Penumbra) and peripheral guidewires sold strongly, while the cardiovascular field was flat as gains in PCI GW and penetration catheters were offset by lower sales of products for inspection following the discontinuation of low-profit products. Overseas sales rose 19.6% to 109,687 Mil. Yen. China was the largest contributor at 37,417 Mil. Yen (YoY +32.3%, +24.1% after considering forex impact), reflecting a high market growth rate, an expansion of market share and a decline in inflows from other regions. Europe reached 27,873 Mil. Yen (YoY +15.4%, +4.5% after considering forex impact) on increases in both direct sales and distributor transactions in Western Europe, and the U.S. reached 26,186 Mil. Yen (YoY +13.6%) on the brand products business. By treatment area, cardiovascular sales were 94,778 Mil. Yen (YoY +16.7%), non-cardiovascular sales 24,370 Mil. Yen (YoY +28.4%) and OEM 7,650 Mil. Yen (YoY +0.7%).
| Medical Division | FYE June 2026 Results | FYE June 2025 Results | Change (Mil. Yen) | Change (%) |
|---|---|---|---|---|
| Total sales | 126,798 | 107,779 | +19,019 | +17.6 |
| Japan | 17,111 | 16,074 | +1,037 | +6.5 |
| Overseas | 109,687 | 91,705 | +17,981 | +19.6 |
| US | 26,186 | 23,043 | +3,142 | +13.6 |
| Europe | 27,873 | 24,148 | +3,724 | +15.4 |
| China | 37,417 | 28,283 | +9,134 | +32.3 |
| Other | 18,209 | 16,229 | +1,980 | +12.2 |
| Cardiovascular | 94,778 | 81,202 | +13,576 | +16.7 |
| Non-Cardiovascular | 24,370 | 18,983 | +5,386 | +28.4 |
| OEM | 7,650 | 7,593 | +56 | +0.7 |
| Operating profit | 46,190 | 33,445 | +12,745 | +38.1 |
FYE June 2027 Forecast
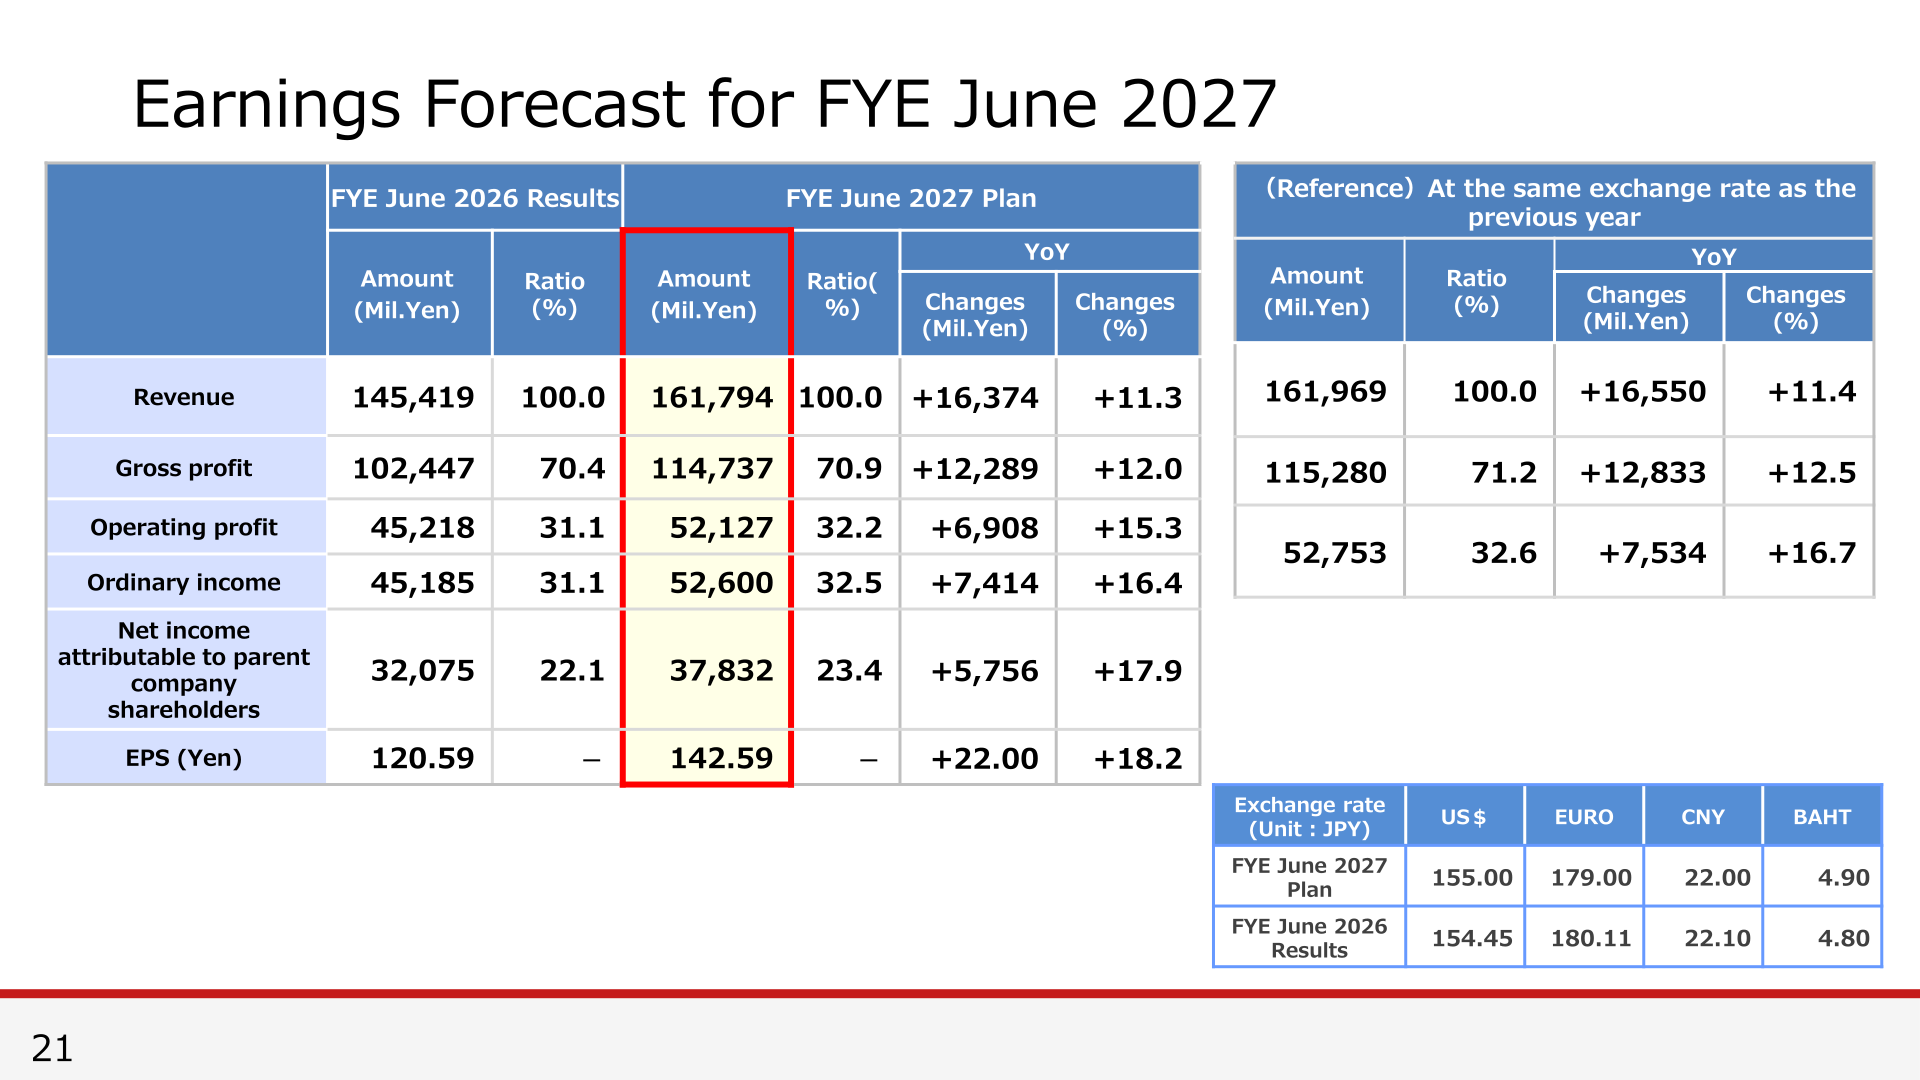
For the fiscal year ending June 2027, the company expects increases in both the Medical and Device divisions supported by expanding demand centered in overseas markets. Net sales are expected to reach 161,794 Mil. Yen (YoY +11.3%; +11.4% at the same exchange rate as the previous year, with assumed exchange rate trends reducing net sales by 175 million yen). Gross profit is planned at 114,737 Mil. Yen (YoY +12.0%) with the gross profit margin rising from 70.4% to 70.9% on continued productivity improvement despite rising raw material prices. SGA expenses are planned at 62,609 Mil. Yen (YoY +9.4%), including R&D expenses of 15,239 Mil. Yen (sales ratio 9.4%) and expenses associated with preparations for the start-up of the Nanning factory in China, where production is to begin in 2030. Assumed rates for the plan are 155.00 yen to the U.S. dollar, 179.00 yen to the euro, 22.00 yen to the Chinese yuan and 4.90 yen to the Thai baht. By segment, the plan calls for Medical net sales of 141,643 Mil. Yen and Device net sales of 20,150 Mil. Yen, with operating profit of 52,515 Mil. Yen for Medical, 9,841 Mil. Yen for Device and -10,229 Mil. Yen for erasing/head quarters.
| Item | FYE June 2027 Plan | FYE June 2026 Results | Change (Mil. Yen) | Change (%) |
|---|---|---|---|---|
| Revenue | 161,794 | 145,419 | +16,374 | +11.3 |
| Gross profit | 114,737 | 102,447 | +12,289 | +12.0 |
| Operating profit | 52,127 | 45,218 | +6,908 | +15.3 |
| Ordinary income | 52,600 | 45,185 | +7,414 | +16.4 |
| Net income attributable to parent company shareholders | 37,832 | 32,075 | +5,756 | +17.9 |
| EPS (Yen) | 142.59 | 120.59 | +22.00 | +18.2 |
Shareholder Returns
The presentation does not contain a dividend policy slide or a dividend-per-share figure, so the dividend per share and the shareholder return policy cannot be confirmed from the materials. The cash flow reference slide shows that within financing activities of -19,971 Mil. Yen for FYE June 2026, the purchase of treasury shares was -10,553 Mil. Yen and cash dividends paid were -6,534 Mil. Yen. On the balance sheet, total net assets rose 23,004 Mil. Yen to 174,358 Mil. Yen, with retained earnings up 13,487 Mil. Yen, foreign currency translation adjustment up 7,285 Mil. Yen, treasury shares up 4,434 Mil. Yen and capital surplus down 2,907 Mil. Yen. Cash and cash equivalents increased from 53,200 Mil. Yen to 64,264 Mil. Yen, with operating activities providing 40,095 Mil. Yen and investing activities using 11,739 Mil. Yen.
R&D and Capital Expenditure
The company describes its R&D stance as continuing aggressive investment, with criteria of an R&D-to-sales ratio upper limit of 12% and a mid-term plan level of 11%. R&D expenses were 13,372 Mil. Yen in FYE June 2026 (9.2% of sales) and are planned at 15,239 Mil. Yen in FYE June 2027 (9.4% of sales); the materials note that because a high proportion of sales is denominated in foreign currencies while the majority of R&D expenses are denominated in yen, this ratio tends to be lower when the yen weakens. The transfer of operations to the Thai plant is being implemented in phases and is progressing smoothly. On capital expenditure, the company states that investment in the Chinese factory is expected to largely wrap up in the next fiscal year and that regular investment is also showing signs of being curtailed.
This article is an analysis based on publicly available information and is not a recommendation to buy or sell any specific securities. Investment decisions are your own responsibility.
![[Obayashi] Investors’ Guide 2026 — The Complete 24-Article Breakdown](https://japan-equity.com/wp-content/uploads/2026/07/hub_cover-1024x1024.png)
![[Obayashi] IR & SR Policy — Feeding Dialogue Back into Management](https://japan-equity.com/wp-content/uploads/2026/07/p32_sq-1024x1024.jpg)
![[Obayashi] Real Estate Development — 18.7% Margin, ¥287.7bn Unrealized Gains](https://japan-equity.com/wp-content/uploads/2026/07/p20_sq-1024x1024.jpg)
![[Obayashi] Domestic Civil Engineering — Resilience Spending Supports 9.6% Margin](https://japan-equity.com/wp-content/uploads/2026/07/p11_sq-1024x1024.jpg)
![[Obayashi] Share Price & External Ratings — vs TOPIX, ESG Index Inclusion](https://japan-equity.com/wp-content/uploads/2026/07/p40_sq-1024x1024.jpg)
![[Construction] ¥75.5tn Investment, Shrinking Workforce — Big-5 Market Share](https://japan-equity.com/wp-content/uploads/2026/07/p12_sq-1024x1024.jpg)



![[Obayashi] Capital Policy & Shareholder Returns — ROE 10%+, DOE ~5%, ¥100bn Buyback](https://japan-equity.com/wp-content/uploads/2026/07/p27_sq-1024x1024.jpg)
![[Obayashi] Reducing Cross-Shareholdings — ¥285.2bn Sold in Five Years](https://japan-equity.com/wp-content/uploads/2026/07/p29_sq-1024x1024.jpg)
![[Obayashi] ¥750bn Investment Plan — ¥300bn to Development, ¥190bn to Tech/DX](https://japan-equity.com/wp-content/uploads/2026/07/p30_sq-1024x1024.jpg)
![[Obayashi] MTP2022 KPIs — Operating Profit ~2x Target, ROE 14.4%](https://japan-equity.com/wp-content/uploads/2026/07/p25_sq-1024x1024.jpg)
![[Obayashi] Cash Allocation — ¥420bn Investment CF Over Five Years](https://japan-equity.com/wp-content/uploads/2026/07/p26_sq-1024x1024.jpg)
![[Obayashi] Green Energy — 44 Plants, 344MW, and the Green Hydrogen Challenge](https://japan-equity.com/wp-content/uploads/2026/07/p21_sq-1024x1024.jpg)
![[Obayashi] Tackling the Labor Shortage — Robotics Construction®](https://japan-equity.com/wp-content/uploads/2026/07/p14_sq-1024x1024.jpg)
