
This article is based on publicly available IR materials and is not a recommendation to buy or sell any specific securities.
Note: Hakudo Co., Ltd. labels the fiscal year ended March 31, 2026 as FY03/26 and the following year as FY03/27; this article follows our site convention of classifying the most recently completed fiscal year as FY2025, while all figures, tables, headers and labels below are kept exactly as presented in the company’s materials.
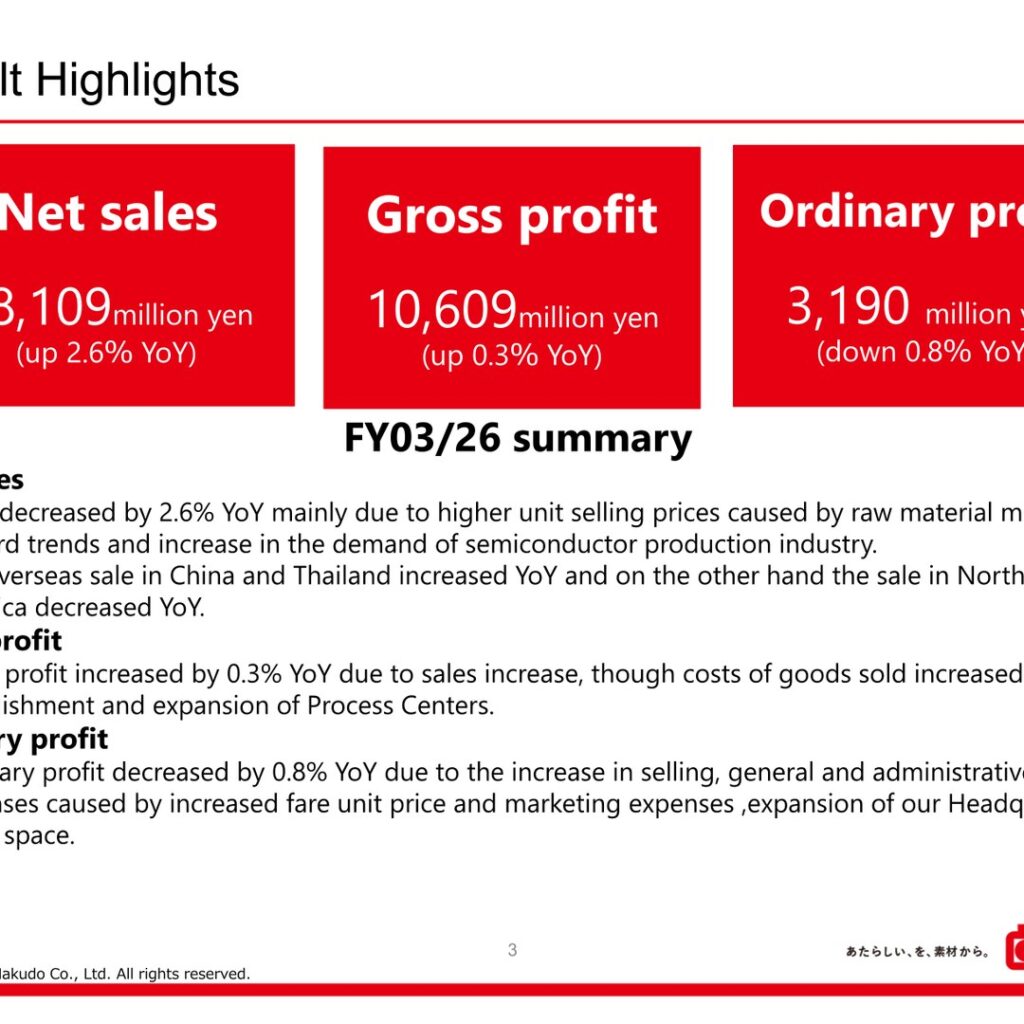
Hakudo Co., Ltd., a processor and distributor of aluminum, copper, stainless steel and other metal products, reported consolidated net sales of 68,109 million yen for the fiscal year ended March 31, 2026 (FY03/26), up 2.6% year on year, driven by higher unit selling prices amid rising raw material markets and increased demand from the semiconductor production equipment industry. Gross profit rose 0.3% to 10,609 million yen. Ordinary profit declined 0.8% to 3,190 million yen, as an increase in selling, general and administrative expenses caused by higher fare unit prices, marketing expenses and expansion of the company’s head office space offset the gains in gross profit. Profit attributable to owners of parent decreased 4.1% to 2,146 million yen.
Consolidated Results (Full-Year Actual)
Net sales increased due to higher unit selling prices for both standard stock items and special-order items, reflecting raw material market upward trends; overseas sales in China and Thailand increased year on year while sales in North America decreased. Gross profit increased on higher sales, although cost of goods sold rose due to the new establishment and expansion of Process Centers. Ordinary profit (excluding inventory revaluation impact) was 2,778 million yen, down 2.0% year on year.
| Item | FY03/26 | FY03/25 | YoY Change (Amount) | YoY Change (Rate) |
|---|---|---|---|---|
| Net sales | 68,109 | 66,410 | +1,699 | +2.6% |
| Gross profit | 10,609 | 10,573 | +36 | +0.3% |
| Operating profit | 2,872 | 2,983 | △111 | △3.7% |
| Ordinary profit | 3,190 | 3,214 | △24 | △0.8% |
| Ordinary profit (excluding inventory revaluation impact) | 2,778 | 2,836 | △57 | △2.0% |
| Profit attributable to owners of parent | 2,146 | 2,236 | △90 | △4.1% |
By product category, consolidated net sales of copper and aluminum products increased year on year on higher unit selling prices thanks to raw material market upward trends, while sales of stainless steel and others were roughly flat.
| Product Category | FY03/26 | FY03/25 | YoY |
|---|---|---|---|
| Consolidated net sales | 68,109 | 66,410 | +2.6% |
| Aluminum | 41,833 | 40,814 | +2.5% |
| Copper | 10,261 | 9,502 | +8.0% |
| Stainless steel | 12,535 | 12,604 | △0.5% |
| Others | 3,479 | 3,488 | △0.3% |
Segment Results
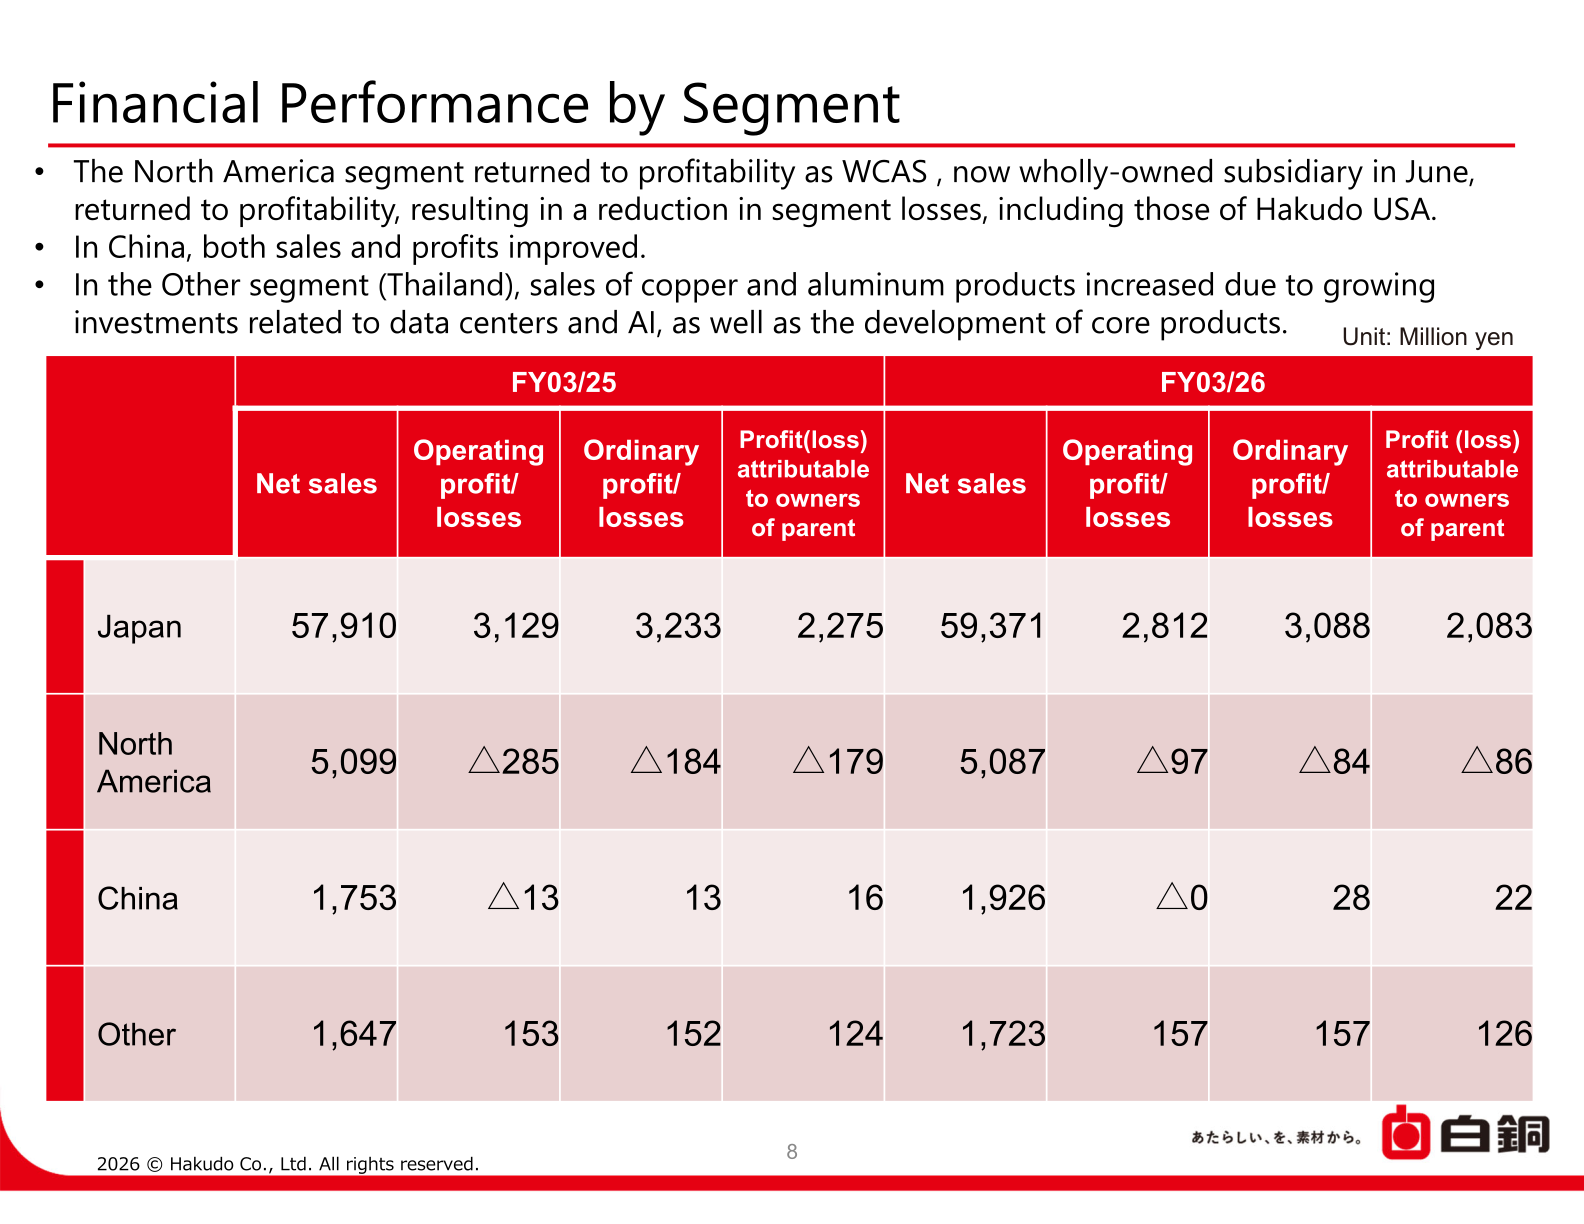
The North America segment returned to profitability, as WCAS, which became a wholly-owned subsidiary in June, returned to profitability, reducing segment losses including those of Hakudo USA. In China, both sales and profits improved. In the Other segment (Thailand), sales of copper and aluminum products increased due to growing investments related to data centers and AI, as well as the development of core products.
| Segment | Metric | FY03/26 | FY03/25 |
|---|---|---|---|
| Japan | Net sales | 59,371 | 57,910 |
| Japan | Operating profit | 2,812 | 3,129 |
| Japan | Ordinary profit | 3,088 | 3,233 |
| Japan | Profit attributable to owners of parent | 2,083 | 2,275 |
| North America | Net sales | 5,087 | 5,099 |
| North America | Operating profit (loss) | △97 | △285 |
| North America | Ordinary profit (loss) | △84 | △184 |
| North America | Profit (loss) attributable to owners of parent | △86 | △179 |
| China | Net sales | 1,926 | 1,753 |
| China | Operating profit (loss) | △0 | △13 |
| China | Ordinary profit | 28 | 13 |
| China | Profit attributable to owners of parent | 22 | 16 |
| Other | Net sales | 1,723 | 1,647 |
| Other | Operating profit | 157 | 153 |
| Other | Ordinary profit | 157 | 152 |
| Other | Profit attributable to owners of parent | 126 | 124 |
FY2026 Forecast
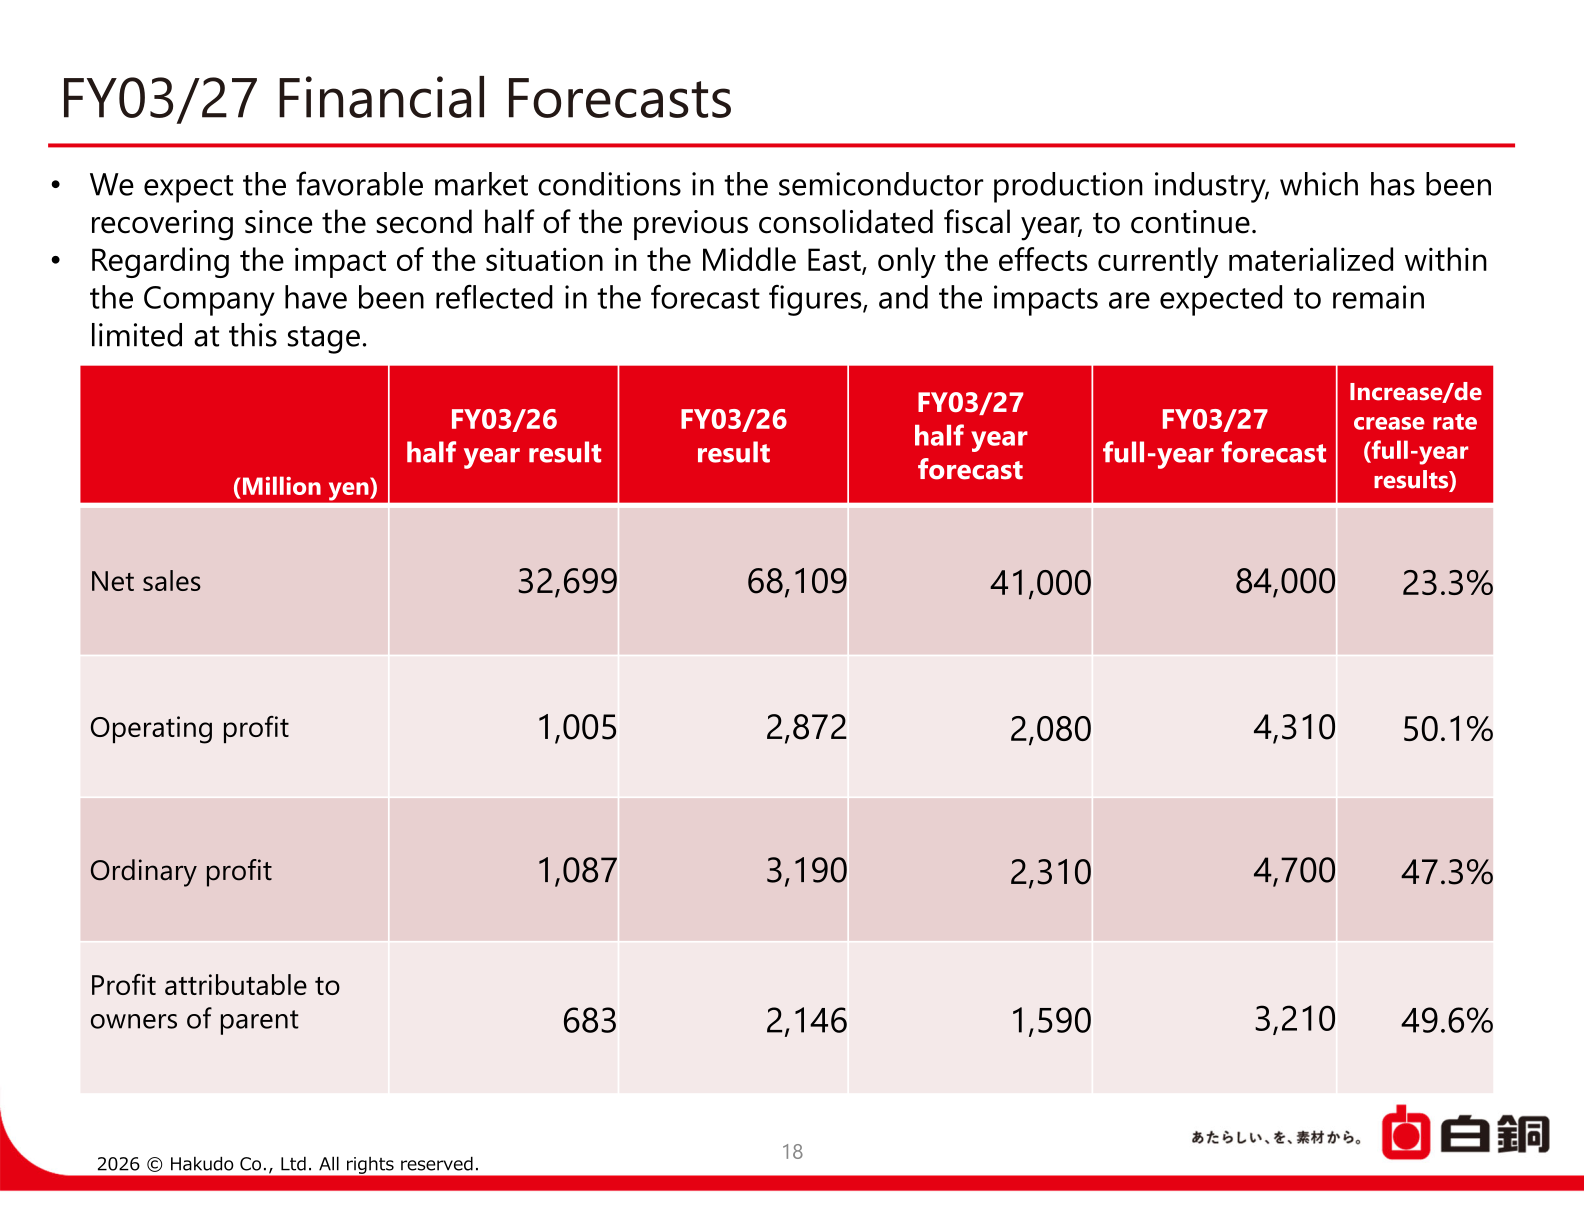
Hakudo expects favorable market conditions in the semiconductor production equipment industry, which has been recovering since the second half of FY03/26, to continue. Regarding the situation in the Middle East, only effects already materialized within the company have been reflected in the forecast figures, and the impact is expected to remain limited at this stage.
| Item | FY03/27 Full-Year Forecast | FY03/26 Result | Increase/Decrease Rate (Full-Year) |
|---|---|---|---|
| Net sales | 84,000 | 68,109 | 23.3% |
| Operating profit | 4,310 | 2,872 | 50.1% |
| Ordinary profit | 4,700 | 3,190 | 47.3% |
| Profit attributable to owners of parent | 3,210 | 2,146 | 49.6% |
Shareholder Returns
Hakudo’s dividend policy is to pay a dividend payout ratio of 45% or more for the full year, with a minimum annual dividend of 80 yen per share; in principle, whichever is higher shall be the dividend amount. For FY03/26, the dividend was 86 yen per share against a medium-term management plan goal of 94 yen per share (a shortfall of 8 yen), with a dividend payout ratio of 45%, in line with the plan’s 45% target.
Medium-Term Plan / Topics
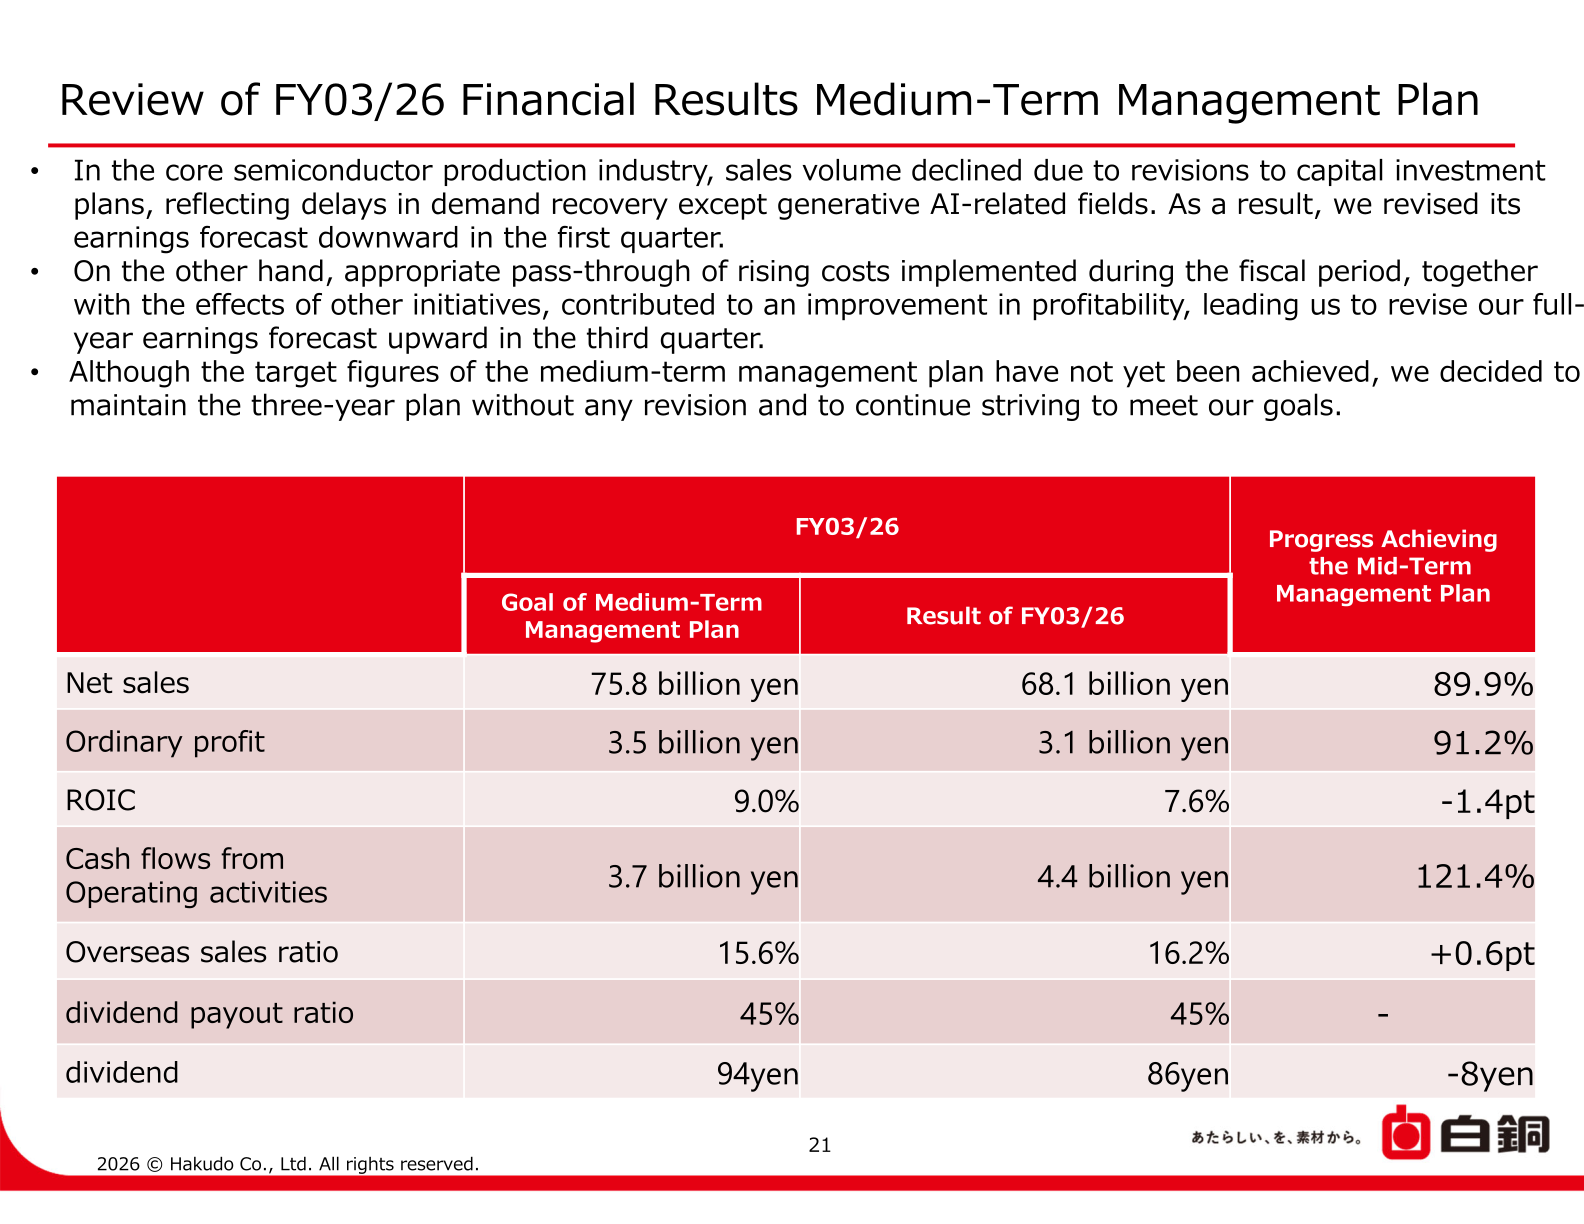
In its review of FY03/26 results against the medium-term management plan, Hakudo noted that sales volume in the core semiconductor production industry declined due to revisions to capital investment plans, reflecting delays in demand recovery outside generative AI-related fields, leading to a downward revision of the earnings forecast in the first quarter. Appropriate pass-through of rising costs during the fiscal period, together with other initiatives, then contributed to an improvement in profitability, leading to an upward revision of the full-year earnings forecast in the third quarter. Although the target figures of the medium-term management plan have not yet been achieved, the company decided to maintain the three-year plan without revision and continue striving to meet its goals.
| Item | Result of FY03/26 | Goal of Medium-Term Management Plan | Progress |
|---|---|---|---|
| Net sales | 68.1 billion yen | 75.8 billion yen | 89.9% |
| Ordinary profit | 3.1 billion yen | 3.5 billion yen | 91.2% |
| ROIC | 7.6% | 9.0% | -1.4pt |
| Cash flows from operating activities | 4.4 billion yen | 3.7 billion yen | 121.4% |
| Overseas sales ratio | 16.2% | 15.6% | +0.6pt |
| Dividend payout ratio | 45% | 45% | – |
| Dividend | 86 yen | 94 yen | -8 yen |
This article is an analysis based on publicly available information and is not a recommendation to buy or sell any specific securities. Investment decisions are your own responsibility.
















