
This article is based on publicly available IR materials and is not a recommendation to buy or sell any specific securities.
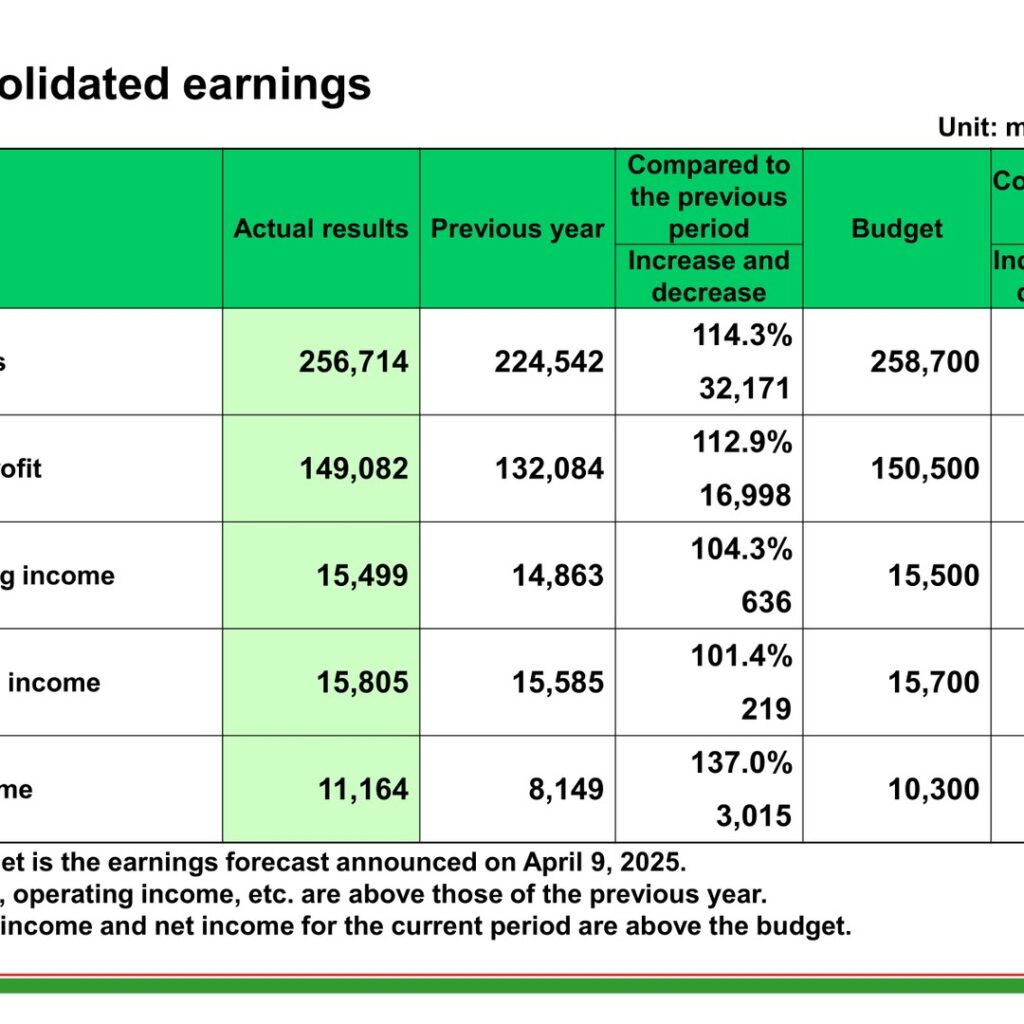
Saizeriya Co., Ltd. released its Financial Results Briefing Materials for the fiscal year ending August 31, 2025 (the 53rd fiscal year, from September 1, 2024 to August 31, 2025). Consolidated net sales were 256,714 million yen, or 114.3% of the previous year, and operating income was 15,499 million yen, or 104.3%. Ordinary income was 15,805 million yen and net income was 11,164 million yen, or 137.0% of the previous year. The materials state that net sales, operating income, etc. are above those of the previous year, and that ordinary income and net income for the current period are above the budget. Note: the company’s fiscal year ends in August, so the figures below follow the presentation’s own “Q4/2025” (fiscal year ended August 31, 2025) labelling.
Consolidated Results (Full-Year Actual)
Amounts are in millions of yen, as presented. The budget column is the earnings forecast announced on April 9, 2025. Amounts less than one million yen have been discarded.
| Item (million yen) | FY2025 (Actual) | Previous year | Compared to the previous period | Budget | Compared to budget |
|---|---|---|---|---|---|
| Net sales | 256,714 | 224,542 | 114.3% | 258,700 | 99.2% |
| Gross profit | 149,082 | 132,084 | 112.9% | 150,500 | 99.1% |
| Operating income | 15,499 | 14,863 | 104.3% | 15,500 | 100.0% |
| Ordinary income | 15,805 | 15,585 | 101.4% | 15,700 | 100.7% |
| Net income | 11,164 | 8,149 | 137.0% | 10,300 | 108.4% |
On a sales-ratio basis, the cost of sales ratio was 41.9% against 41.2% a year earlier (up 0.7 percent), the selling, general and administrative expenses ratio was 52.0% against 52.2% (down 0.2 percent), and the operating income ratio was 6.0% against 6.6% (down 0.6 percent). The net income ratio was 4.3% against 3.6%. On a non-consolidated basis, net sales were 172,908 million yen (118.1% of the previous year), operating income was 5,033 million yen (183.9%), ordinary income was 9,886 million yen (62.4%) and net income was 7,397 million yen (58.6%).
Segment Results
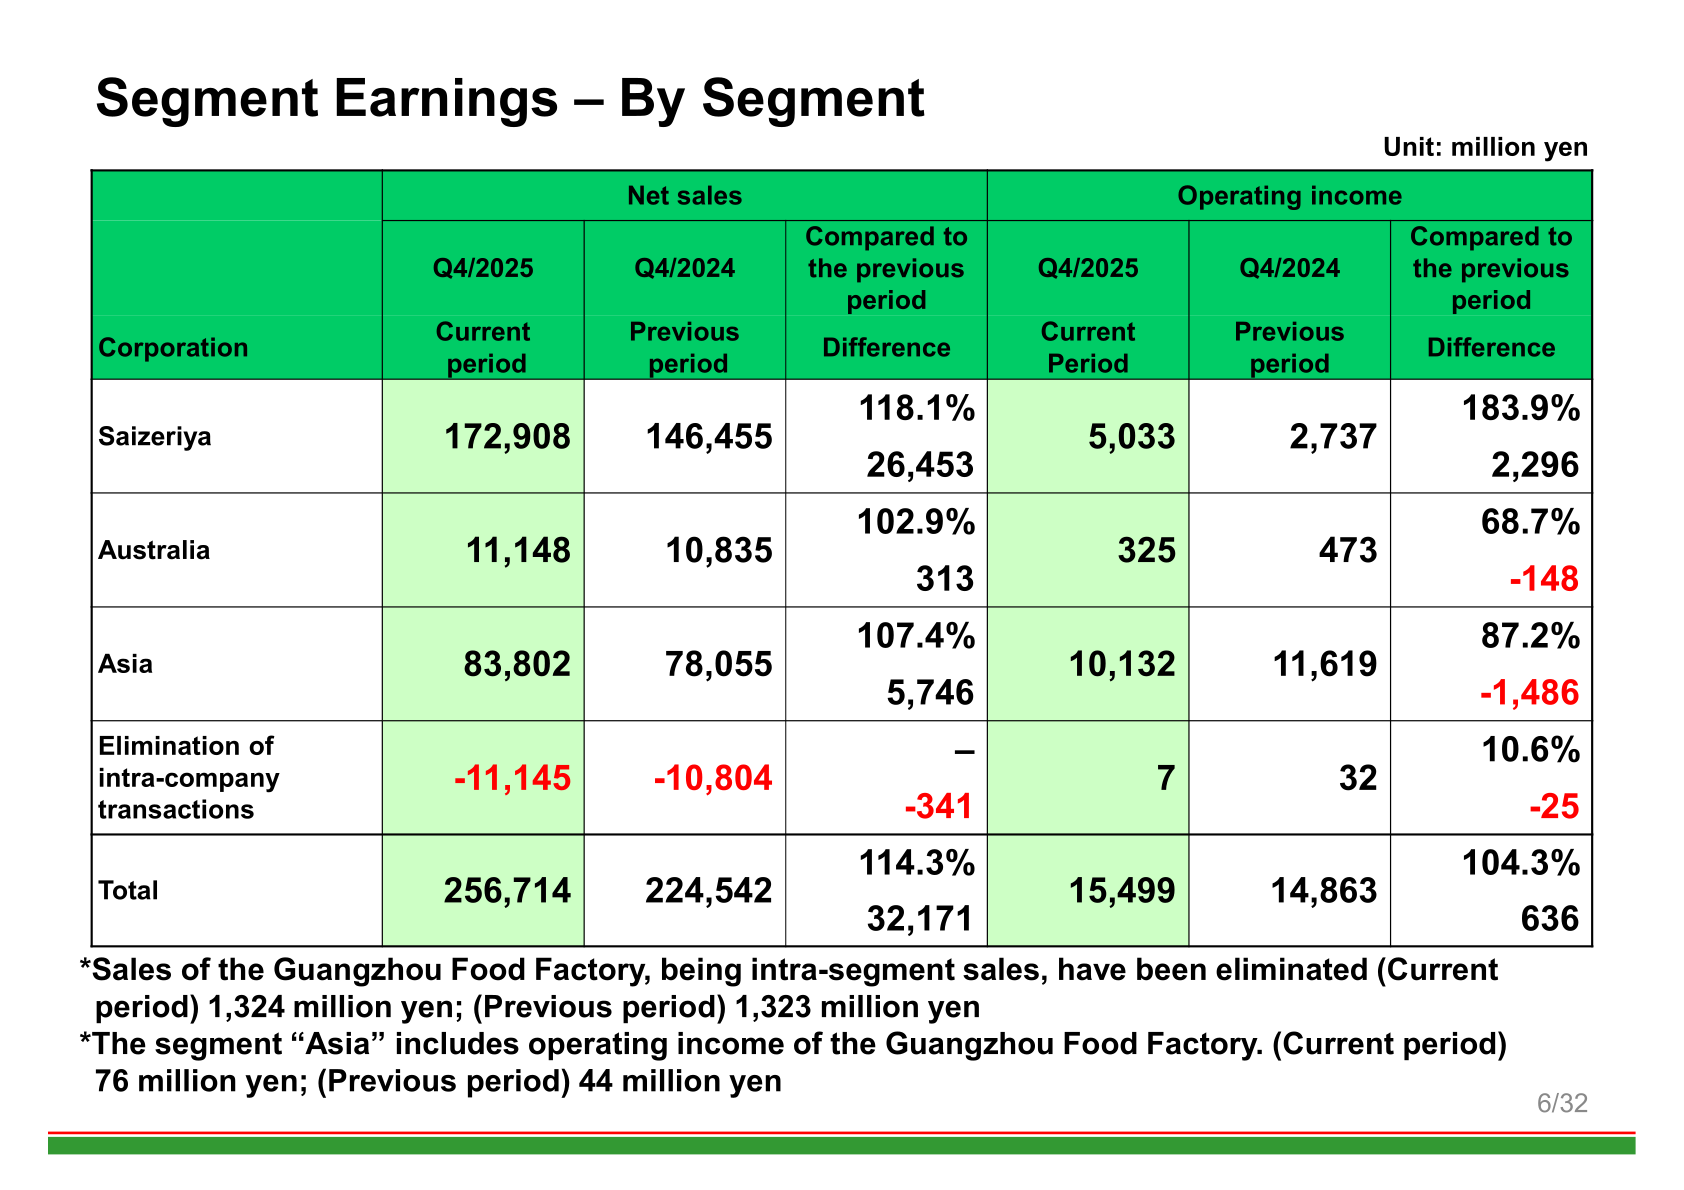
By segment, the Saizeriya (domestic) segment posted net sales of 172,908 million yen (118.1% of the previous year) and operating income of 5,033 million yen (183.9%). The Asia segment posted net sales of 83,802 million yen (107.4%) but operating income of 10,132 million yen (87.2%), and Australia posted net sales of 11,148 million yen (102.9%) with operating income of 325 million yen (68.7%). Sales of the Guangzhou Food Factory, being intra-segment sales, have been eliminated: 1,324 million yen in the current period and 1,323 million yen in the previous period. The Asia segment includes operating income of the Guangzhou Food Factory of 76 million yen in the current period and 44 million yen in the previous period.
| Corporation (million yen) | Net sales Q4/2025 | Net sales Q4/2024 | Compared to the previous period | Operating income Q4/2025 | Operating income Q4/2024 | Compared to the previous period |
|---|---|---|---|---|---|---|
| Saizeriya | 172,908 | 146,455 | 118.1% | 5,033 | 2,737 | 183.9% |
| Australia | 11,148 | 10,835 | 102.9% | 325 | 473 | 68.7% |
| Asia | 83,802 | 78,055 | 107.4% | 10,132 | 11,619 | 87.2% |
| Elimination of intra-company transactions | -11,145 | -10,804 | – | 7 | 32 | 10.6% |
| Total | 256,714 | 224,542 | 114.3% | 15,499 | 14,863 | 104.3% |
Within Asia, Hong Kong and Singapore grew both sales and operating income, while Shanghai, Guangzhou and Beijing recorded lower operating income than the previous year. Vietnam appears for the first time, with sales of 11 million yen and an operating loss of 45 million yen.
| Corporation (million yen) | Sales Q4/2025 | Sales Q4/2024 | Compared to the previous period | Operating income Q4/2025 | Operating income Q4/2024 | Compared to the previous period |
|---|---|---|---|---|---|---|
| Shanghai | 21,901 | 21,391 | 102.4% | 3,189 | 4,175 | 76.4% |
| Guangzhou | 24,496 | 22,981 | 106.6% | 2,252 | 3,097 | 72.7% |
| Beijing | 8,813 | 8,615 | 102.3% | 862 | 1,082 | 79.7% |
| Hong Kong | 15,749 | 13,790 | 114.2% | 1,929 | 1,639 | 117.7% |
| Taiwan | 3,888 | 3,449 | 112.7% | 587 | 586 | 100.2% |
| Singapore | 8,940 | 7,826 | 114.2% | 1,280 | 993 | 128.8% |
| Vietnam | 11 | – | – | -45 | – | – |
| Total of the outlets in Asia | 83,802 | 78,055 | 107.4% | 10,056 | 11,575 | 86.9% |
Outlets and Customers
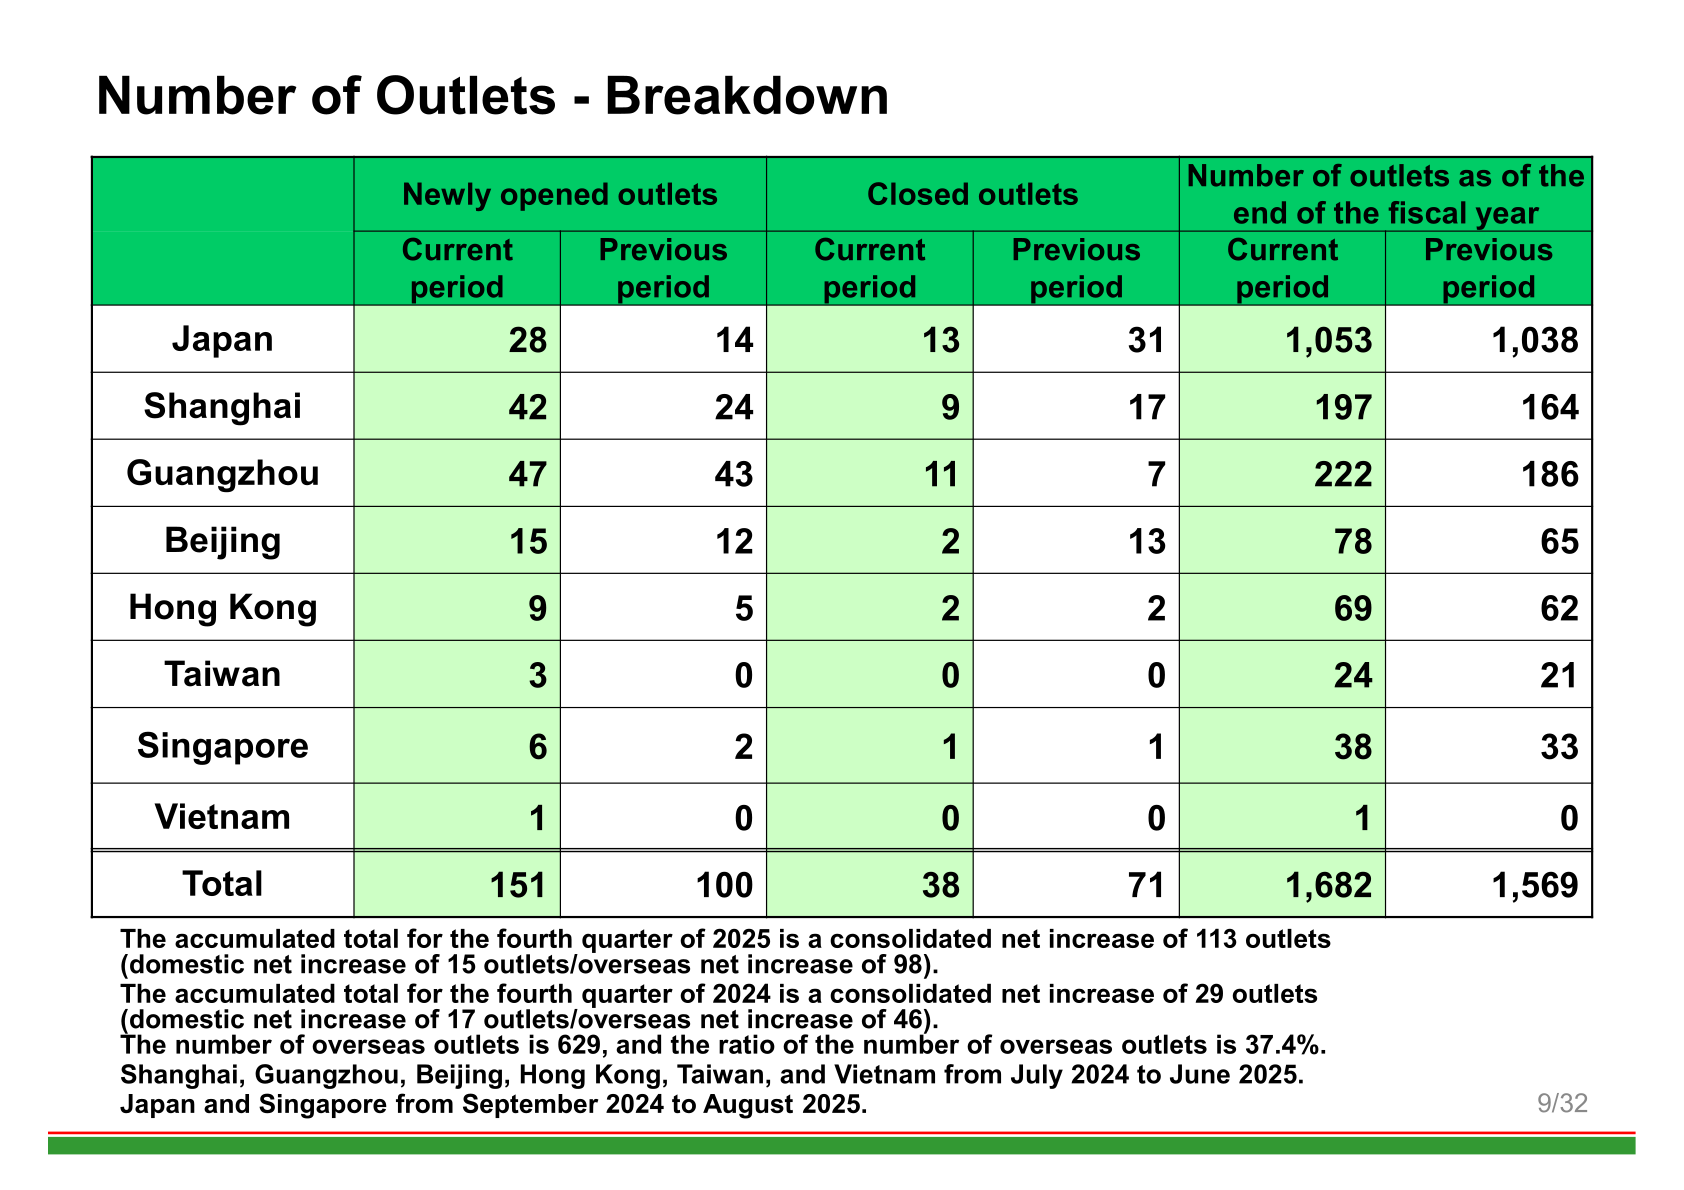
The number of outlets at the end of the fiscal year was 1,682, a consolidated net increase of 113 outlets compared with the fourth quarter of 2024 (domestic net increase of 15 outlets and overseas net increase of 98). The number of domestic outlets is 1,053 and the number of overseas outlets is 629, so the ratio of the number of overseas outlets is 37.4%. During the period 151 outlets were newly opened and 38 outlets were closed. The company operates in 42 prefectures and has no outlets in five: Kochi, Miyazaki, Nagasaki, Kagoshima and Okinawa.
Consolidated customers totalled 299,586 thousand, an increase of 33.5 million customers, or 112.6% of the previous year. Domestic customers numbered 204,989 thousand (domestic customers ratio 68.4%) and overseas customers 94,597 thousand (overseas customers ratio 31.6%). Average spending per customer was 857 yen on a consolidated basis, 844 yen in Japan and 886 yen overseas.
Capital investment for the period was 16,567 million yen against cash flow of 17,617 million yen, of which depreciation expenses were 7,942 million yen. Subsidiaries accounted for 6,988 million yen of capital investment and renovation of existing outlets for 4,217 million yen.
FY2026 Forecast
For the fiscal year ending August 2026 (Q4/2026 budget), the company plans net sales of 276,300 million yen (107.6% of the previous period), operating income of 19,000 million yen (122.6%) and net income of 12,400 million yen (111.1%). In the earnings forecast page, the same plan is shown in units of 100 million yen as net sales of 2,763, operating income of 190 and net income of 124.
| Item (million yen) | Q4/2026 (Budget) | Compared to the previous period | Q4/2025 (Actual) |
|---|---|---|---|
| Net sales | 276,300 | 107.6% | 256,714 |
| Selling, general and administrative expenses | 142,000 | 106.3% | 133,583 |
| Operating income | 19,000 | 122.6% | 15,499 |
| Ordinary income | 18,700 | 118.3% | 15,805 |
| Net income | 12,400 | 111.1% | 11,164 |
| Amount of total assets | 190,300 | 106.0% | 179,446 |
| Amount of net assets | 128,000 | 109.3% | 117,157 |
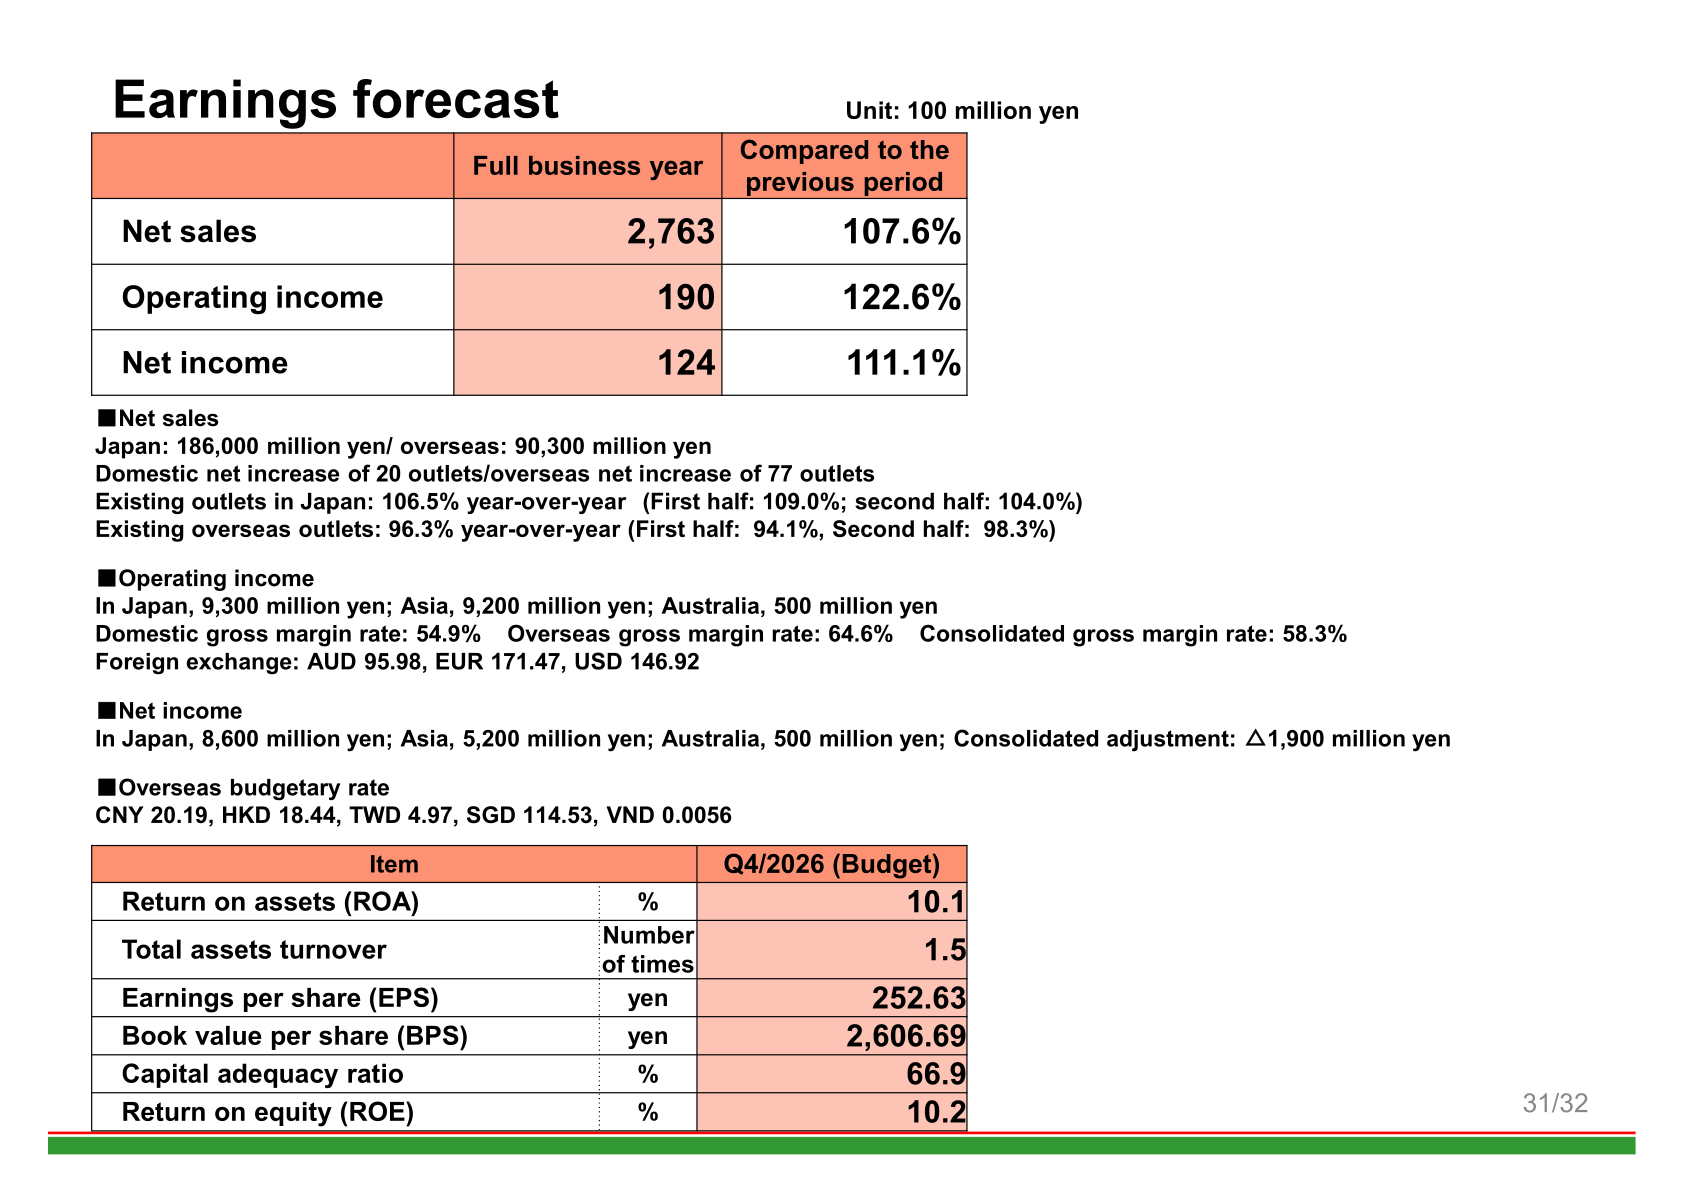
The budget assumes net sales of 186,000 million yen in Japan and 90,300 million yen overseas, a domestic net increase of 20 outlets and an overseas net increase of 77 outlets. Existing outlets in Japan are assumed at 106.5% year-over-year (first half 109.0%, second half 104.0%) and existing overseas outlets at 96.3% year-over-year (first half 94.1%, second half 98.3%). Operating income is planned at 9,300 million yen in Japan, 9,200 million yen in Asia and 500 million yen in Australia, with a domestic gross margin rate of 54.9%, an overseas gross margin rate of 64.6% and a consolidated gross margin rate of 58.3%. Net income is planned at 8,600 million yen in Japan, 5,200 million yen in Asia and 500 million yen in Australia, with a consolidated adjustment of 1,900 million yen. Foreign exchange assumptions are AUD 95.98, EUR 171.47 and USD 146.92, with overseas budgetary rates of CNY 20.19, HKD 18.44, TWD 4.97, SGD 114.53 and VND 0.0056. The number of outlets at the end of the period is planned at 1,779, with 161 new openings and 64 closures, and capital investment of 25,522 million yen.
Management Indicators
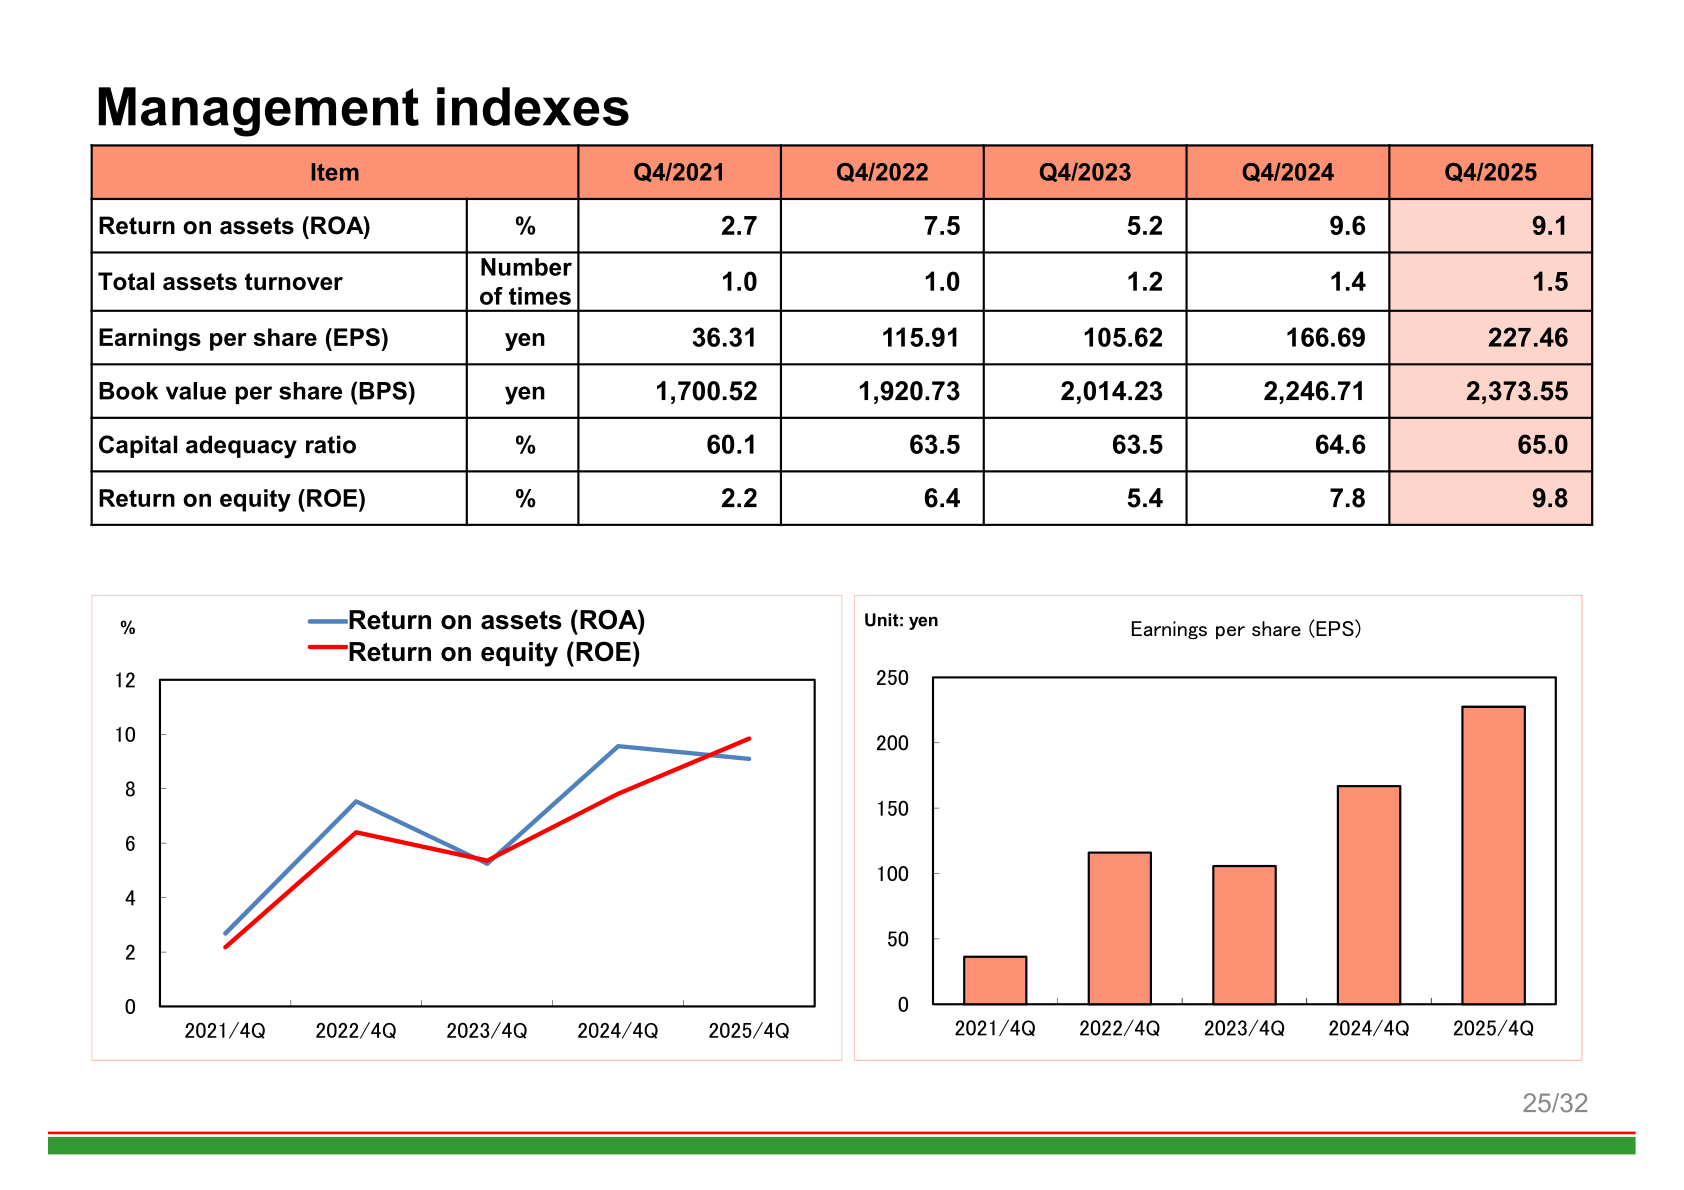
Return on assets (ROA) was 9.1% against 9.6% in the previous year, while return on equity (ROE) rose to 9.8% from 7.8%. Earnings per share (EPS) was 227.46 yen and book value per share (BPS) was 2,373.55 yen, with a capital adequacy ratio of 65.0% and total assets turnover of 1.5 times. For the Q4/2026 budget, the company shows ROA of 10.1%, ROE of 10.2%, EPS of 252.63 yen, BPS of 2,606.69 yen and a capital adequacy ratio of 66.9%.
Shareholder Returns
The Financial Results Briefing Materials do not contain a dividend or shareholder return policy. This cannot be confirmed from the materials.
Challenges to Be Made From Now On
The presentation lists the challenges the company intends to address going forward: fostering store managers capable of establishing the outlet organization; implementing active repair of the outlets so as to improve the outlet environment; restructuring production, physical distribution and purchasing from a global perspective; streamlining outlet operations through commissary functions; formulating work models, outlet layout models and profit models; promoting DX, continuing IT investments and enhancing cybersecurity measures; promoting SDGs such as the reduction of food losses and plastics, recycling and energy saving; securing human resources and establishing the education system to develop the outlet-opening strategy; and working out the outlet-opening strategy that includes new overseas bases and countries.
This article is an analysis based on publicly available information and is not a recommendation to buy or sell any specific securities. Investment decisions are your own responsibility.
















