
This article is based on publicly available IR materials and is not a recommendation to buy or sell any specific securities.
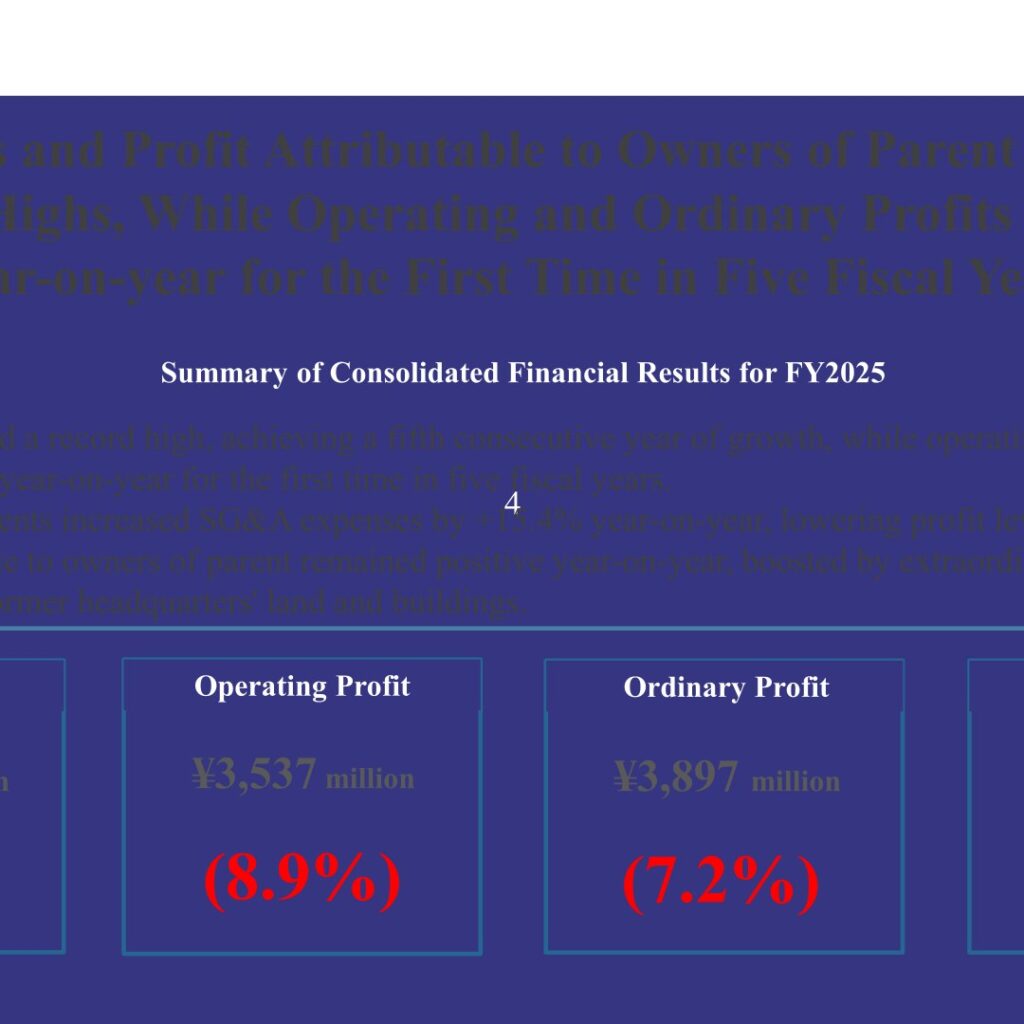
RIX CORPORATION (7525), a Fukuoka-based “manufacturing and trading company” serving the manufacturing industries, reported net sales of ¥55,827 million (+2.0% year-on-year) for the fiscal year ended March 31, 2026, which the company labels FY2025. Net sales reached a record high for a fifth consecutive year of growth, and gross profit rose to a record ¥14,747 million (+8.5% year-on-year) as a higher share of original products improved the cost of sales ratio. However, operating profit fell 8.9% to ¥3,537 million and ordinary profit fell 7.2% to ¥3,897 million, declining year-on-year for the first time in five fiscal years, because SG&A expenses rose 15.4% on growth investments. Profit attributable to owners of parent still rose 11.9% to a record ¥3,180 million, boosted by extraordinary income from the sale of the land and buildings of the former headquarters.
Consolidated Results (Full-Year Actual)
Amounts are in millions of yen as presented in the materials; figures in parentheses denote decreases. The company attributes the profit decline to a +15.4% year-on-year rise in SG&A expenses (an increase of ¥1.49 billion) tied to growth investments in human resources, equipment and IT, together with a provision for doubtful accounts. The cost of sales ratio improved by 1.7% on a higher composition of original products, while the SG&A ratio rose by 2.4%.
| Item | FY2025 | FY2024 | Change |
|---|---|---|---|
| Net sales | 55,827 | 54,727 | +2.0% |
| Gross profit | 14,747 | 13,592 | +8.5% |
| SG&A expenses | 11,210 | 9,710 | +15.4% |
| Operating profit | 3,537 | 3,882 | (8.9%) |
| Ordinary profit | 3,897 | 4,197 | (7.2%) |
| Profit attributable to owners of parent | 3,180 | – | +11.9% |
| Operating profit ratio | 6.3% | 7.1% | – |
The main components of the year-on-year increase in SG&A expenses disclosed by the company were labor costs of +¥488 million (higher employee headcount and base salaries), depreciation of +¥210 million (the RIX Cooperative Creation Center, a production control system and early write-off of the former head office), a provision for doubtful accounts of +¥333 million against loans to an unconsolidated sub-subsidiary in the U.S. whose performance deteriorated, and head office relocation costs of +¥78 million.
Segment Results
Net sales and segment profit are shown in millions of yen. The Electronics & Semiconductor and Machine Tools segments drove performance, while growth in the high-volume Steel & Iron segment slowed slightly. The percentage notation below follows the presentation materials.
| Segment | Net sales FY2025 | Net sales FY2024 | Net sales change | Segment profit FY2025 | Segment profit FY2024 | Segment profit change |
|---|---|---|---|---|---|---|
| Steel & Iron | 15,822 | 15,633 | +1.2% | 2,025 | 2,006 | +1.0% |
| Automobile | 12,179 | 11,723 | +3.9% | 1,366 | 1,300 | +5.1% |
| Electronics & Semiconductor | 7,858 | 7,406 | +6.1% | 959 | 890 | +7.8% |
| Rubber & Tire | 3,764 | 3,870 | (2.7%) | 339 | 415 | (18.3%) |
| Machine Tools | 2,633 | 2,320 | +13.5% | 636 | 502 | +26.6% |
| High-performance Material | 2,252 | 2,539 | (-11.3%) | 245 | 267 | (8.1%) |
| Environment | 2,742 | 3,045 | (-10.0%) | 231 | 295 | (21.4%) |
| Paper & Pulp | 893 | 918 | (-2.8%) | 107 | 106 | +1.1% |
| Others | 7,679 | 7,269 | +5.6% | 1,120 | 965 | +16.1% |
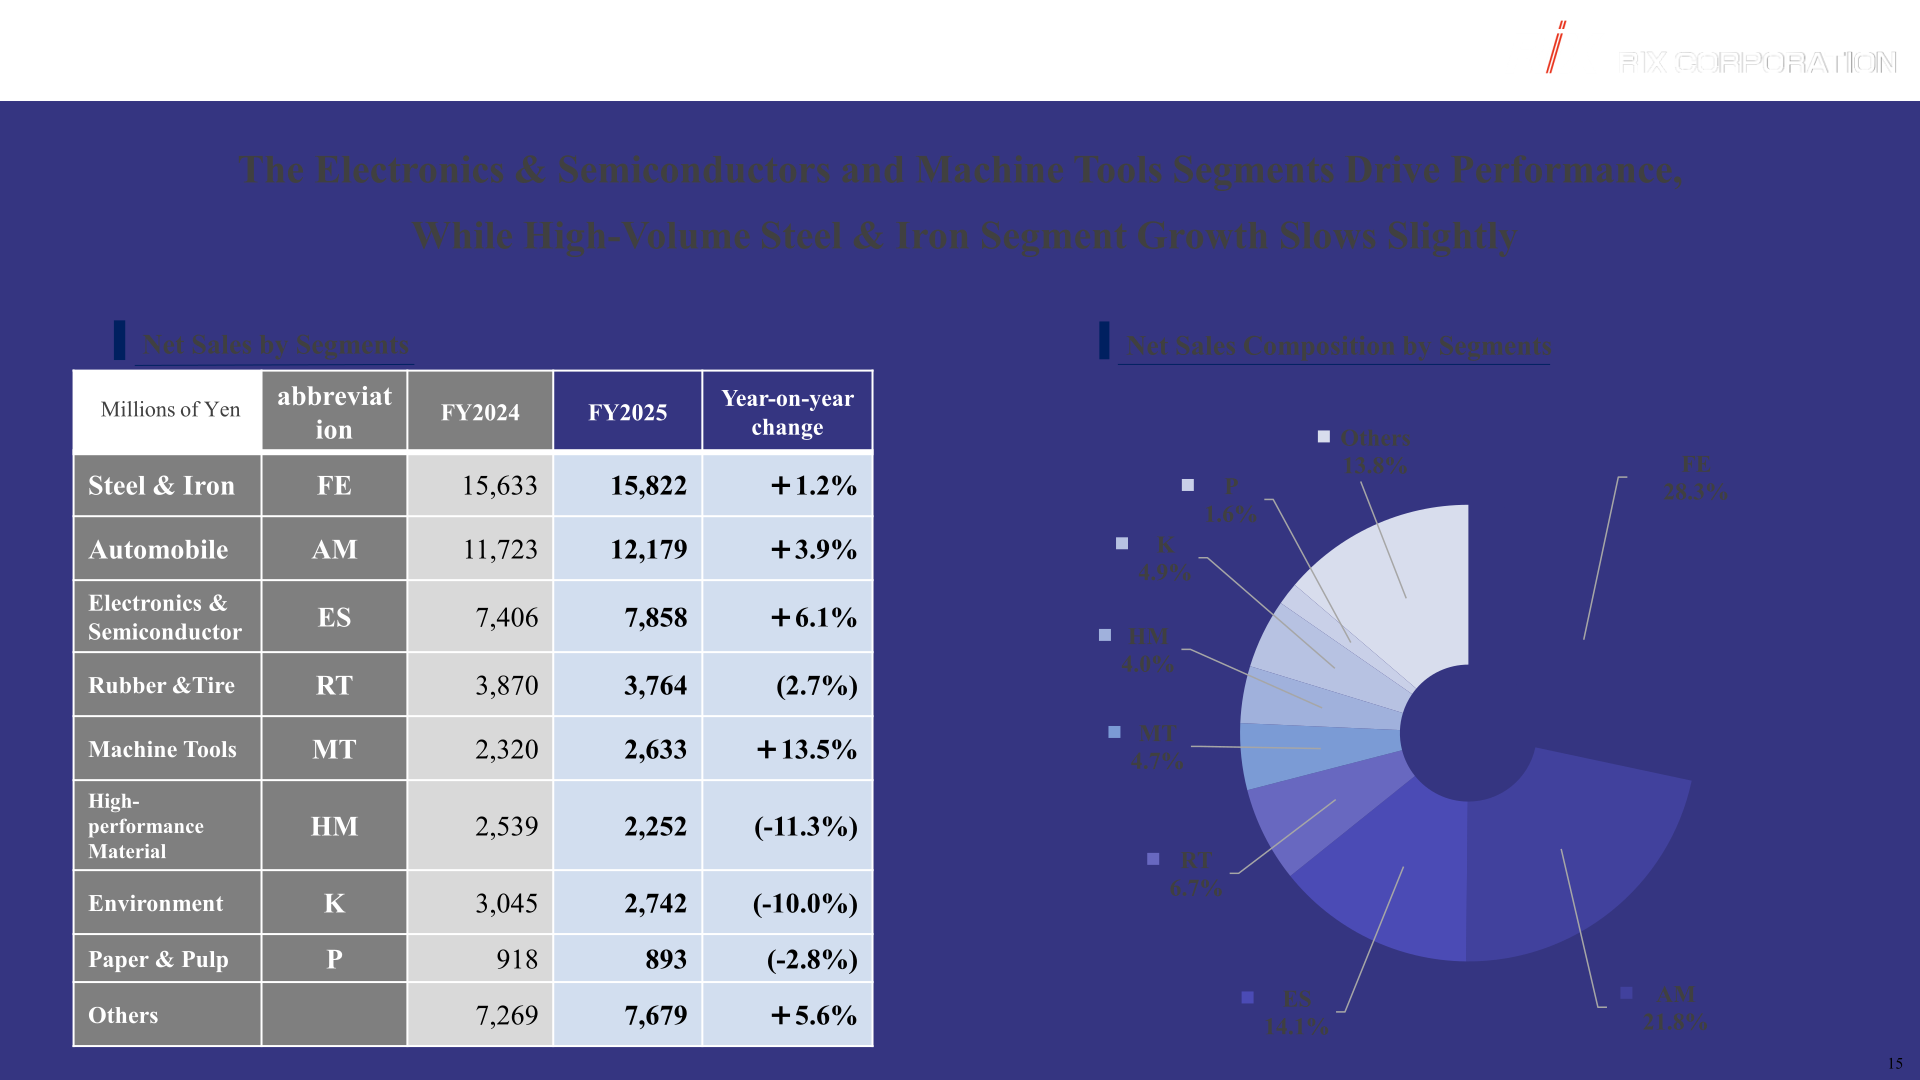
In Steel & Iron, both net sales and profit reached record highs, but the growth rate slowed on a slight decline in customers’ appetite for capital expenditures; sales were driven by large-scale equipment replacement projects, maintenance projects for aging facilities, and equipment projects for electric arc furnaces. The segment profit ratio was 12.8%, down 0.03 pts year-on-year. In Automobile, increased sales of original products such as defoaming machines and other items for battery manufacturing lines contributed to both net sales and profit, which reached record highs; first-quarter results fell short of the previous year on the impact of U.S. tariffs. The profit ratio was 11.1%, up 0.13 pts.
In Electronics & Semiconductor, both net sales and profit reached record highs on demand from the strong semiconductor industry, with higher sales of consumables used in semiconductor production and steady growth in rotary joints, the company’s original product embedded in a wide range of semiconductor production equipment; the profit ratio was 12.0%, up 0.20 pts. Rubber & Tire saw net sales, profit and the profit ratio all decline, with the profit ratio at 10.7%, down 1.73 pts, as sales of high-margin original products (valves, water treatment and filtration) fell. Machine Tools posted record net sales and profit, with the profit ratio improving 2.50 pts to 24.2%, as global demand lifted sales of rotary joints and the original supercritical carbon dioxide generation system. The profit ratios of the remaining segments were 10.9% for High-performance Material (+0.38 pts), 8.5% for Environment (-1.23 pts) and 12.0% for Paper & Pulp (+0.47 pts).
By region, sales grew in North America, the company’s focus area for automotive-related business, while net sales in other overseas regions declined year-on-year. The overseas sales ratio was 12.1%, a year-on-year change of -0.9%.
| Region | FY2025 | FY2024 | Change |
|---|---|---|---|
| Japan | 49,054 | 47,615 | +3.0% |
| China | 2,249 | 2,326 | (3.3%) |
| North America | 1,757 | 1,610 | +9.1% |
| Thailand | 960 | 1,071 | (10.3%) |
| Europe | 477 | 573 | (16.7%) |
| India | 605 | 654 | (7.4%) |
| Others | 3 | 42 | (92.4%) |
On the balance sheet, total assets rose ¥3,691 million to ¥47,505 million as of March 31, 2026, with property, plant and equipment up ¥694 million to ¥6,120 million (India factory construction costs +373, Fukuoka factory production equipment +109) and intangible assets up ¥832 million to ¥1,626 million (core sales system development costs +971). Total net assets rose ¥3,134 million to ¥29,187 million. Operating cash flow fell ¥1,783 million to ¥1,343 million, as trade payables decreased by ¥1,904 million in connection with compliance with the Proper Transactions Act, while investing cash outflows narrowed to ¥379 million partly due to the sale of the former headquarters land and buildings, lifting free cash flow to ¥963 million from ¥817 million.
FY2026 Forecast
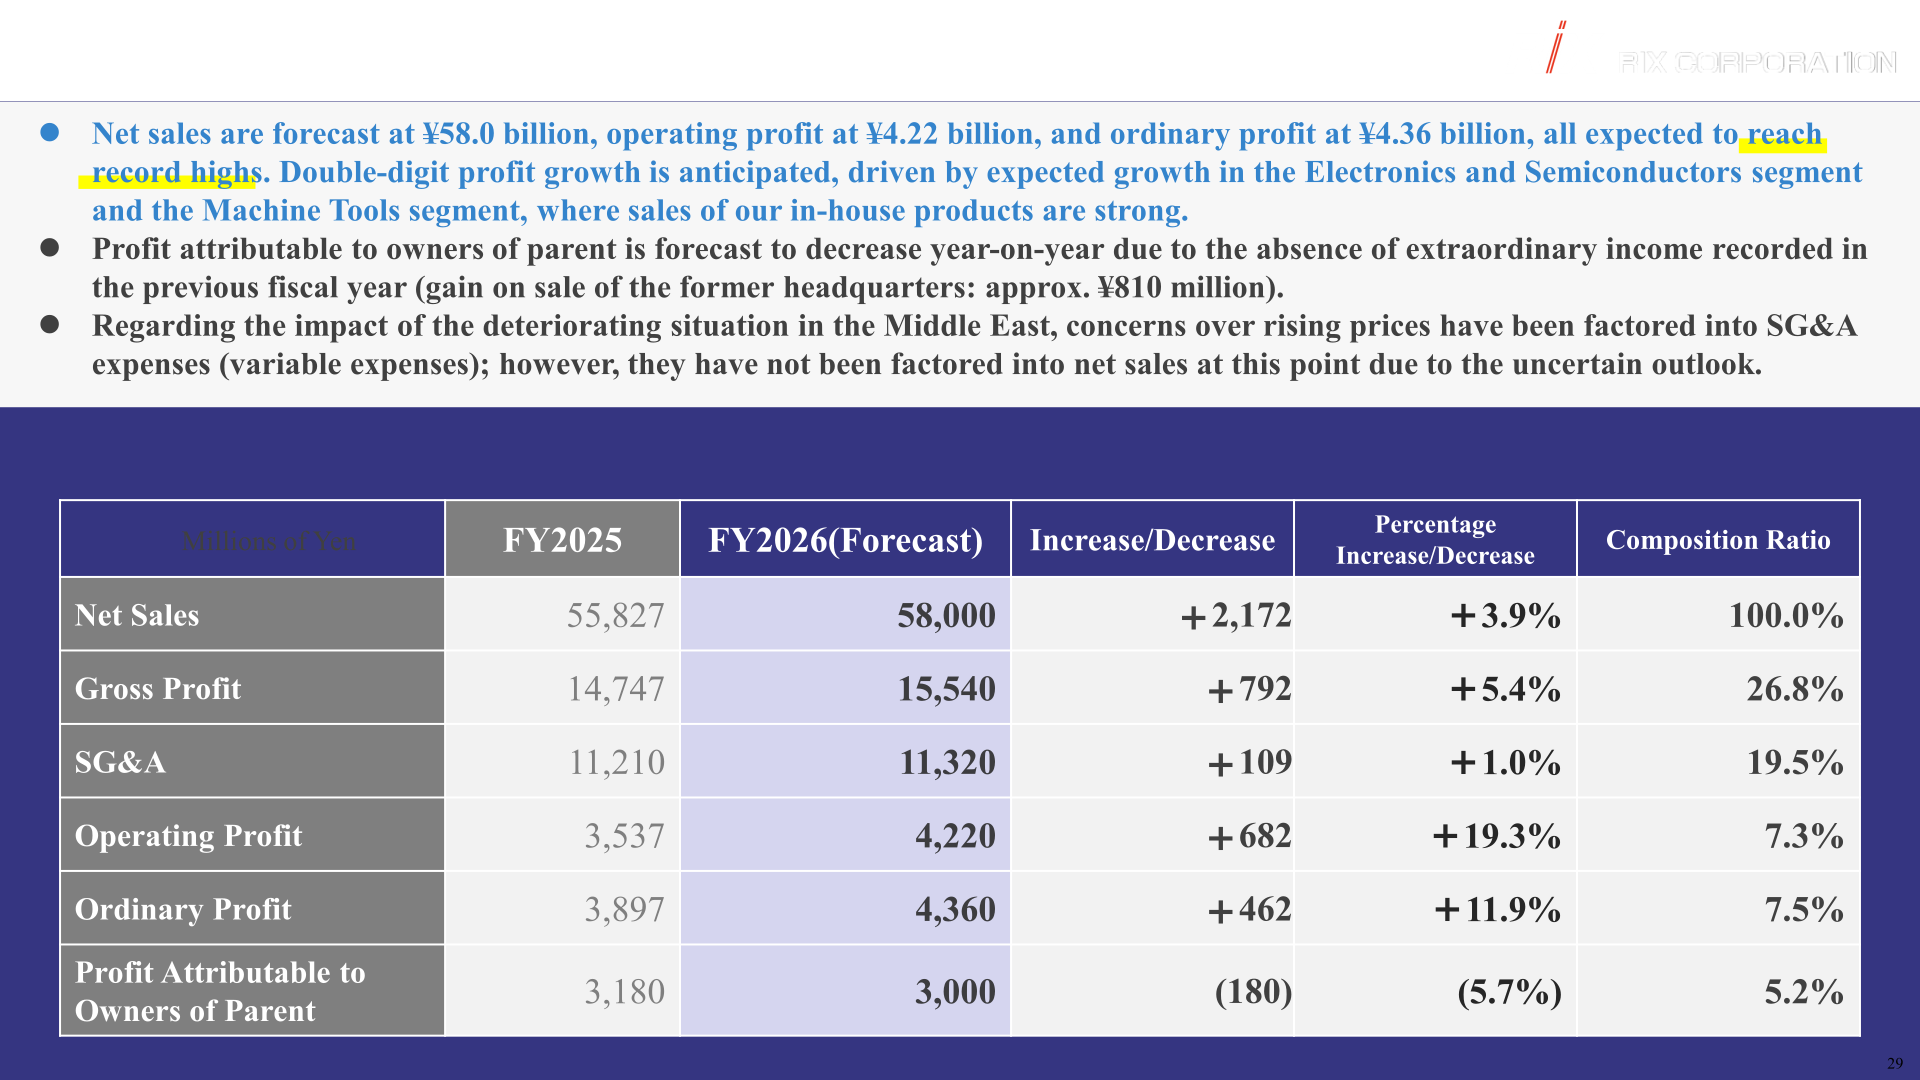
For FY2026 (the fiscal year ending March 31, 2027), the company forecasts record highs for net sales, operating profit and ordinary profit, with double-digit profit growth driven by expected growth in the Electronics & Semiconductor and Machine Tools segments, where sales of in-house products are strong. Profit attributable to owners of parent is forecast to decline year-on-year because of the absence of the extraordinary income recorded in the previous fiscal year (gain on sale of the former headquarters of approximately ¥810 million). Regarding the deteriorating situation in the Middle East, concerns over rising prices have been factored into SG&A expenses (variable expenses), but not into net sales at this point due to the uncertain outlook.
| Item | FY2026 (Forecast) | FY2025 | Increase/Decrease | Percentage Increase/Decrease | Composition Ratio |
|---|---|---|---|---|---|
| Net sales | 58,000 | 55,827 | +2,172 | +3.9% | 100.0% |
| Gross profit | 15,540 | 14,747 | +792 | +5.4% | 26.8% |
| SG&A | 11,320 | 11,210 | +109 | +1.0% | 19.5% |
| Operating profit | 4,220 | 3,537 | +682 | +19.3% | 7.3% |
| Ordinary profit | 4,360 | 3,897 | +462 | +11.9% | 7.5% |
| Profit attributable to owners of parent | 3,000 | 3,180 | (180) | (5.7%) | 5.2% |
Shareholder Returns
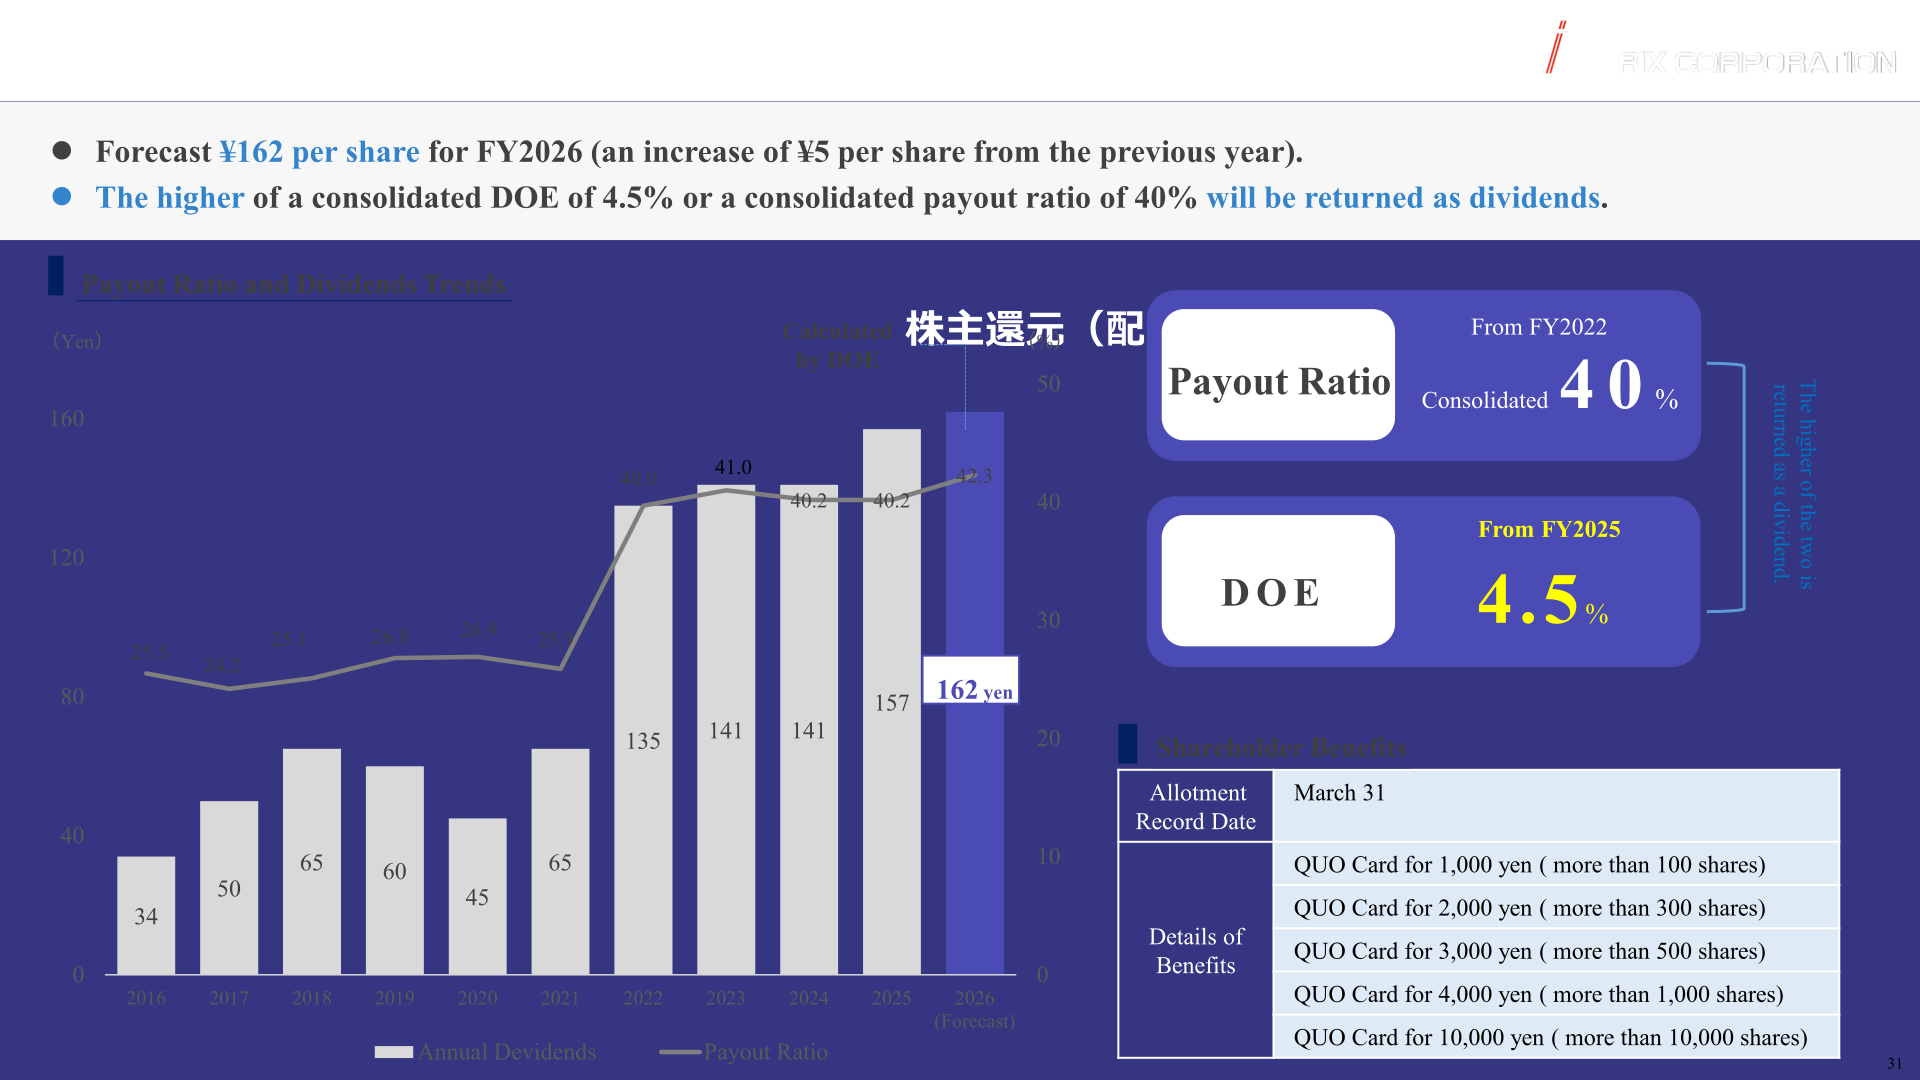
RIX forecasts an annual dividend of ¥162 per share for FY2026, an increase of ¥5 per share from the previous year’s ¥157. From FY2025 the company returns the higher of a consolidated DOE (dividend on equity) ratio of 4.5% or a consolidated payout ratio of 40%; the FY2026 forecast of ¥162 is the amount calculated by DOE. The consolidated payout ratio standard of 40% has been in place since FY2022. The company also offers a shareholder benefit program with a record date of March 31, granting QUO Cards of ¥1,000 for holdings of more than 100 shares, ¥2,000 for more than 300 shares, ¥3,000 for more than 500 shares, ¥4,000 for more than 1,000 shares and ¥10,000 for more than 10,000 shares.
Medium-Term Plan / Topics
Under its long-term management plan “LV2030,” RIX targets consolidated net sales of ¥70 billion and operating profit of ¥5.6 billion, an operating profit ratio of 8% or more, ROE of 11% or more, an overseas sales ratio of 20% or more, growth fields of ¥10 billion, and an original product ratio of 55% or more. The company positions the development of original products, and the strengthening of its manufacturer functions, as its growth driver, noting that original products currently account for 29.3% of sales against the LV2030 target of 55%.
| LV2030 quantitative target | Target | FY2025 |
|---|---|---|
| Consolidated net sales | ¥70 billion | ¥55.8 billion |
| Operating profit | ¥5.6 billion | ¥3.5 billion |
| Operating profit ratio | 8% or more | 6.3% |
| ROE | 11% or more | 11.7% |
| Overseas sales ratio | 20% or more | 12.1% |
| Growth fields | ¥10 billion | ¥8.0 billion |
| Original product ratio | 55% or more | 29.3% |
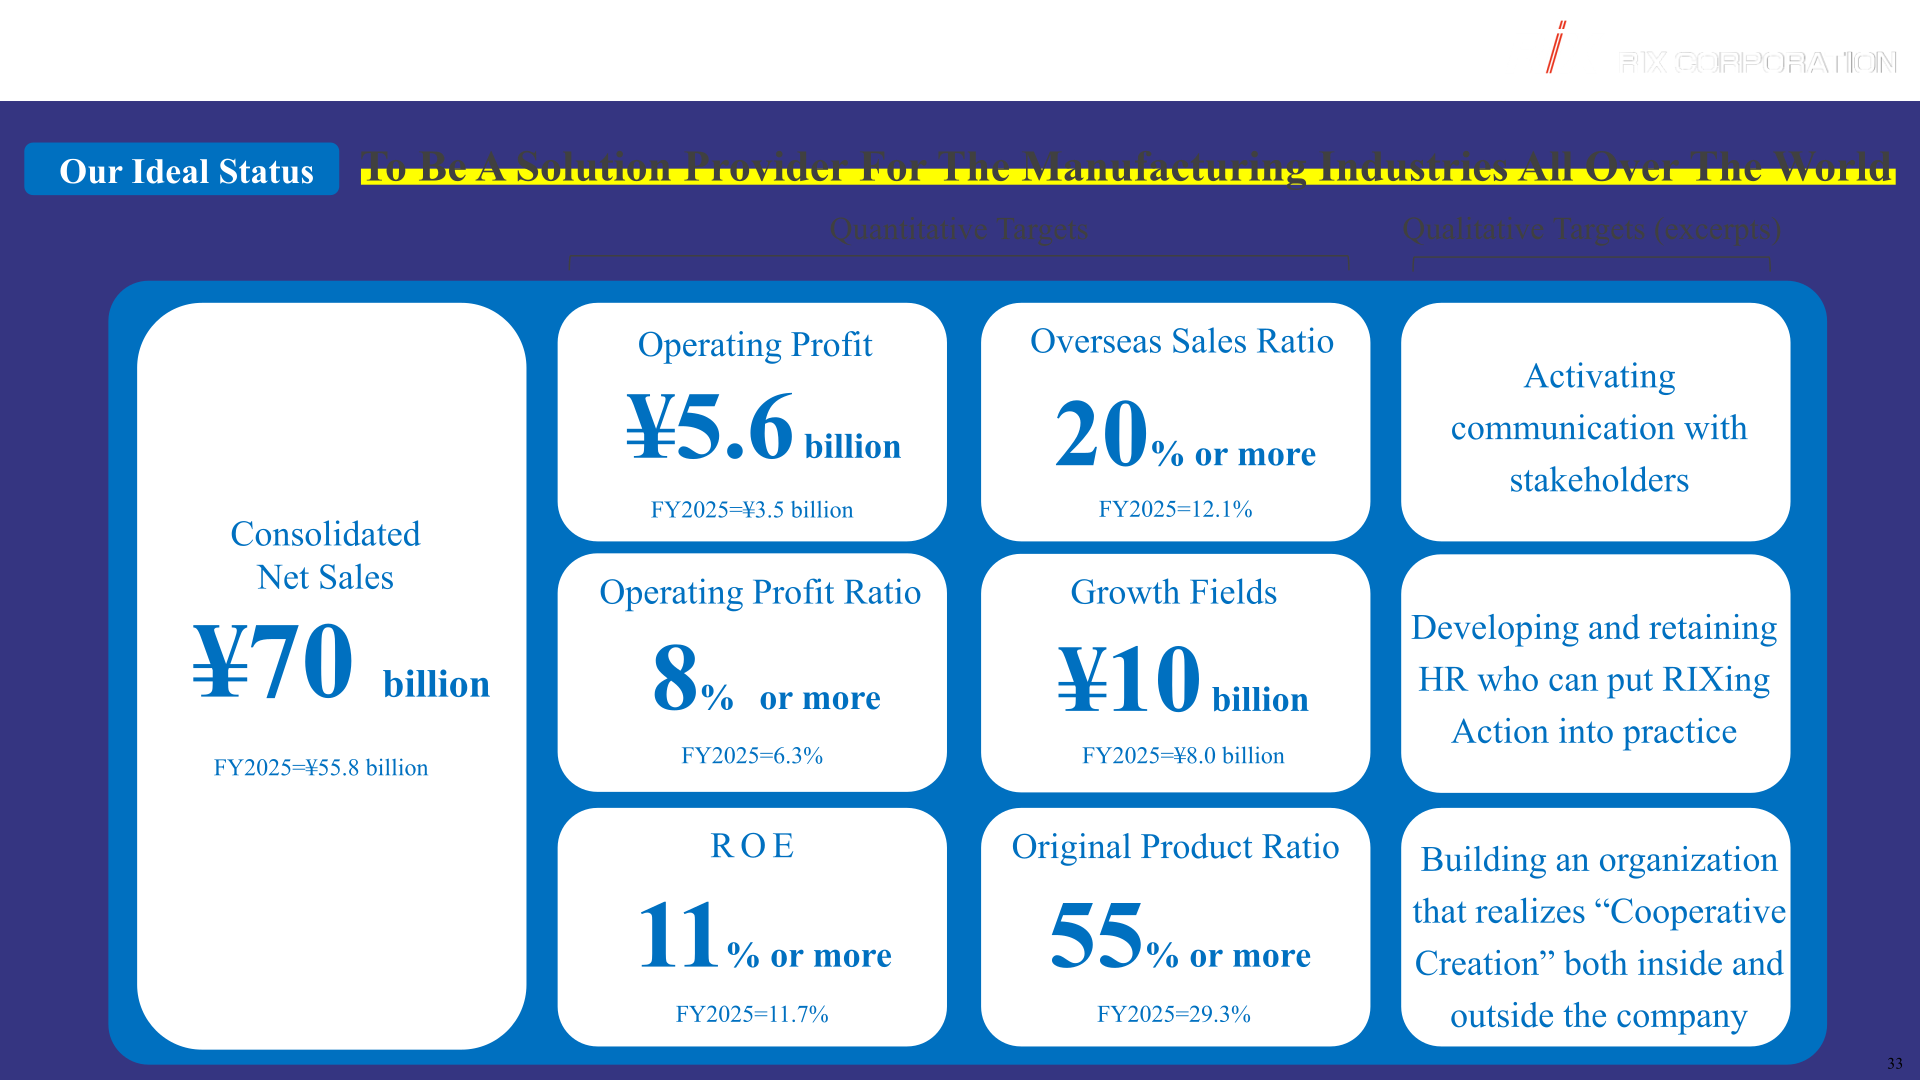
To improve PBR, the company began ROIC management in FY2026, calculating metrics for each segment, sales office and department; it is promoting measures to raise the ratio of original products through development at its new R&D center, the start of operations at the India factory, construction of a semiconductor-related repair facility and expanded sales of its original flux cleaning equipment; and it is enhancing IR and shareholder returns, including disclosure of its capital allocation policy and the 4.5% DOE ratio introduced in FY2025, while working to address low trading liquidity by reducing the shareholding ratios of major shareholders.
Among the topics reported, RIX established a new “Advanced Solution Division” covering water treatment, battery manufacturing and other fields, aiming for net sales of ¥5.0 billion and operating profit of ¥650 million in FY2030, each roughly twice the current level. Its India factory in Karnataka State commenced production in February 2026, making rotary joints and oil skimmers, with a sales contribution from FY2026 and a plan to expand the workforce from the current 9 members to 40, the same scale as the Dalian (China) factory. The company also became the first Fukuoka-based company to join the Intel-led SATAS consortium for semiconductor back-end automation, developed a flux cleaning equipment product supporting 2.5D and 3D packaging (patent pending) that has already been supplied to multiple major semiconductor-related companies, and had its compact feed-pushing robot for dairy farming selected for a project related to the Ministry of Agriculture, Forestry and Fisheries, with sales scheduled to commence in 2029.
This article is an analysis based on publicly available information and is not a recommendation to buy or sell any specific securities. Investment decisions are your own responsibility.
















