
This article is based on publicly available IR materials and is not a recommendation to buy or sell any specific securities.
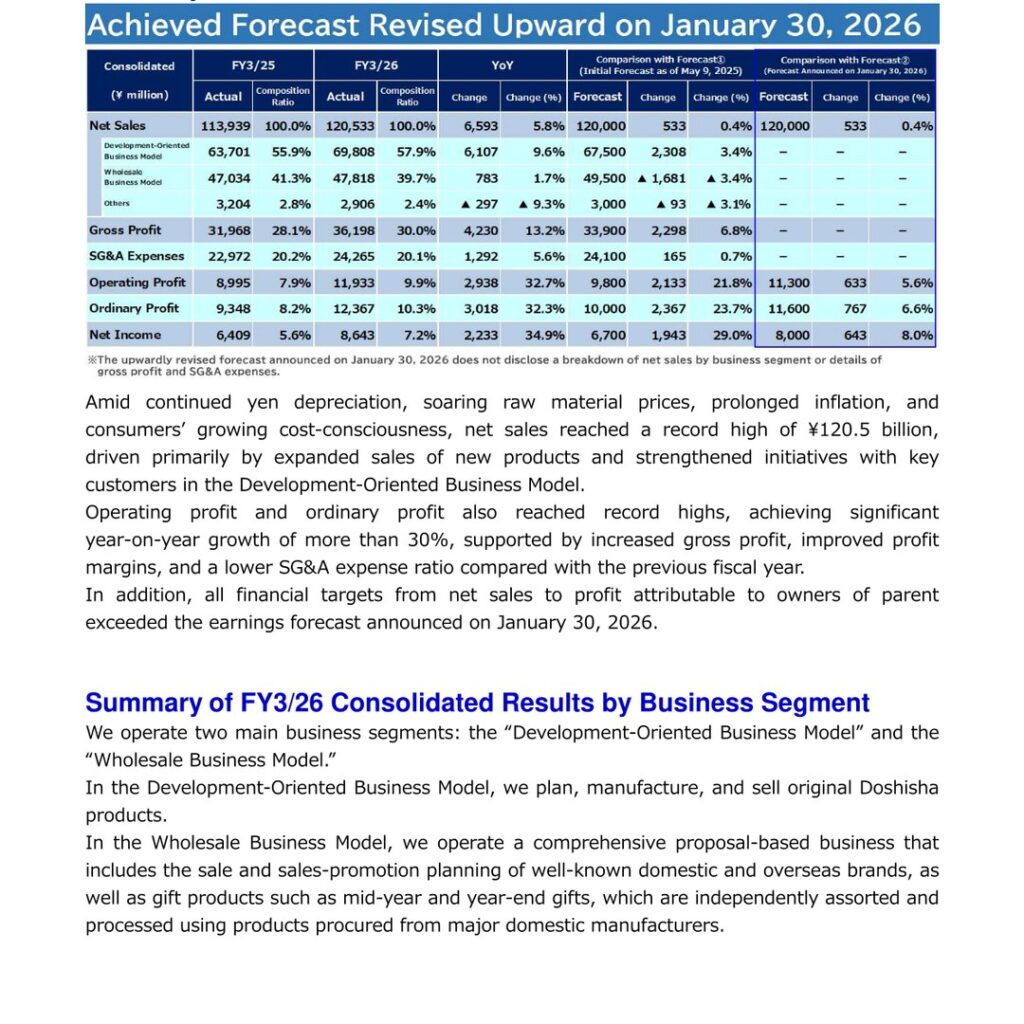
Doshisha Corporation reported record-high net sales of ¥120.5 billion for the fiscal year ended March 2026, driven primarily by expanded sales of new products and strengthened initiatives with key customers in the Development-Oriented Business Model. Operating profit and ordinary profit also reached record highs, achieving significant year-on-year growth of more than 30%, supported by increased gross profit, improved profit margins, and a lower SG&A expense ratio compared with the previous fiscal year. All financial targets from net sales to profit attributable to owners of parent exceeded the earnings forecast announced on January 30, 2026.
Note: The company labels this fiscal year “FY3/26” (the fiscal year ended March 2026); this site classifies the most recent completed fiscal year as FY2025. The tables and figures below keep the company’s own labels and units exactly as presented in its results briefing material.
Consolidated Results (Full-Year Actual)
Net sales rose 5.8% year on year to ¥120,533 million. Gross profit increased 13.2% to ¥36,198 million and the gross profit ratio improved to 30.0% from 28.1%, while the SG&A expense ratio edged down to 20.1% from 20.2%. Operating profit rose 32.7% to ¥11,933 million, ordinary profit rose 32.3% to ¥12,367 million, and net income rose 34.9% to ¥8,643 million.
| Item (¥ million) | FY3/26 Actual | Composition Ratio | FY3/25 Actual | Composition Ratio | Change | Change (%) |
|---|---|---|---|---|---|---|
| Net Sales | 120,533 | 100.0% | 113,939 | 100.0% | 6,593 | 5.8% |
| Development-Oriented Business Model | 69,808 | 57.9% | 63,701 | 55.9% | 6,107 | 9.6% |
| Wholesale Business Model | 47,818 | 39.7% | 47,034 | 41.3% | 783 | 1.7% |
| Others | 2,906 | 2.4% | 3,204 | 2.8% | ▲ 297 | ▲ 9.3% |
| Gross Profit | 36,198 | 30.0% | 31,968 | 28.1% | 4,230 | 13.2% |
| SG&A Expenses | 24,265 | 20.1% | 22,972 | 20.2% | 1,292 | 5.6% |
| Operating Profit | 11,933 | 9.9% | 8,995 | 7.9% | 2,938 | 32.7% |
| Ordinary Profit | 12,367 | 10.3% | 9,348 | 8.2% | 3,018 | 32.3% |
| Net Income | 8,643 | 7.2% | 6,409 | 5.6% | 2,233 | 34.9% |
Against the initial forecast announced on May 9, 2025, net sales came in ¥533 million (0.4%) higher, operating profit ¥2,133 million (21.8%) higher, ordinary profit ¥2,367 million (23.7%) higher, and net income ¥1,943 million (29.0%) higher. Against the upwardly revised forecast announced on January 30, 2026, net sales were ¥533 million (0.4%) higher, operating profit ¥633 million (5.6%) higher, ordinary profit ¥767 million (6.6%) higher, and net income ¥643 million (8.0%) higher. The company notes that the revised forecast announced on January 30, 2026 does not disclose a breakdown of net sales by business segment or details of gross profit and SG&A expenses.
Segment Results
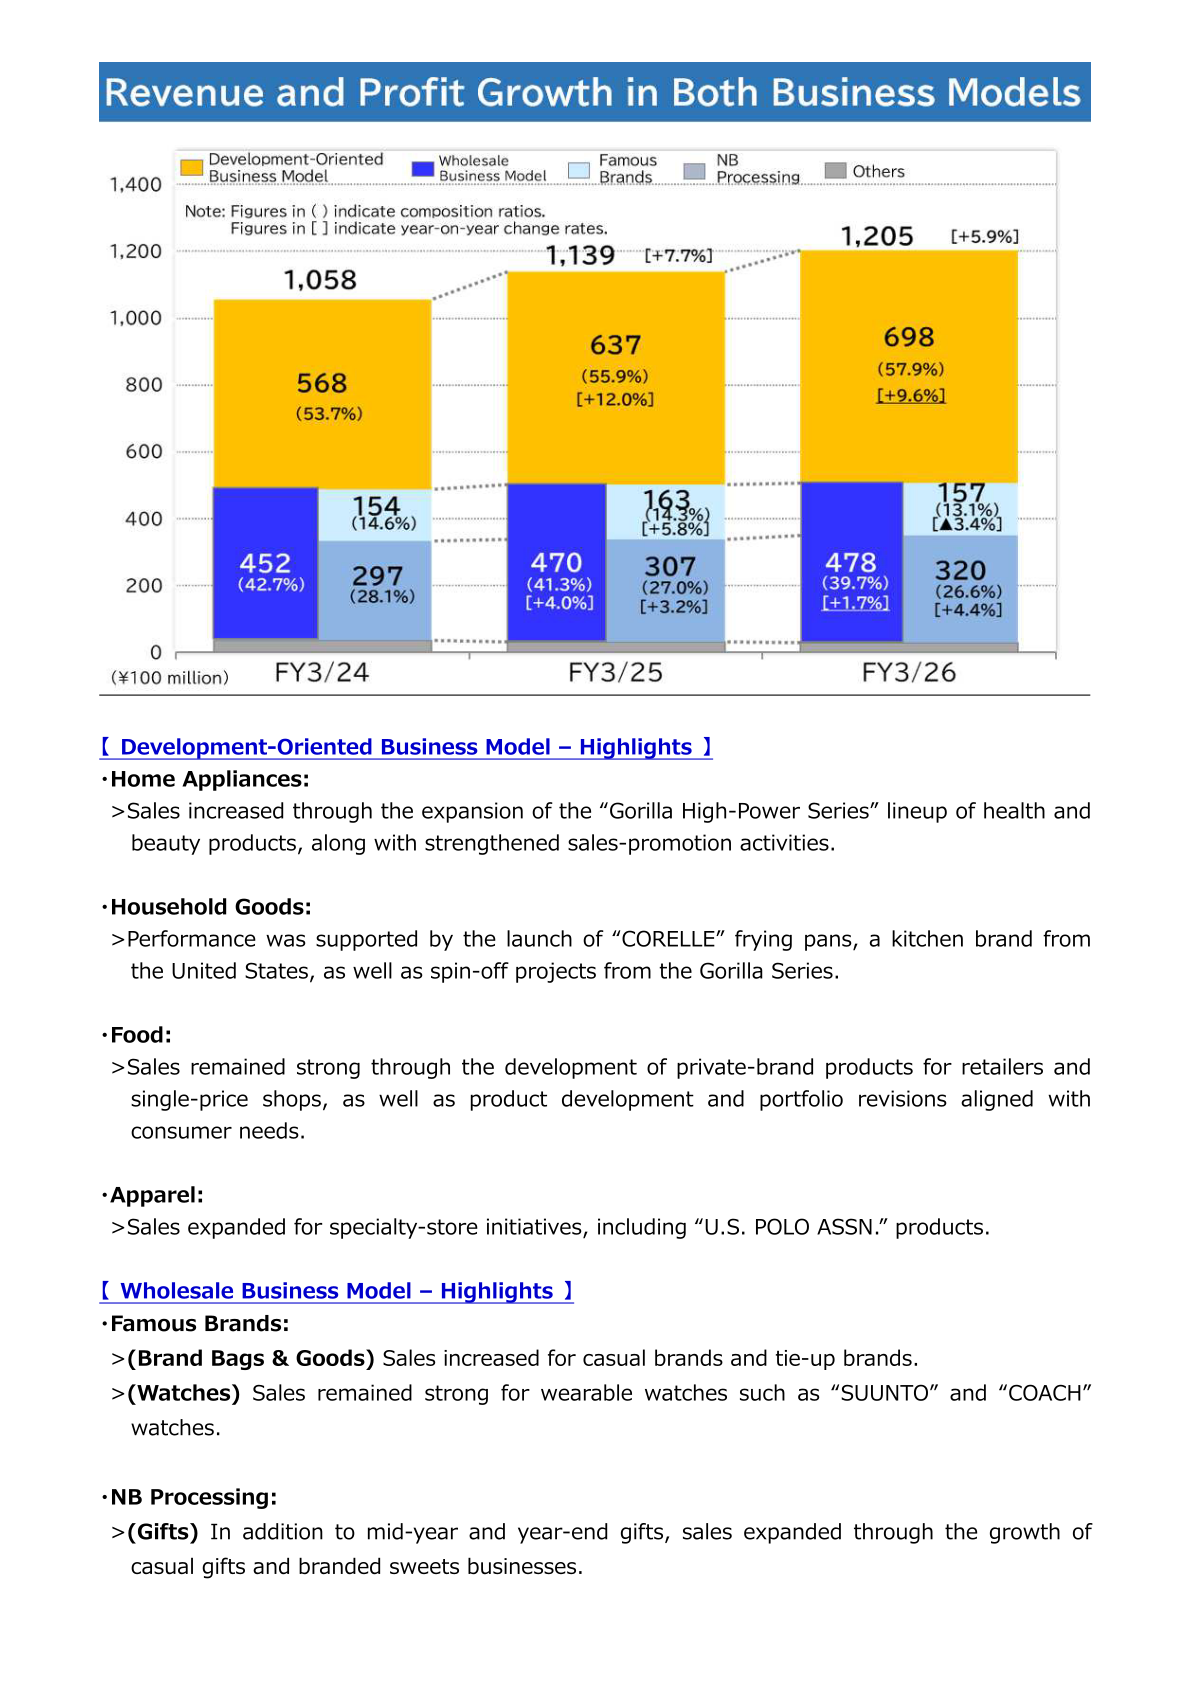
Doshisha operates two main business segments. In the Development-Oriented Business Model, the company plans, manufactures, and sells original Doshisha products. In the Wholesale Business Model, it operates a comprehensive proposal-based business that includes the sale and sales-promotion planning of well-known domestic and overseas brands, as well as gift products such as mid-year and year-end gifts, which are independently assorted and processed using products procured from major domestic manufacturers. In the Development-Oriented Business Model, home appliance sales increased through the expansion of the “Gorilla High-Power Series” lineup of health and beauty products; household goods were supported by the launch of “CORELLE” frying pans and spin-off projects from the Gorilla Series; food sales remained strong on private-brand products for retailers and single-price shops; and apparel sales expanded for specialty-store initiatives including “U.S. POLO ASSN.” products. In the Wholesale Business Model, Famous Brands saw higher sales of casual and tie-up brand bags and goods and strong sales of wearable watches such as “SUUNTO” and “COACH” watches, while NB Processing expanded through casual gifts and branded sweets businesses in addition to mid-year and year-end gifts.
| Net Sales (¥100 million) | FY3/24 | FY3/25 | FY3/26 | FY3/26 Composition Ratio | FY3/26 YoY Change |
|---|---|---|---|---|---|
| Total | 1,058 | 1,139 | 1,205 | – | +5.9% |
| Development-Oriented Business Model | 568 | 637 | 698 | 57.9% | +9.6% |
| Wholesale Business Model | 452 | 470 | 478 | 39.7% | +1.7% |
| Famous Brands | 297 | 307 | 320 | 26.6% | +4.4% |
| NB Processing | 154 | 163 | 157 | 13.1% | ▲3.4% |
FY3/27 Forecast
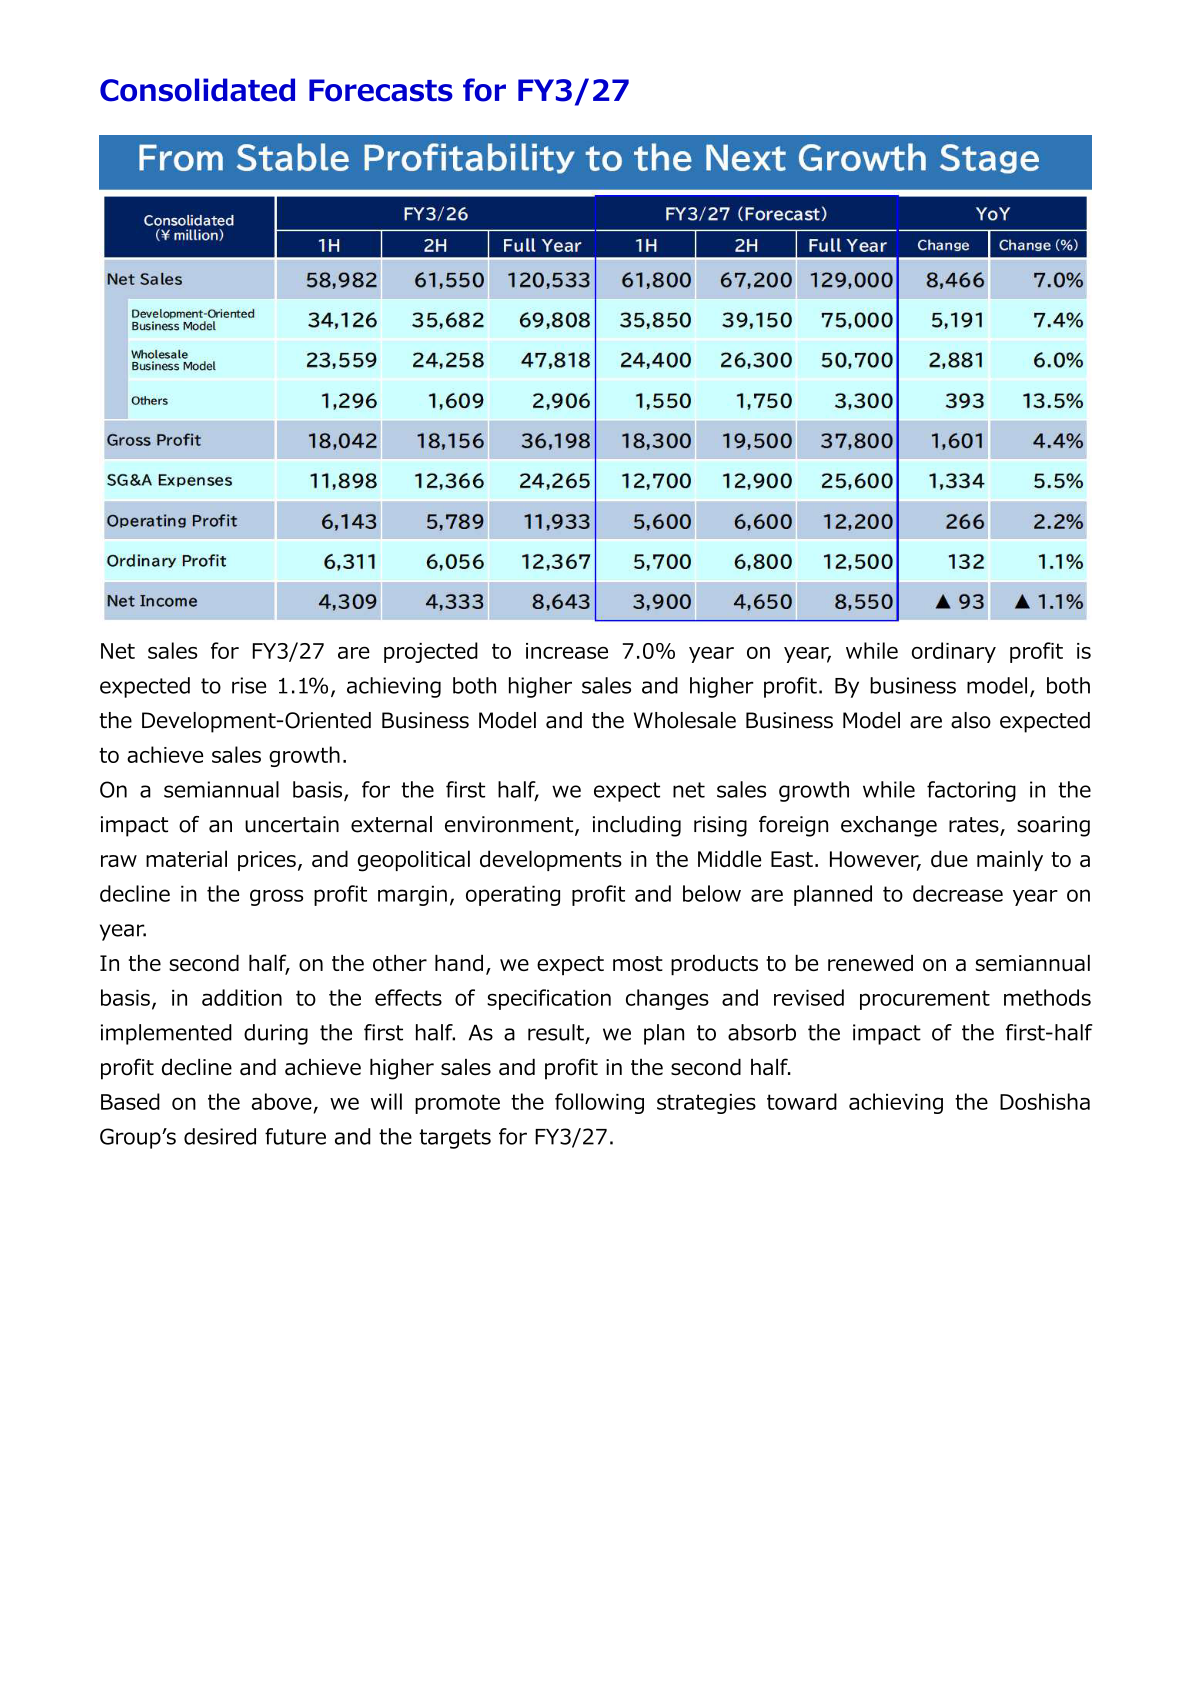
Net sales for FY3/27 are projected to increase 7.0% year on year to ¥129,000 million, while ordinary profit is expected to rise 1.1% to ¥12,500 million, achieving both higher sales and higher profit. By business model, both the Development-Oriented Business Model and the Wholesale Business Model are expected to achieve sales growth. On a semiannual basis, the company expects first-half net sales growth while factoring in the impact of an uncertain external environment, including rising foreign exchange rates, soaring raw material prices, and geopolitical developments in the Middle East; however, due mainly to a decline in the gross profit margin, operating profit and below are planned to decrease year on year in the first half. In the second half, the company expects most products to be renewed on a semiannual basis, in addition to the effects of specification changes and revised procurement methods implemented during the first half, and plans to absorb the impact of the first-half profit decline and achieve higher sales and profit.
| Item (¥ million) | FY3/26 Full Year | FY3/27 1H (Forecast) | FY3/27 2H (Forecast) | FY3/27 Full Year (Forecast) | Change | Change (%) |
|---|---|---|---|---|---|---|
| Net Sales | 120,533 | 61,800 | 67,200 | 129,000 | 8,466 | 7.0% |
| Development-Oriented Business Model | 69,808 | 35,850 | 39,150 | 75,000 | 5,191 | 7.4% |
| Wholesale Business Model | 47,818 | 24,400 | 26,300 | 50,700 | 2,881 | 6.0% |
| Others | 2,906 | 1,550 | 1,750 | 3,300 | 393 | 13.5% |
| Gross Profit | 36,198 | 18,300 | 19,500 | 37,800 | 1,601 | 4.4% |
| SG&A Expenses | 24,265 | 12,700 | 12,900 | 25,600 | 1,334 | 5.5% |
| Operating Profit | 11,933 | 5,600 | 6,600 | 12,200 | 266 | 2.2% |
| Ordinary Profit | 12,367 | 5,700 | 6,800 | 12,500 | 132 | 1.1% |
| Net Income | 8,643 | 3,900 | 4,650 | 8,550 | ▲ 93 | ▲ 1.1% |
Shareholder Returns
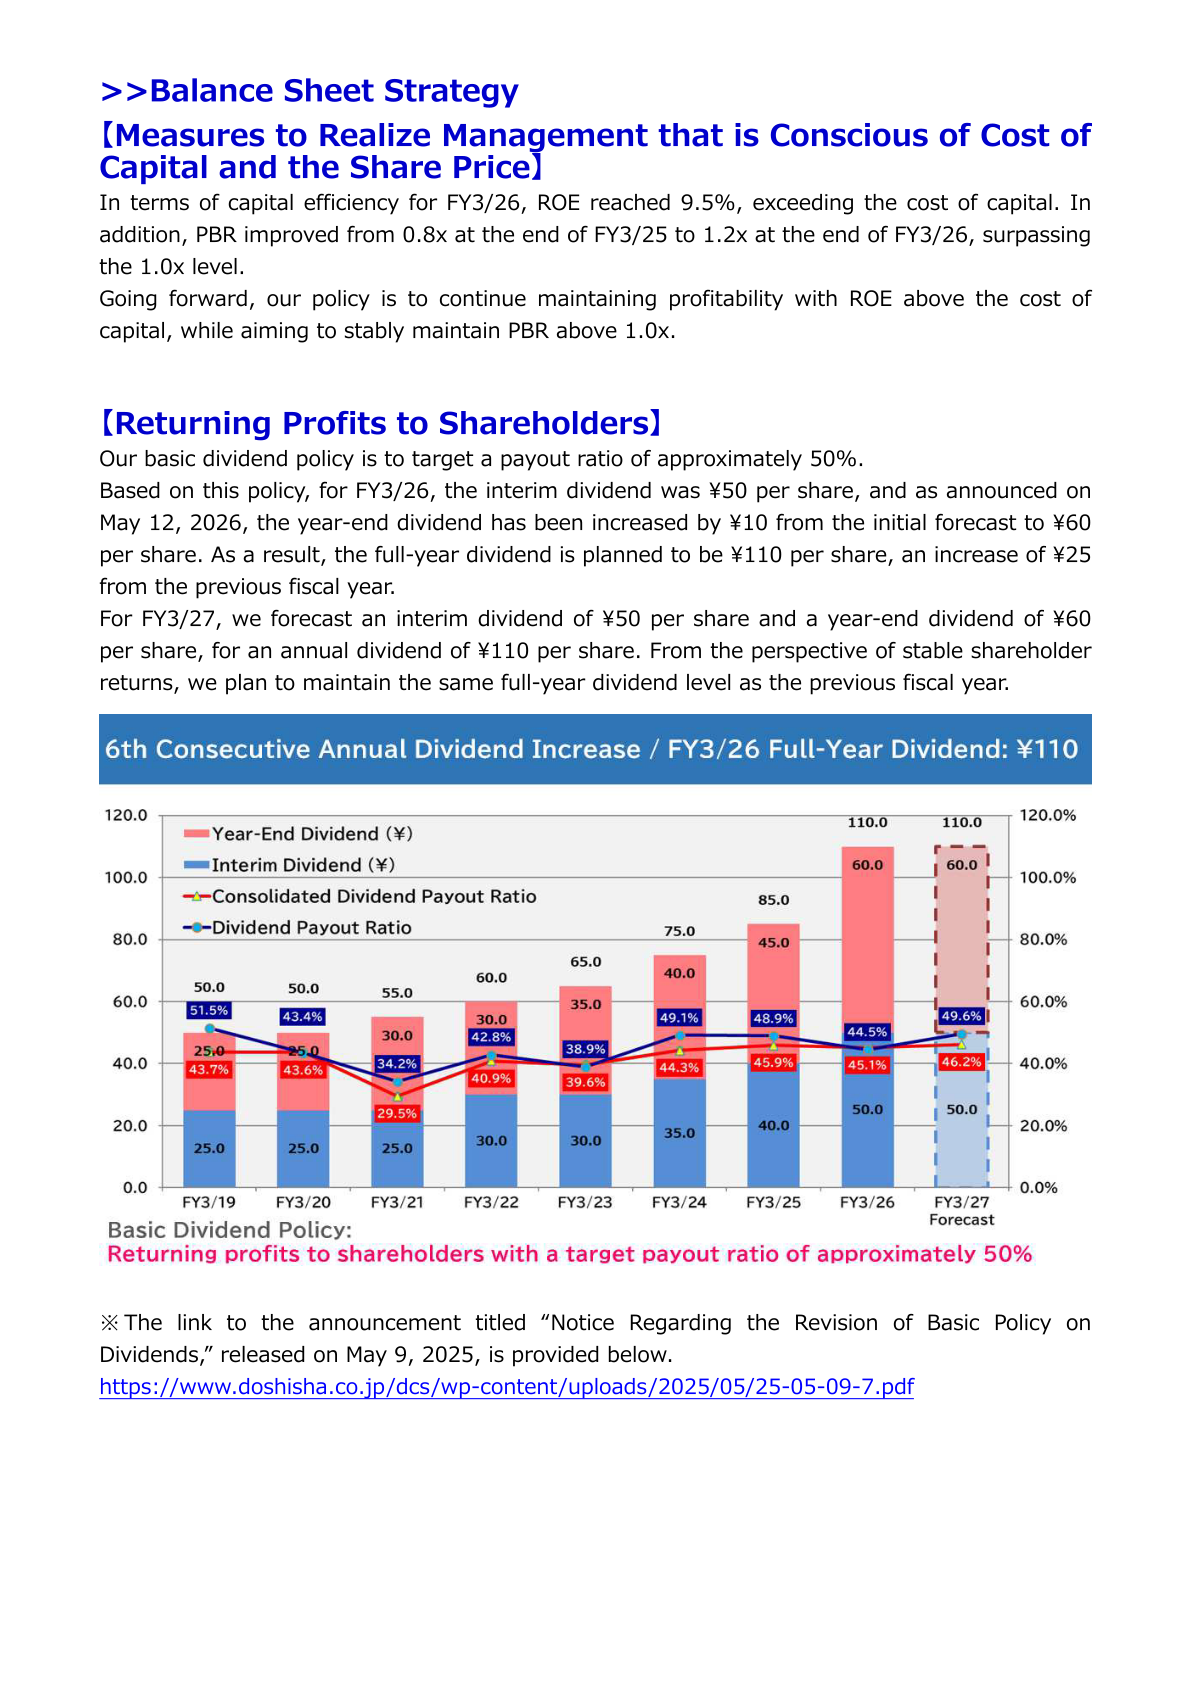
The company’s basic dividend policy is to target a payout ratio of approximately 50%. For FY3/26, the interim dividend was ¥50 per share, and as announced on May 12, 2026, the year-end dividend was increased by ¥10 from the initial forecast to ¥60 per share. As a result, the full-year dividend is planned to be ¥110 per share, an increase of ¥25 from the previous fiscal year and the sixth consecutive annual dividend increase. For FY3/27, the company forecasts an interim dividend of ¥50 per share and a year-end dividend of ¥60 per share, for an annual dividend of ¥110 per share, maintaining the same full-year dividend level as the previous fiscal year from the perspective of stable shareholder returns. On capital efficiency, ROE reached 9.5% in FY3/26, exceeding the cost of capital, and PBR improved from 0.8x at the end of FY3/25 to 1.2x at the end of FY3/26, surpassing the 1.0x level. The company’s policy is to continue maintaining profitability with ROE above the cost of capital while aiming to stably maintain PBR above 1.0x.
| Dividend per Share (¥) | FY3/25 | FY3/26 | FY3/27 (Forecast) |
|---|---|---|---|
| Interim Dividend | 40.0 | 50.0 | 50.0 |
| Year-End Dividend | 45.0 | 60.0 | 60.0 |
| Full Year | 85.0 | 110.0 | 110.0 |
Medium-Term Management Plan and Topics
Under the Medium-Term Management Plan covering FY3/23 to FY3/26, the company positioned the three strategies of “Growth Strategy,” “Balance Sheet Strategy,” and “ESG Strategy” as key strategic pillars, and worked toward achieving consolidated ordinary profit of ¥10.0 billion in FY3/26. Consolidated ordinary profit exceeded the target by 23%, reaching 123.7% of plan, or ¥2.3 billion above plan, with a CAGR of 14.0% over FY3/23–FY3/26. Consolidated ordinary profit moved from ¥7.5 billion in FY3/22 to ¥8.3 billion in FY3/23, ¥8.4 billion in FY3/24, ¥9.3 billion in FY3/25, and ¥12.3 billion in FY3/26 against a plan of ¥10.0 billion. As of March 31, 2026, the share price was ¥3,335 and PBR was 1.2x.
The company states that in FY3/26 it revised its earnings forecast upward twice and achieved a level of profitability that exceeded its initial expectations, which it recognizes not as a temporary upswing but as the result of an improvement in its earnings capacity. In FY3/27, it will operate based on this higher earnings level, establish it as its standard earnings capacity, and position the fiscal year as a period for transforming the business into a more sustainable earnings structure. Its medium- to long-term vision is expressed as “¥10 Billion × 30 Business Division,” pursuing the goal of “creating a one-of-a-kind company in the world.”
In the Development-Oriented Business Model, product development is being promoted based on two core concepts, “Creating Surprise” and “Refinement,” with the Gorilla Series as a representative example; the series surpassed cumulative sales of 3 million units in approximately two years and has expanded into multiple categories and series. In the Wholesale Business Model, the company is working toward evolving into a “Value-Creation Model,” strengthening the Gift Business along the two axes of “Reforming Existing Businesses” and “Developing Adjacent Businesses,” including year-round gifts, original branded sweets, and Furusato Nozei–related businesses, and combining its “Four Core Functions” with its “Four Business Portfolios” in the Famous Brands Business. Under the ESG Strategy, the company has established its “Sustainability Policy,” the framework to promote it, the “Five Materialities and Key Initiatives,” and the “Key Indicators Related to Our Human Capital Strategy.”
This article is an analysis based on publicly available information and is not a recommendation to buy or sell any specific securities. Investment decisions are your own responsibility.
















