
This article is based on publicly available IR materials and is not a recommendation to buy or sell any specific securities.
Note: the presentation labels the fiscal year ended March 31, 2026 as “FY3/26” and the current fiscal year as “FY3/27”; this article classifies the most recently completed fiscal year as FY2025 under our site convention, while all year labels in the text, tables and segment data below are kept exactly as they appear in the materials.
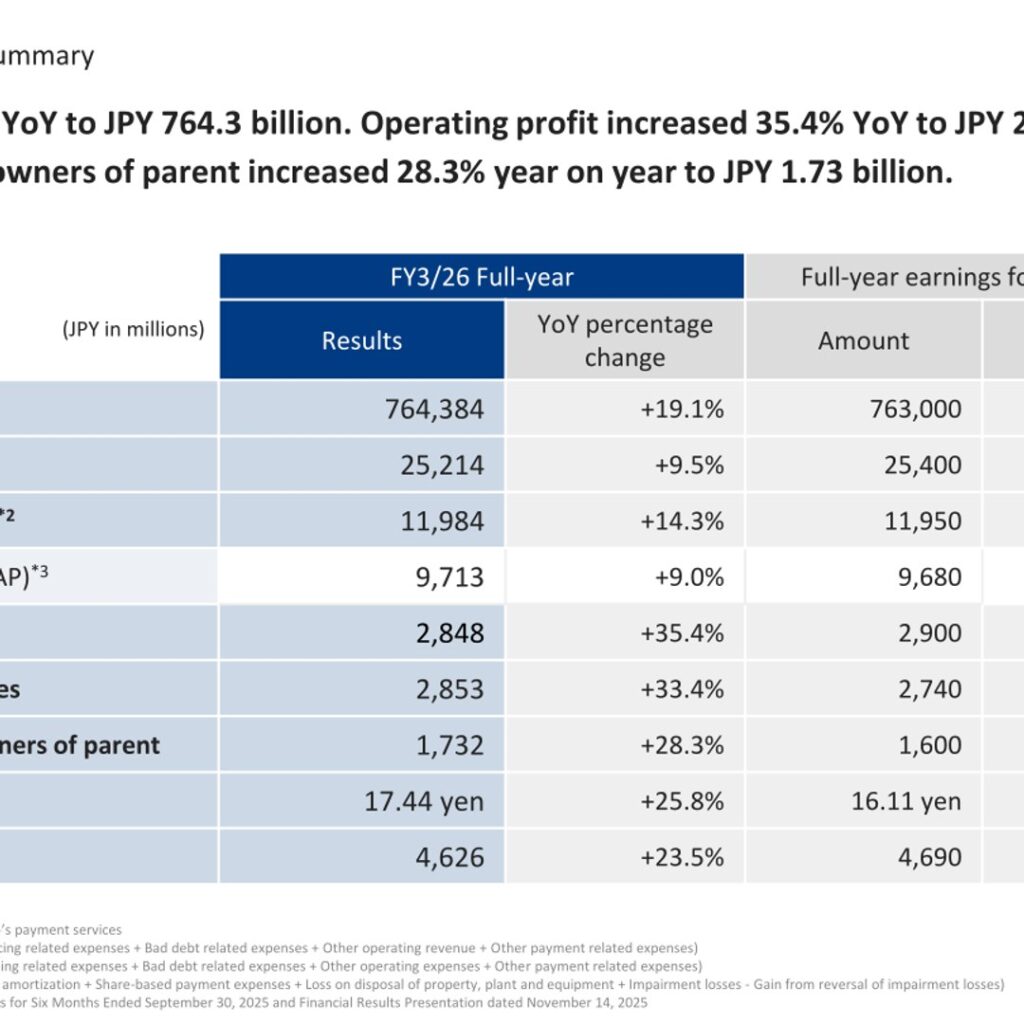
Net Protections Holdings, Inc. (TSE Prime Market: 7383), a BNPL (buy now, pay later) specialist operating NP Atobarai, atone and NP Kakebarai, reported FY3/26 GMV of JPY 764,384 million, up 19.1% year on year, and operating profit of JPY 2,848 million, up 35.4%. Total operating revenue rose 9.5% to JPY 25,214 million and gross profit (non-GAAP) rose 14.3% to JPY 11,984 million. Profit attributable to owners of parent increased 28.3% year on year to JPY 1,732 million. Against the full-year earnings forecast, GMV came in at 100.2% and operating profit at 98.2%.
Consolidated Results (Full-Year Actual)
The company presents GMV, gross profit, SG&A expenses and EBITDA as non-GAAP indicators alongside IFRS figures. GMV is defined as gross merchandise value for the Group’s payment services. Operating profit of JPY 2,848 million came in at 98.2% of the full-year earnings forecast, which the deck states is consistent with the Consolidated Financial Results for Six Months Ended September 30, 2025 and the Financial Results Presentation dated November 14, 2025. On the variance analysis slide, the JPY 2.90 billion forecast moved to the JPY 2.84 billion actual result via -0.23 from change in take rate, +0.22 from change in cost ratio to GMV, +0.02 from growth of atone, and -0.06 from change in SG&A expenses and other operating expenses.
| Item (JPY in millions) | FY3/26 Full-year Results | YoY percentage change | Full-year earnings forecast | Achieved |
|---|---|---|---|---|
| GMV (non-GAAP) | 764,384 | +19.1% | 763,000 | 100.2% |
| Total operating revenue | 25,214 | +9.5% | 25,400 | 99.3% |
| Gross profit (non-GAAP) | 11,984 | +14.3% | 11,950 | 100.3% |
| SG&A expenses (non-GAAP) | 9,713 | +9.0% | 9,680 | 100.4% |
| Operating profit | 2,848 | +35.4% | 2,900 | 98.2% |
| Profit before income taxes | 2,853 | +33.4% | 2,740 | 104.2% |
| Profit attributable to owners of parent | 1,732 | +28.3% | 1,600 | 108.3% |
| Basic earnings per share | 17.44 yen | +25.8% | 16.11 yen | 108.3% |
| EBITDA (non-GAAP) | 4,626 | +23.5% | 4,690 | 98.7% |
Results by Service
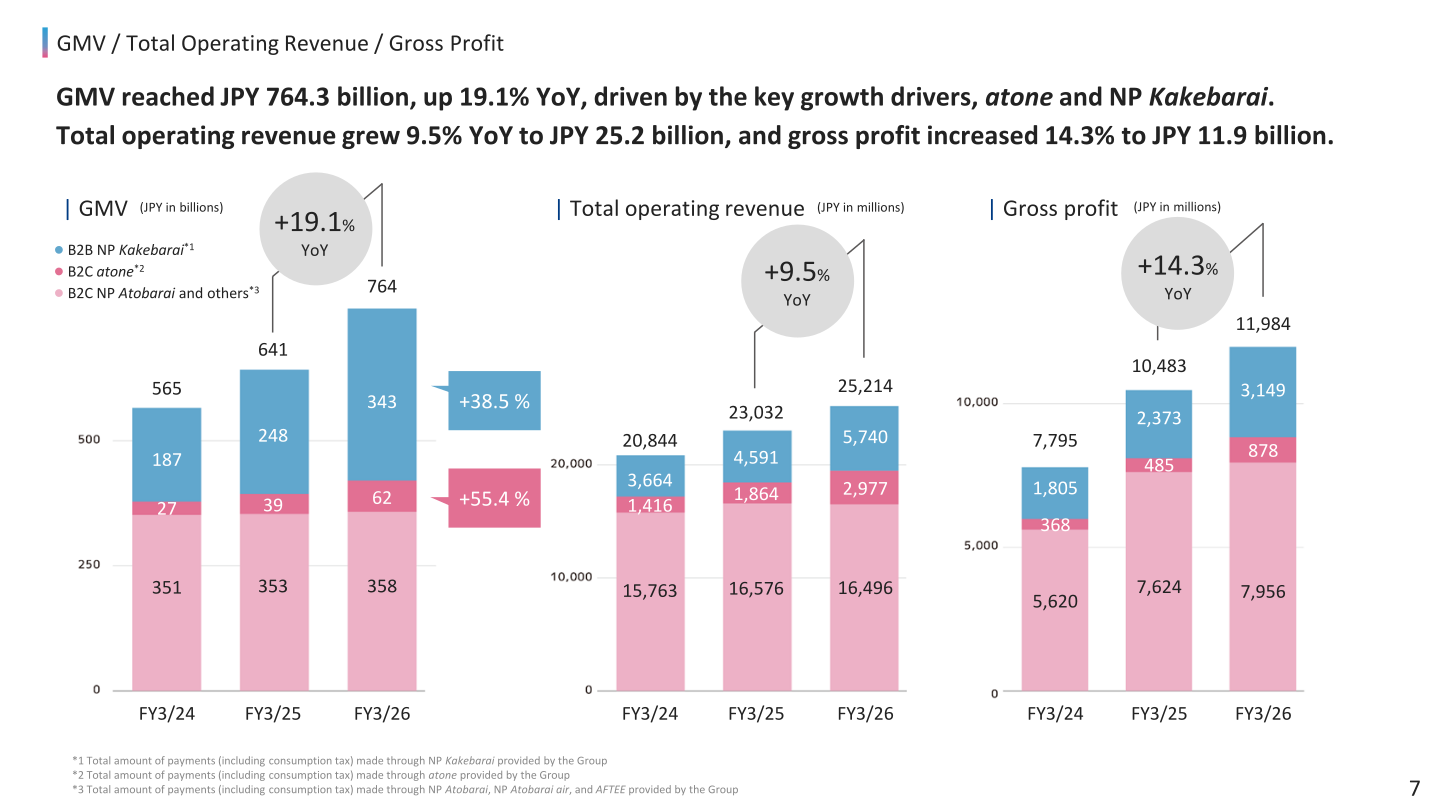
GMV growth was led by the two growth drivers, atone and NP Kakebarai. B2C atone GMV rose 55.4% to JPY 62,090 million and B2B NP Kakebarai GMV rose 38.5% to JPY 343,868 million, while B2C NP Atobarai and others GMV rose 1.3% to JPY 358,425 million. On the highlights slide the company describes NP Atobarai and others as a stable cash cow whose GMV tracked in line with plan and which consistently generates gross profit, with full-year gross profit of JPY 7.95 billion, up 4.4% year on year. In Q4 FY3/26, GMV was JPY 193,557 million (up 18.3%), total operating revenue JPY 6,254 million (up 8.7%) and gross profit JPY 2,891 million (up 9.4%).
| Item (JPY in millions) | Fiscal year ended March 31, 2026 | Fiscal year ended March 31, 2025 | Percentage change |
|---|---|---|---|
| GMV (non-GAAP) | 764,384 | 641,950 | 19.1 |
| B2C Services: NP Atobarai and others | 358,425 | 353,716 | 1.3 |
| B2C Services: atone | 62,090 | 39,966 | 55.4 |
| B2B Service | 343,868 | 248,267 | 38.5 |
| Total operating revenue | 25,214 | 23,032 | 9.5 |
| B2C Services: NP Atobarai and others | 16,496 | 16,576 | (0.5) |
| B2C Services: atone | 2,977 | 1,864 | 59.7 |
| B2B Service | 5,740 | 4,591 | 25.0 |
| Gross profit (non-GAAP) | 11,984 | 10,483 | 14.3 |
| B2C Services: NP Atobarai and others | 7,956 | 7,624 | 4.4 |
| B2C Services: atone | 878 | 485 | 81.0 |
| B2B Service | 3,149 | 2,373 | 32.7 |
| Operating profit (loss) | 2,848 | 2,103 | 35.4 |
| EBITDA (non-GAAP) | 4,626 | 3,747 | 23.5 |
FY3/27 Forecast
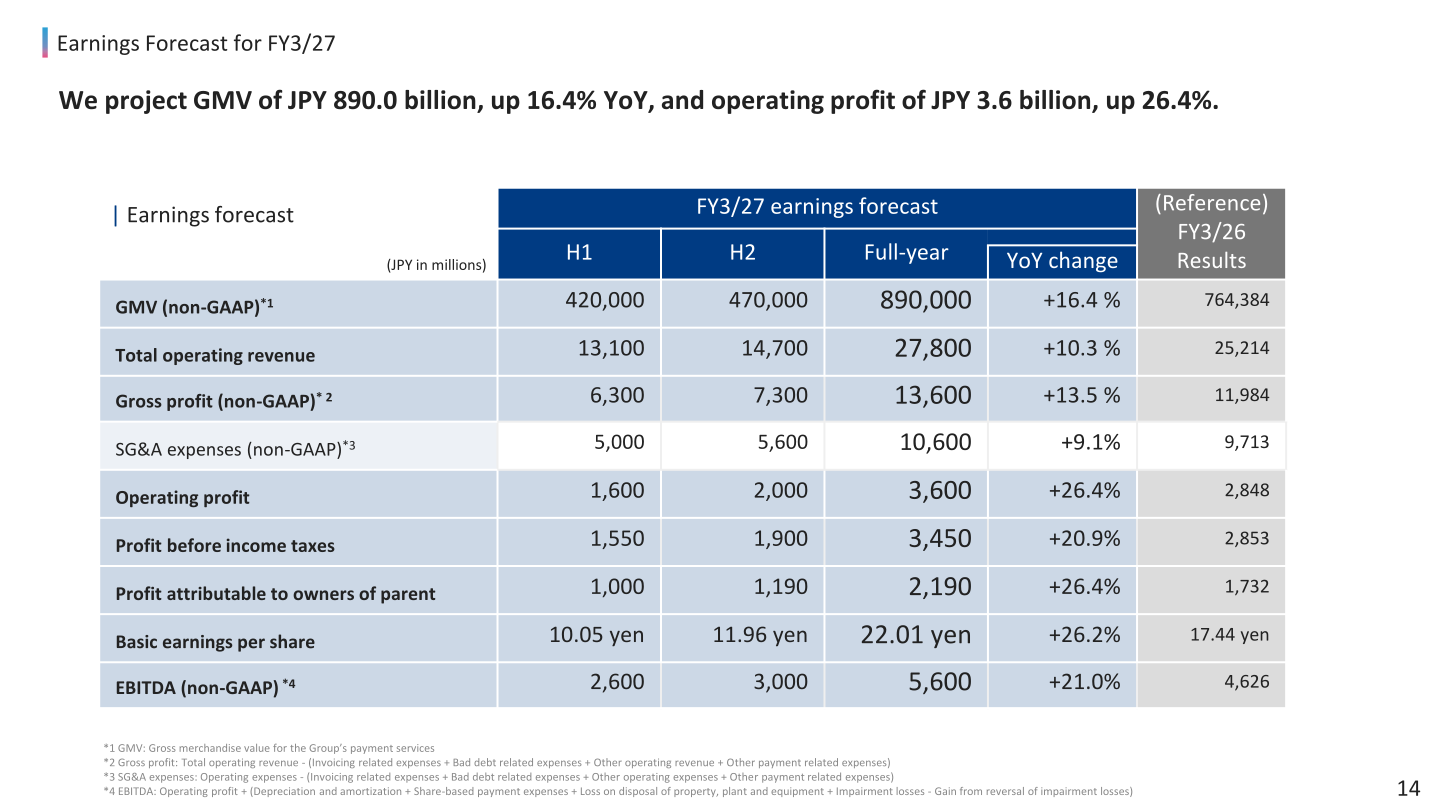
For FY3/27 the company projects GMV of JPY 890,000 million, up 16.4% year on year, and operating profit of JPY 3,600 million, up 26.4%. Total operating revenue is forecast at JPY 27,800 million (up 10.3%) and profit attributable to owners of parent at JPY 2,190 million (up 26.4%), with basic earnings per share of 22.01 yen.
| Item (JPY in millions) | FY3/27 H1 | FY3/27 H2 | FY3/27 Full-year | YoY change | (Reference) FY3/26 Results |
|---|---|---|---|---|---|
| GMV (non-GAAP) | 420,000 | 470,000 | 890,000 | +16.4 % | 764,384 |
| Total operating revenue | 13,100 | 14,700 | 27,800 | +10.3 % | 25,214 |
| Gross profit (non-GAAP) | 6,300 | 7,300 | 13,600 | +13.5 % | 11,984 |
| SG&A expenses (non-GAAP) | 5,000 | 5,600 | 10,600 | +9.1% | 9,713 |
| Operating profit | 1,600 | 2,000 | 3,600 | +26.4% | 2,848 |
| Profit before income taxes | 1,550 | 1,900 | 3,450 | +20.9% | 2,853 |
| Profit attributable to owners of parent | 1,000 | 1,190 | 2,190 | +26.4% | 1,732 |
| Basic earnings per share | 10.05 yen | 11.96 yen | 22.01 yen | +26.2% | 17.44 yen |
| EBITDA (non-GAAP) | 2,600 | 3,000 | 5,600 | +21.0% | 4,626 |
Shareholder Returns and Financial Policy
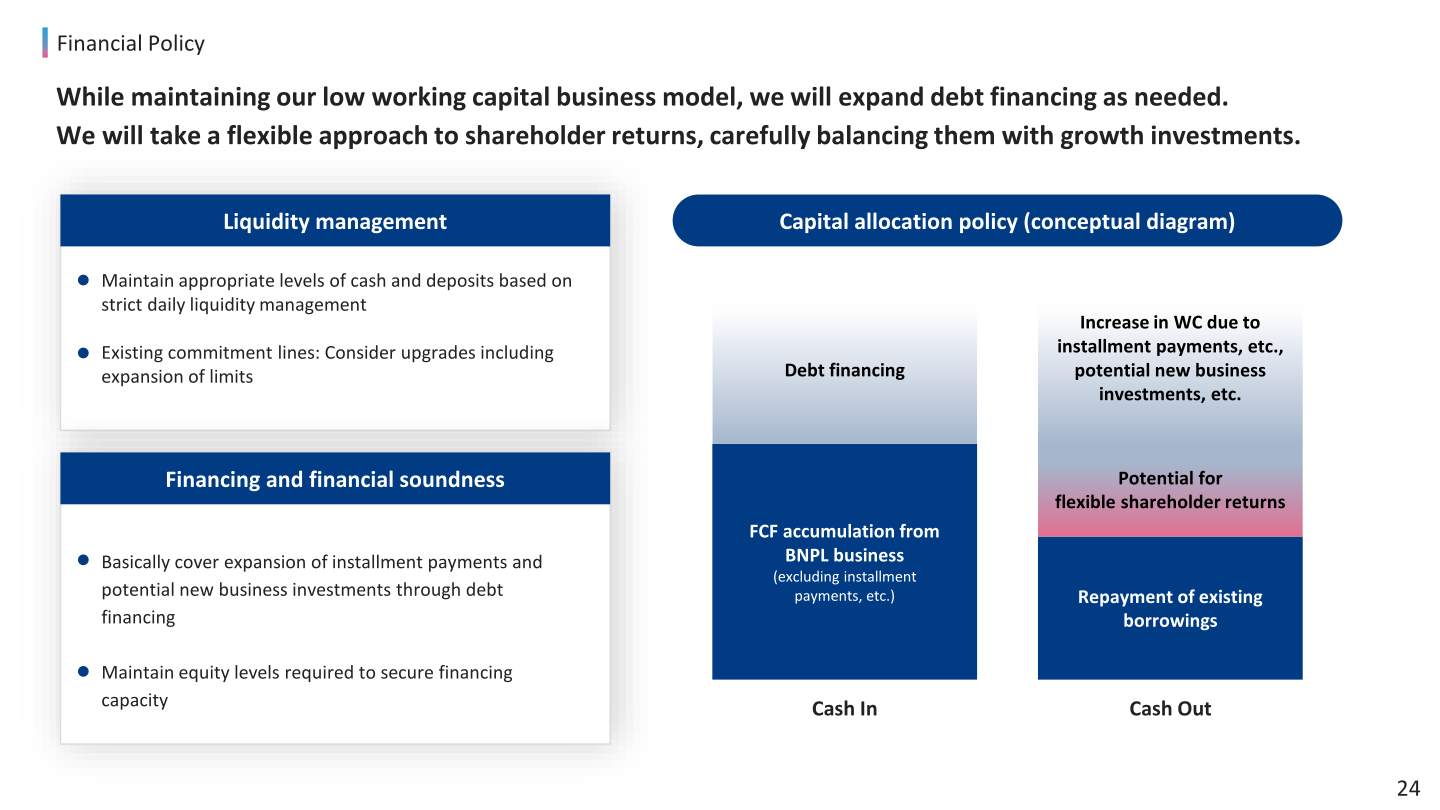
The financial policy slide states that, while maintaining its low working capital business model, the company will expand debt financing as needed, and that it will take a flexible approach to shareholder returns, carefully balancing them with growth investments. In the capital allocation diagram, cash in consists of FCF accumulation from the BNPL business (excluding installment payments, etc.) and debt financing, while cash out covers repayment of existing borrowings, an increase in working capital due to installment payments and potential new business investments, and the potential for flexible shareholder returns. On liquidity management the company will maintain appropriate levels of cash and deposits based on strict daily liquidity management and consider upgrades to existing commitment lines including expansion of limits, and it will maintain equity levels required to secure financing capacity. A specific dividend amount or payout policy cannot be confirmed from the materials.
Medium-Term Management Policy
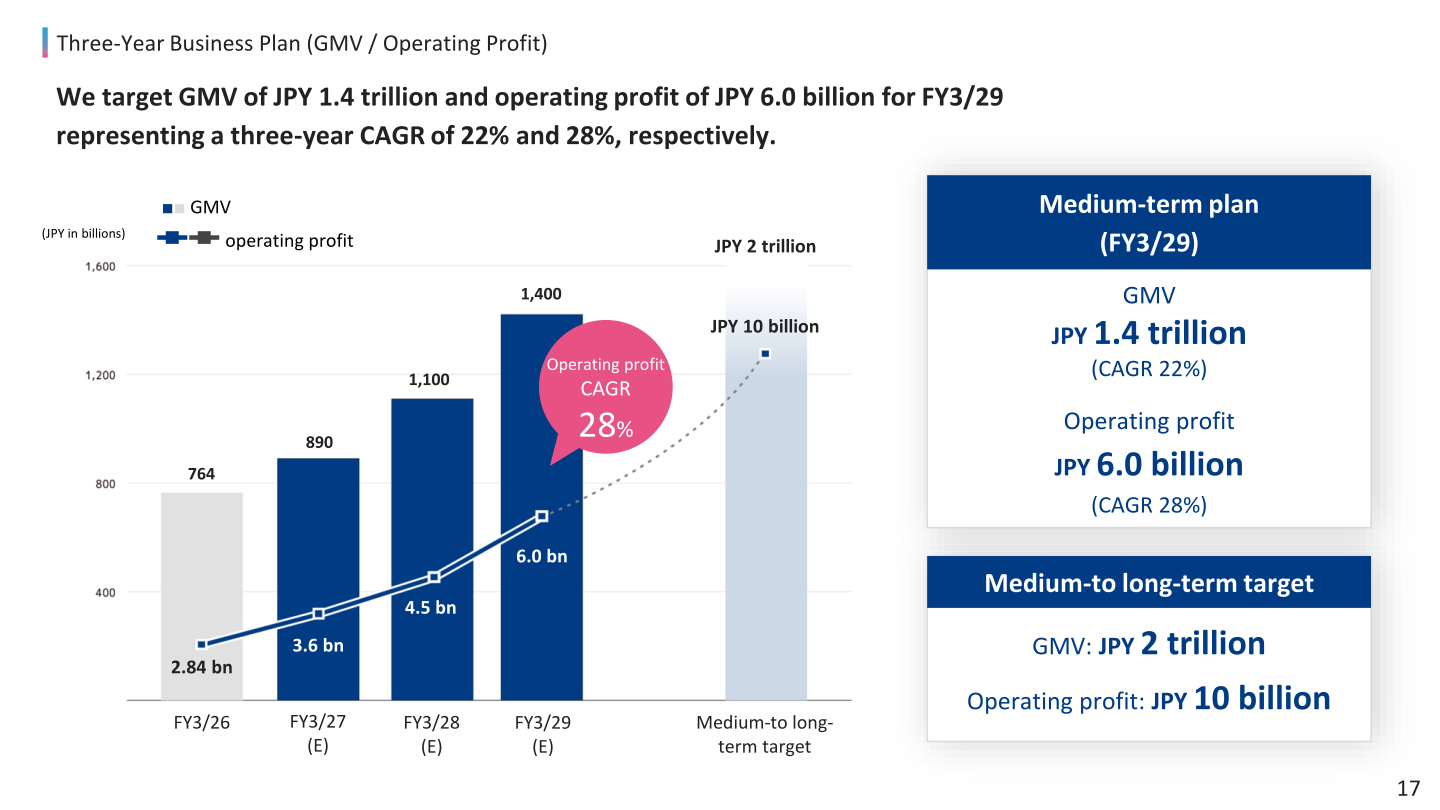
Under its three-year business plan covering FY3/27 to FY3/29, the company targets GMV of JPY 1.4 trillion and operating profit of JPY 6.0 billion for FY3/29, representing a three-year CAGR of 22% and 28% respectively. Its medium-to long-term target is GMV of JPY 2 trillion and operating profit of JPY 10 billion. By service, GMV CAGR targets are approximately 60% for atone, 25% for NP Kakebarai and 10% for NP Atobarai and others, with total operating revenue and gross profit both expected to achieve a CAGR of approximately 15%.
| Item | FY3/26 | FY3/27 (E) | FY3/28 (E) | FY3/29 (E) |
|---|---|---|---|---|
| GMV (JPY in billions) | 764 | 890 | 1,100 | 1,400 |
| Operating profit | 2.84 bn | 3.6 bn | 4.5 bn | 6.0 bn |
Topics
On the revenue structure slide the company notes that while the take rate is trending downward due to the shift in the revenue mix driven by rapid B2B growth, lower invoicing and bad debt related expenses offset this impact, keeping its KPI of gross profit margin to GMV at a high level; for FY3/26 Q4 the slide shows gross profit margin to GMV of 1.49%, bad debt related expenses to GMV of 0.51% and invoicing related expenses to GMV of 1.06%. The strengths slide shows a credit approval rate of 95% for NP Atobarai and NP Atobarai air during FY3/26, proprietary transaction data of 650 million as of March 31, 2026, and delinquency rates of 0.59% for B2B and 0.32% for B2C. Group GMV for FY3/26 was JPY 764.3 billion and the company reports 336 employees at the operating company as of March 31, 2026.
This article is an analysis based on publicly available information and is not a recommendation to buy or sell any specific securities. Investment decisions are your own responsibility.
![[Obayashi] Investors’ Guide 2026 — The Complete 24-Article Breakdown](https://japan-equity.com/wp-content/uploads/2026/07/hub_cover-1024x1024.png)
![[Obayashi] IR & SR Policy — Feeding Dialogue Back into Management](https://japan-equity.com/wp-content/uploads/2026/07/p32_sq-1024x1024.jpg)
![[Obayashi] Domestic Civil Engineering — Resilience Spending Supports 9.6% Margin](https://japan-equity.com/wp-content/uploads/2026/07/p11_sq-1024x1024.jpg)
![[Obayashi] Overseas Construction — Orders Reach ¥1.2tn](https://japan-equity.com/wp-content/uploads/2026/07/p15_sq-1024x1024.jpg)
![[Obayashi] Share Price & External Ratings — vs TOPIX, ESG Index Inclusion](https://japan-equity.com/wp-content/uploads/2026/07/p40_sq-1024x1024.jpg)
![[Construction] ¥75.5tn Investment, Shrinking Workforce — Big-5 Market Share](https://japan-equity.com/wp-content/uploads/2026/07/p12_sq-1024x1024.jpg)



![[Obayashi] Capital Policy & Shareholder Returns — ROE 10%+, DOE ~5%, ¥100bn Buyback](https://japan-equity.com/wp-content/uploads/2026/07/p27_sq-1024x1024.jpg)
![[Obayashi] Reducing Cross-Shareholdings — ¥285.2bn Sold in Five Years](https://japan-equity.com/wp-content/uploads/2026/07/p29_sq-1024x1024.jpg)
![[Obayashi] ¥750bn Investment Plan — ¥300bn to Development, ¥190bn to Tech/DX](https://japan-equity.com/wp-content/uploads/2026/07/p30_sq-1024x1024.jpg)
![[Obayashi] MTP2022 KPIs — Operating Profit ~2x Target, ROE 14.4%](https://japan-equity.com/wp-content/uploads/2026/07/p25_sq-1024x1024.jpg)
![[Obayashi] Cash Allocation — ¥420bn Investment CF Over Five Years](https://japan-equity.com/wp-content/uploads/2026/07/p26_sq-1024x1024.jpg)
![[Obayashi] Green Energy — 44 Plants, 344MW, and the Green Hydrogen Challenge](https://japan-equity.com/wp-content/uploads/2026/07/p21_sq-1024x1024.jpg)
![[Obayashi] Tackling the Labor Shortage — Robotics Construction®](https://japan-equity.com/wp-content/uploads/2026/07/p14_sq-1024x1024.jpg)
