
This article is based on publicly available IR materials and is not a recommendation to buy or sell any specific securities.
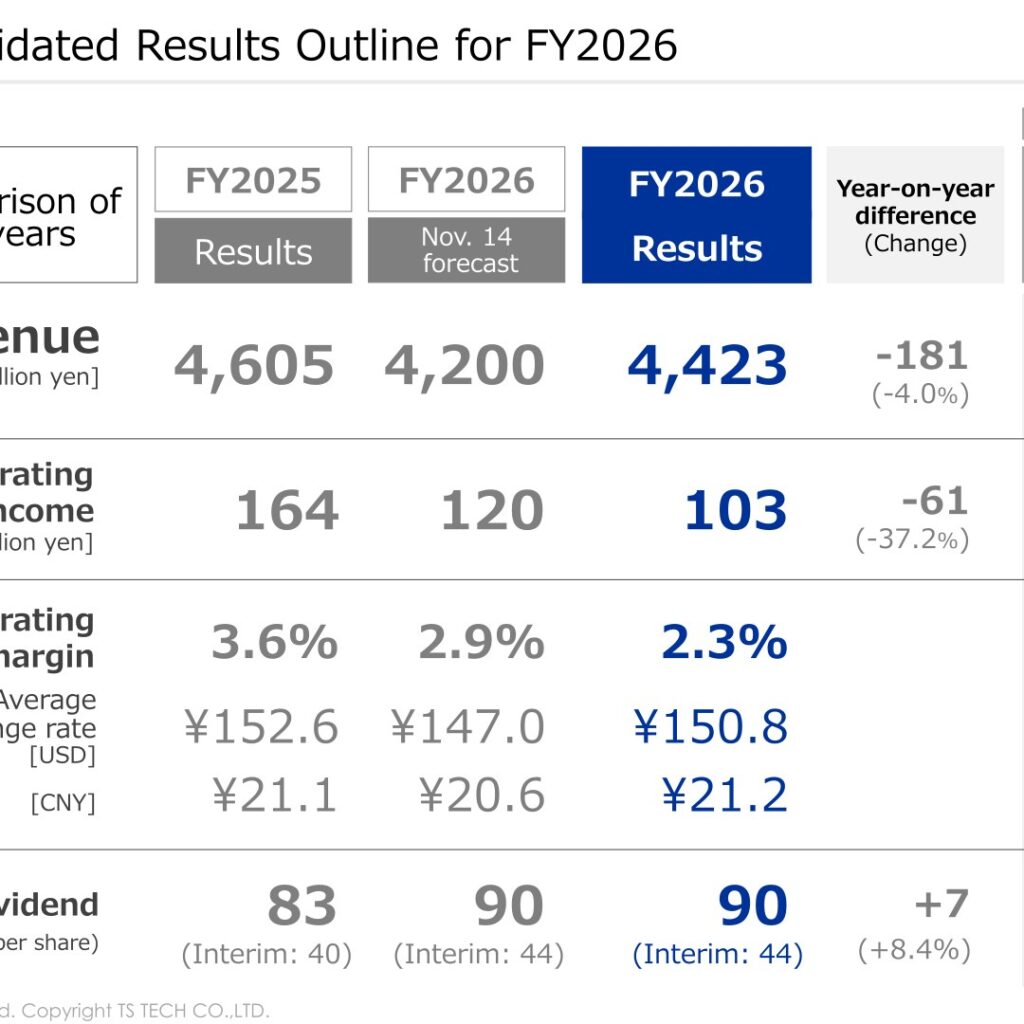
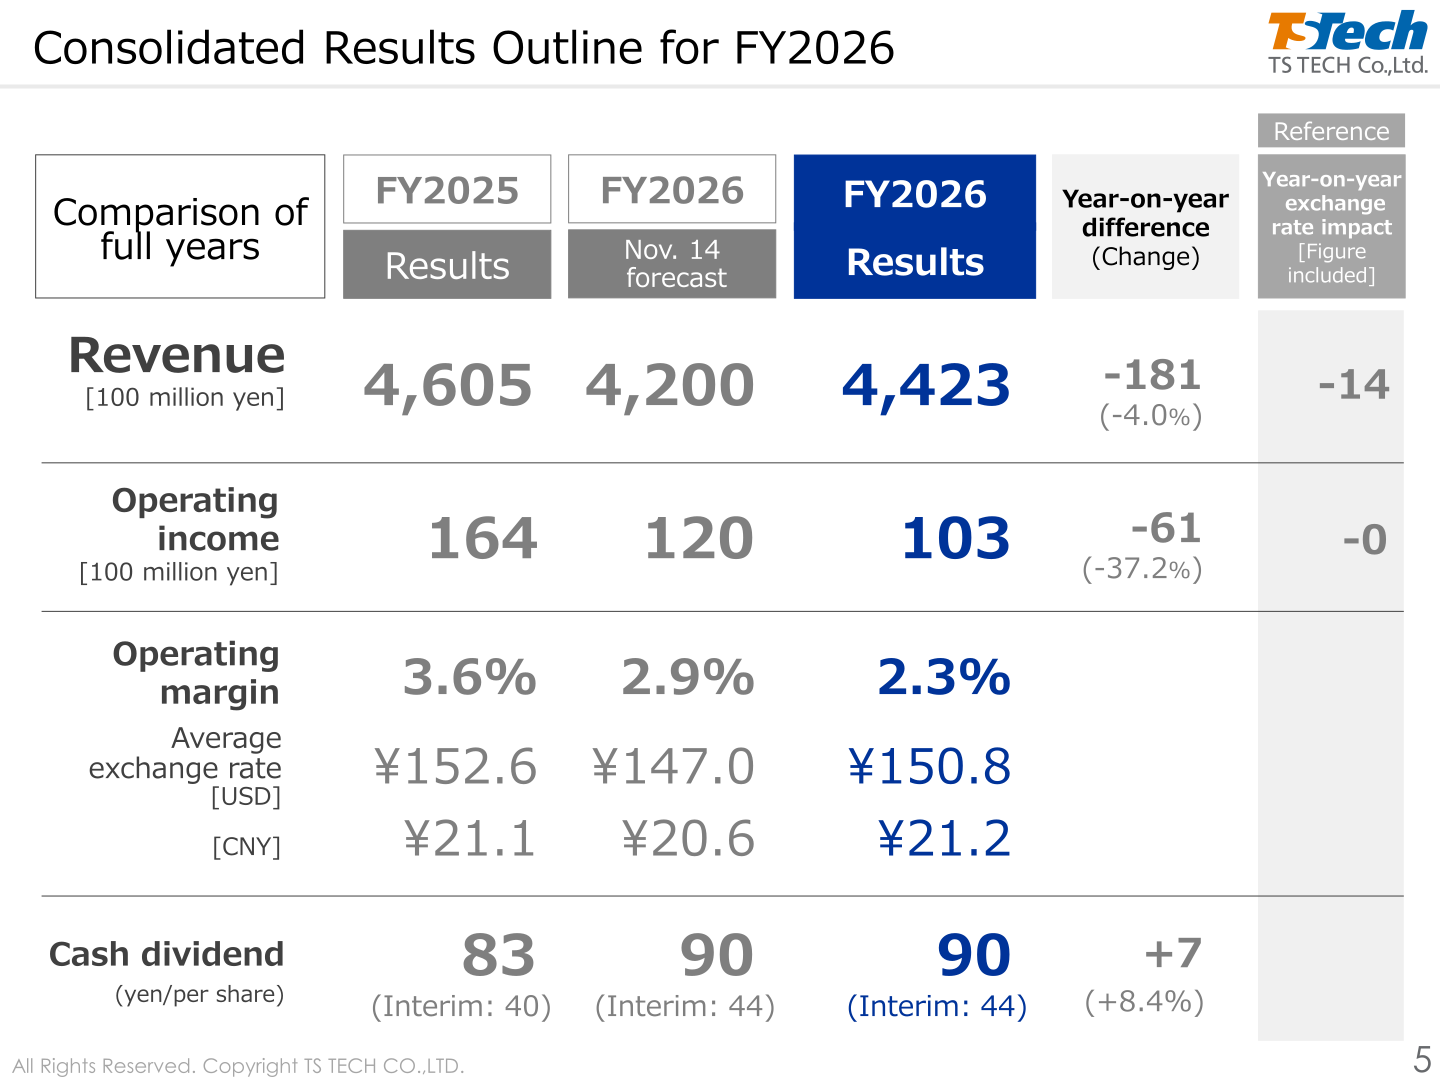
Note on fiscal-year labels: TS TECH calls the fiscal year ended March 31, 2026 “FY2026” and the preceding year “FY2025,” while this site classifies the most recently completed full year as FY2025. All figures, tables and labels below follow the company’s own notation. For the year ended March 31, 2026 (FY2026), TS TECH reported revenue of 4,423 [100 million yen], down 181 (-4.0%) year on year, and operating income of 103 [100 million yen], down 61 (-37.2%), for an operating margin of 2.3% versus 3.6% a year earlier. Income attributable to owners of parent was 71.3 [100 million yen], down 14.9 (-17.3%). The cash dividend was raised by ¥7 to ¥90 per share (interim: 44). For FY2027 the company forecasts revenue of 4,400 [100 million yen] and operating income of 130 [100 million yen] (+25.9%), with a dividend of ¥92 per share.
Consolidated Results (Full-Year Actual)
Revenue decreased due primarily to the impact of lower production for major customers, offsetting higher sales to other customers. Income decreased due primarily to the impact of lower production and higher expenses, offsetting cost-cutting efforts. Against the November 14 forecast of revenue 4,200 and operating income 120 [100 million yen], revenue came in 223.1 higher (+5.3%) while operating income was 16.7 lower (-14.0%); the company attributes the revenue beat to exchange rate effects and higher tooling sales, and the operating income shortfall to temporary expenses. Average exchange rates for the year were ¥150.8 to the USD and ¥21.2 to the CNY.
| Item | FY2025 Results | FY2026 Results | Difference | Change |
|---|---|---|---|---|
| Revenue [100 million yen] | 4,605.1 | 4,423.1 | -181.9 | -4.0% |
| Operating income [100 million yen] | 164.2 | 103.2 | -61.0 | -37.2% |
| Operating margin | 3.6% | 2.3% | – | – |
| Income attributable to owners of parent [100 million yen] | 86.3 | 71.3 | -14.9 | -17.3% |
| Capital investment [100 million yen] | 216.5 | 212.2 | -4.2 | -1.9% |
| Depreciation [100 million yen] | 124.8 | 126.0 | +1.1 | +0.9% |
| R&D expenses [100 million yen] | 194.9 | 141.2 | -53.7 | -27.6% |
| Average exchange rate [USD] | ¥152.6 | ¥150.8 | – | – |
| Average exchange rate [CNY] | ¥21.1 | ¥21.2 | – | – |
| Cash dividends per share | ¥83 | ¥90 | +7 | +8.4% |
Segment Results
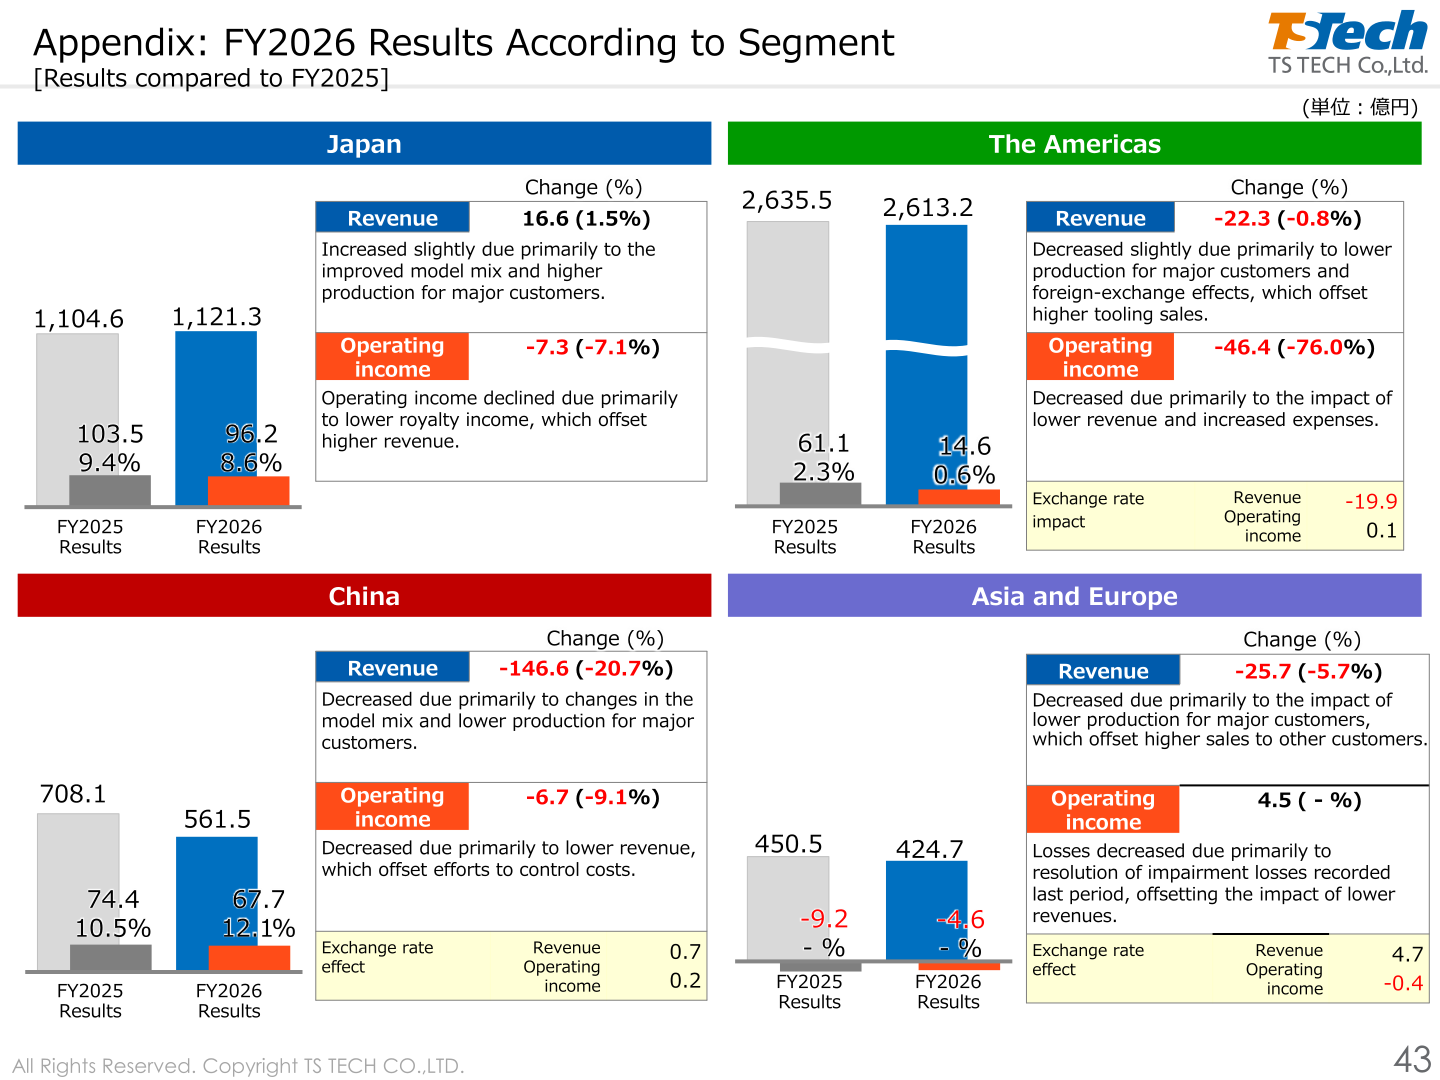
By region, Japan revenue rose 16.6 (1.5%) on an improved model mix and higher production for major customers, while operating income declined 7.3 (-7.1%) due primarily to lower royalty income. The Americas saw revenue slip 22.3 (-0.8%) and operating income fall 46.4 (-76.0%) on lower revenue and increased expenses. China revenue fell 146.6 (-20.7%) on changes in the model mix and lower production for major customers, with operating income down 6.7 (-9.1%), though the operating margin improved to 12.1%. In Asia and Europe, revenue declined 25.7 (-5.7%) but the operating loss narrowed by 4.5 due primarily to the resolution of impairment losses recorded in the previous period.
| Segment | Metric | FY2025 Results | FY2026 Results | Change |
|---|---|---|---|---|
| Japan | Revenue [100 million yen] | 1,104.6 | 1,121.3 | 16.6 (1.5%) |
| Japan | Operating income [100 million yen] | 103.5 | 96.2 | -7.3 (-7.1%) |
| Japan | Operating margin | 9.4% | 8.6% | – |
| The Americas | Revenue [100 million yen] | 2,635.5 | 2,613.2 | -22.3 (-0.8%) |
| The Americas | Operating income [100 million yen] | 61.1 | 14.6 | -46.4 (-76.0%) |
| The Americas | Operating margin | 2.3% | 0.6% | – |
| China | Revenue [100 million yen] | 708.1 | 561.5 | -146.6 (-20.7%) |
| China | Operating income [100 million yen] | 74.4 | 67.7 | -6.7 (-9.1%) |
| China | Operating margin | 10.5% | 12.1% | – |
| Asia and Europe | Revenue [100 million yen] | 450.5 | 424.7 | -25.7 (-5.7%) |
| Asia and Europe | Operating income [100 million yen] | -9.2 | -4.6 | 4.5 ( – %) |
| Asia and Europe | Operating margin | – % | – % | – |
FY2027 Forecast
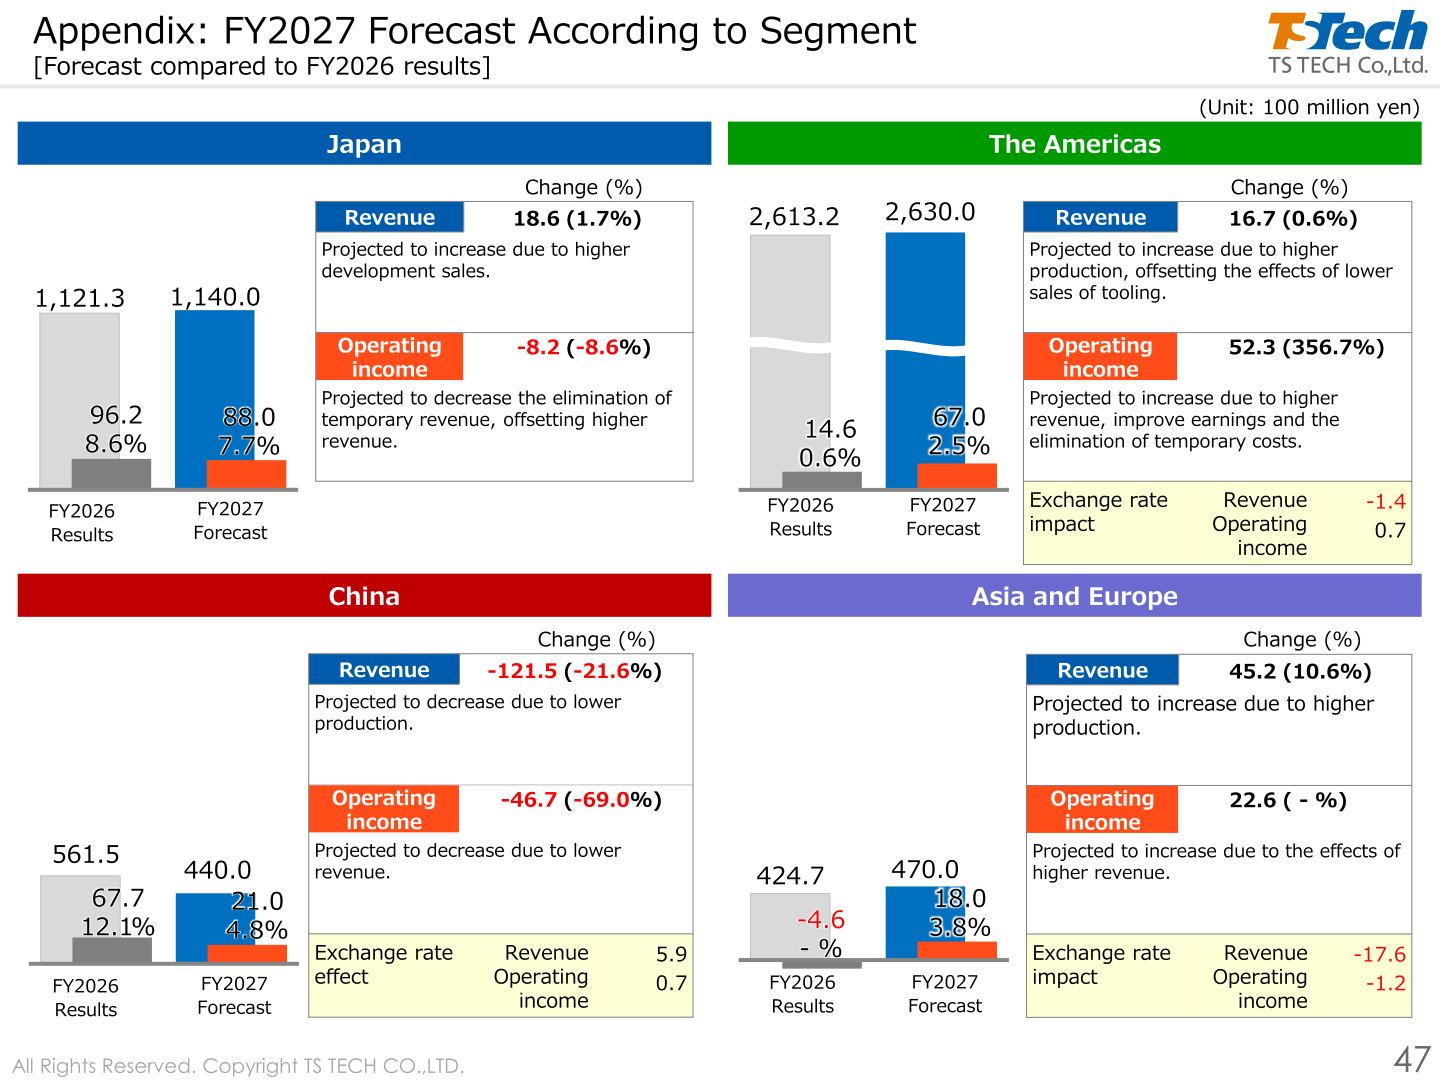
For FY2027 the company projects revenue of 4,400.0 [100 million yen], down 23.1 (-0.5%), due to lower sales of tooling, and operating income of 130.0 [100 million yen], up 26.7 (+25.9%), as activities to improve earnings offset the lower revenue. The operating margin is projected at 3.0%, and income attributable to owners of parent at 80.0 [100 million yen] (+12.1%). Assumed average exchange rates are ¥150.0 to the USD and ¥21.5 to the CNY. By segment, The Americas operating income is projected to rise 52.3 (356.7%) to 67.0 on higher revenue, improved earnings and the elimination of temporary costs, while China operating income is projected to fall 46.7 (-69.0%) to 21.0 on lower production.
| Item | FY2026 Results | FY2027 Forecast | Difference | Change |
|---|---|---|---|---|
| Revenue [100 million yen] | 4,423.1 | 4,400.0 | -23.1 | -0.5% |
| Operating income [100 million yen] | 103.2 | 130.0 | 26.7 | 25.9% |
| Operating margin | 2.3% | 3.0% | – | – |
| Income attributable to owners of parent [100 million yen] | 71.3 | 80.0 | 8.6 | 12.1% |
| Capital investment [100 million yen] | 212.2 | 245.0 | +32.7 | +15.4% |
| Depreciation [100 million yen] | 126.0 | 130.0 | +3.9 | +3.1% |
| R&D expenses [100 million yen] | 141.2 | 140.0 | -1.2 | -0.9% |
| Average exchange rate [USD] | ¥150.8 | ¥150.0 | – | – |
| Average exchange rate [CNY] | ¥21.2 | ¥21.5 | – | – |
| Cash dividends per share | ¥90 | ¥92 | +2 | +2.2% |
Shareholder Returns
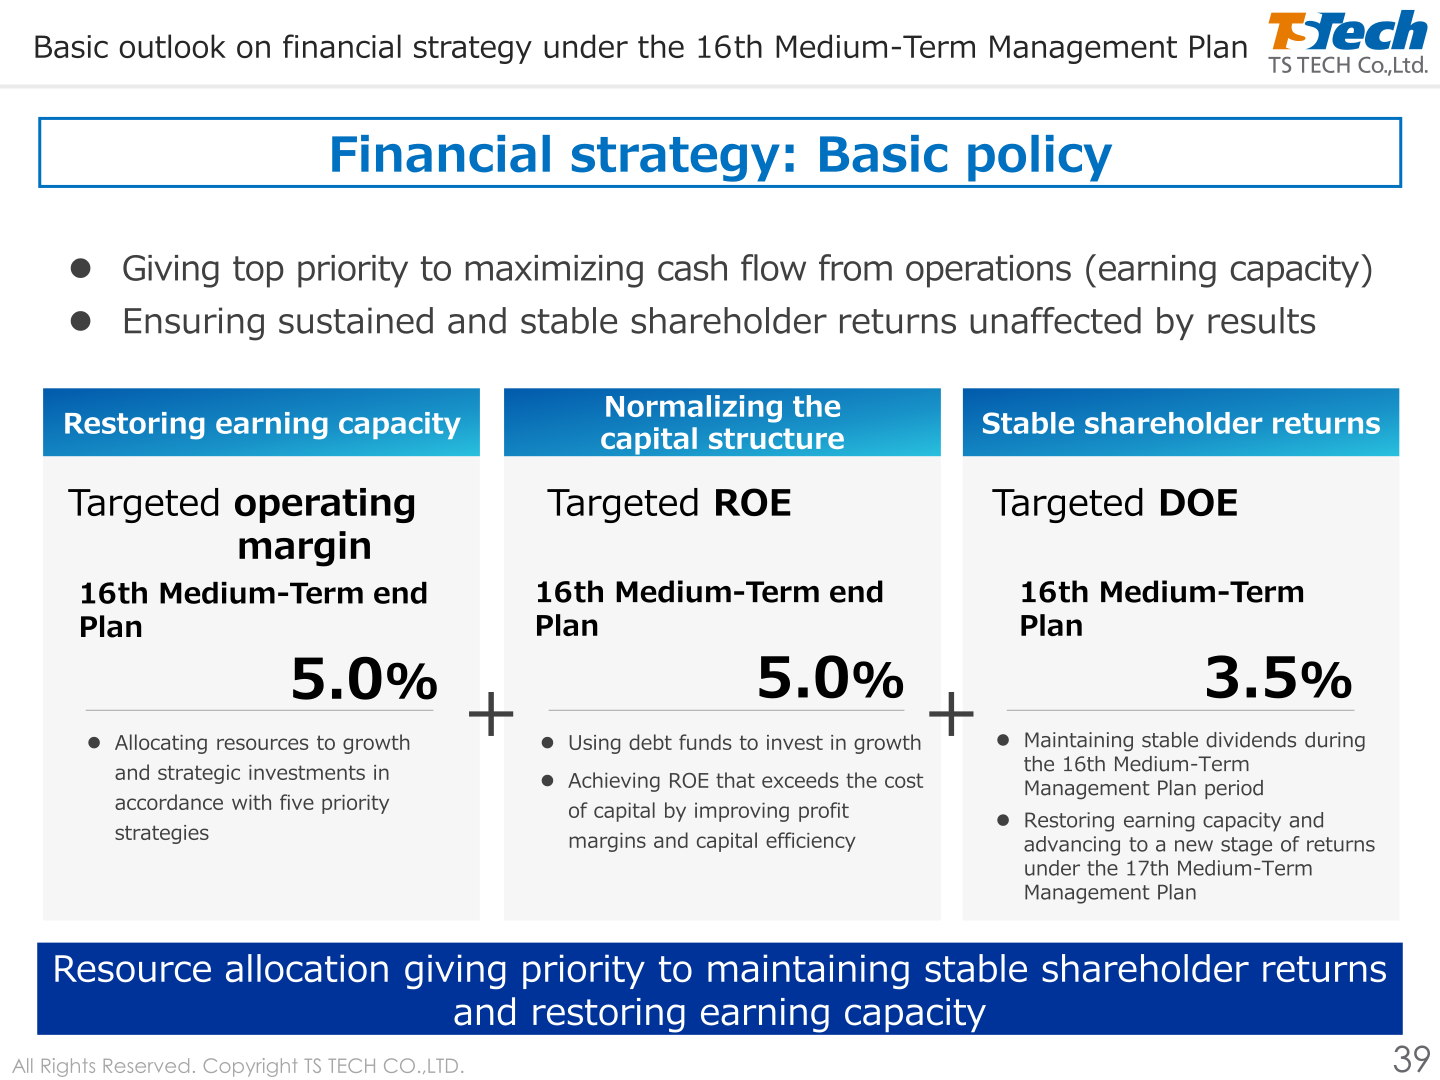
The cash dividend for FY2026 was ¥90 per share (interim: 44), up ¥7 (+8.4%) from ¥83 in FY2025, and the company forecasts ¥92 per share (interim: 46) for FY2027, an increase of ¥2 (+2.2%). Under the financial strategy for the 16th Medium-Term Management Plan, the company states that it will give top priority to maximizing cash flow from operations and ensure sustained and stable shareholder returns unaffected by results, with a targeted DOE of 3.5% for the 16th Medium-Term Management Plan period. It also states it will maintain stable dividends during the plan period and advance to a new stage of returns under the 17th Medium-Term Management Plan, and lists stable dividends and DOE of 3.5% or higher, plus expansion and dynamic acquisition of treasury stock, in its cash allocation concept.
Medium-Term Plan and Topics
FY2026 was the final year of the 15th Medium-Term Management Plan (April 2023-March 2026). Against the plan announced on May 12, 2023, revenue finished 376 short, operating income 336 short and ROE 6.2 points short, while shareholder returns were implemented according to plan: DOE of 3.4% against a 3.5% plan and cumulative acquisition of treasury stock of 200 [100 million yen], in line with the 200 planned. The company sums this up as “Shareholder returns were implemented according to plan while certain profitability issues remain.”
| Item | Plans (announced May 12, 2023) | Actual results (FY2026) | Difference |
|---|---|---|---|
| Revenue [100 million yen] | 4,800 | 4,423 | -376 |
| Operating income [100 million yen] | 440 | 103 | -336 |
| Profit margin [%] | 9.2 | 2.3 | -6.9 |
| ROE [%] | 8.5 | 2.3 | -6.2 |
| DOE [%] | 3.5 | 3.4 | -0.1 |
| Acquisition of treasury stock [100 million yen] (cumulative) | 200 | 200 | – |
The 16th Medium-Term Management Plan (April 2026-March 2029) is positioned as an interim phase to strengthen the earnings structure toward industry-leading operating margins under the management policy of “Restoring earning capacity.” Targets are an operating margin of 5.0% and ROE of 5.0% at the end of the 16th Medium-Term Plan, against a cost of capital the company puts at 7.0-7.5%, with the aim of realizing ROE in excess of the cost of capital and swiftly achieving a PBR over one. Five priority strategies are set out: securing target commercial rights for major customers, strengthening order acquisition from strategic OEMs, introducing attractive products and new technologies, establishing sustainable supply chains, and enhancing high-efficiency production systems. TS TECH supplied 64% of seats for Honda automobiles in FY2026 and targets a Honda share of 70% or higher. Sales to strategic OEMs other than the Honda Group were 487 [100 million yen] at the end of the 15th Medium-Term Plan (FY2026), with a sales target toward a scale of 100 billion yen. Topics for the year included new orders for rear seats for the Changan Mazda EZ-60 and rear seats and powered front seat frames for the Maruti Suzuki e VITARA, the Best Partner Award and Technology Development Award from Suzuki Motor in November 2025, and the First Prize for Quality Improvements and New Supplier Award from Changan Mazda in January 2026.
This article is an analysis based on publicly available information and is not a recommendation to buy or sell any specific securities. Investment decisions are your own responsibility.
![[Obayashi] Investors’ Guide 2026 — The Complete 24-Article Breakdown](https://japan-equity.com/wp-content/uploads/2026/07/hub_cover-1024x1024.png)
![[Obayashi] IR & SR Policy — Feeding Dialogue Back into Management](https://japan-equity.com/wp-content/uploads/2026/07/p32_sq-1024x1024.jpg)
![[Obayashi] Real Estate Development — 18.7% Margin, ¥287.7bn Unrealized Gains](https://japan-equity.com/wp-content/uploads/2026/07/p20_sq-1024x1024.jpg)
![[Obayashi] Domestic Civil Engineering — Resilience Spending Supports 9.6% Margin](https://japan-equity.com/wp-content/uploads/2026/07/p11_sq-1024x1024.jpg)
![[Obayashi] Share Price & External Ratings — vs TOPIX, ESG Index Inclusion](https://japan-equity.com/wp-content/uploads/2026/07/p40_sq-1024x1024.jpg)
![[Construction] ¥75.5tn Investment, Shrinking Workforce — Big-5 Market Share](https://japan-equity.com/wp-content/uploads/2026/07/p12_sq-1024x1024.jpg)



![[Obayashi] Capital Policy & Shareholder Returns — ROE 10%+, DOE ~5%, ¥100bn Buyback](https://japan-equity.com/wp-content/uploads/2026/07/p27_sq-1024x1024.jpg)
![[Obayashi] Reducing Cross-Shareholdings — ¥285.2bn Sold in Five Years](https://japan-equity.com/wp-content/uploads/2026/07/p29_sq-1024x1024.jpg)
![[Obayashi] ¥750bn Investment Plan — ¥300bn to Development, ¥190bn to Tech/DX](https://japan-equity.com/wp-content/uploads/2026/07/p30_sq-1024x1024.jpg)
![[Obayashi] MTP2022 KPIs — Operating Profit ~2x Target, ROE 14.4%](https://japan-equity.com/wp-content/uploads/2026/07/p25_sq-1024x1024.jpg)
![[Obayashi] Cash Allocation — ¥420bn Investment CF Over Five Years](https://japan-equity.com/wp-content/uploads/2026/07/p26_sq-1024x1024.jpg)
![[Obayashi] Green Energy — 44 Plants, 344MW, and the Green Hydrogen Challenge](https://japan-equity.com/wp-content/uploads/2026/07/p21_sq-1024x1024.jpg)
![[Obayashi] Tackling the Labor Shortage — Robotics Construction®](https://japan-equity.com/wp-content/uploads/2026/07/p14_sq-1024x1024.jpg)
