
This article is based on publicly available IR materials and is not a recommendation to buy or sell any specific securities.
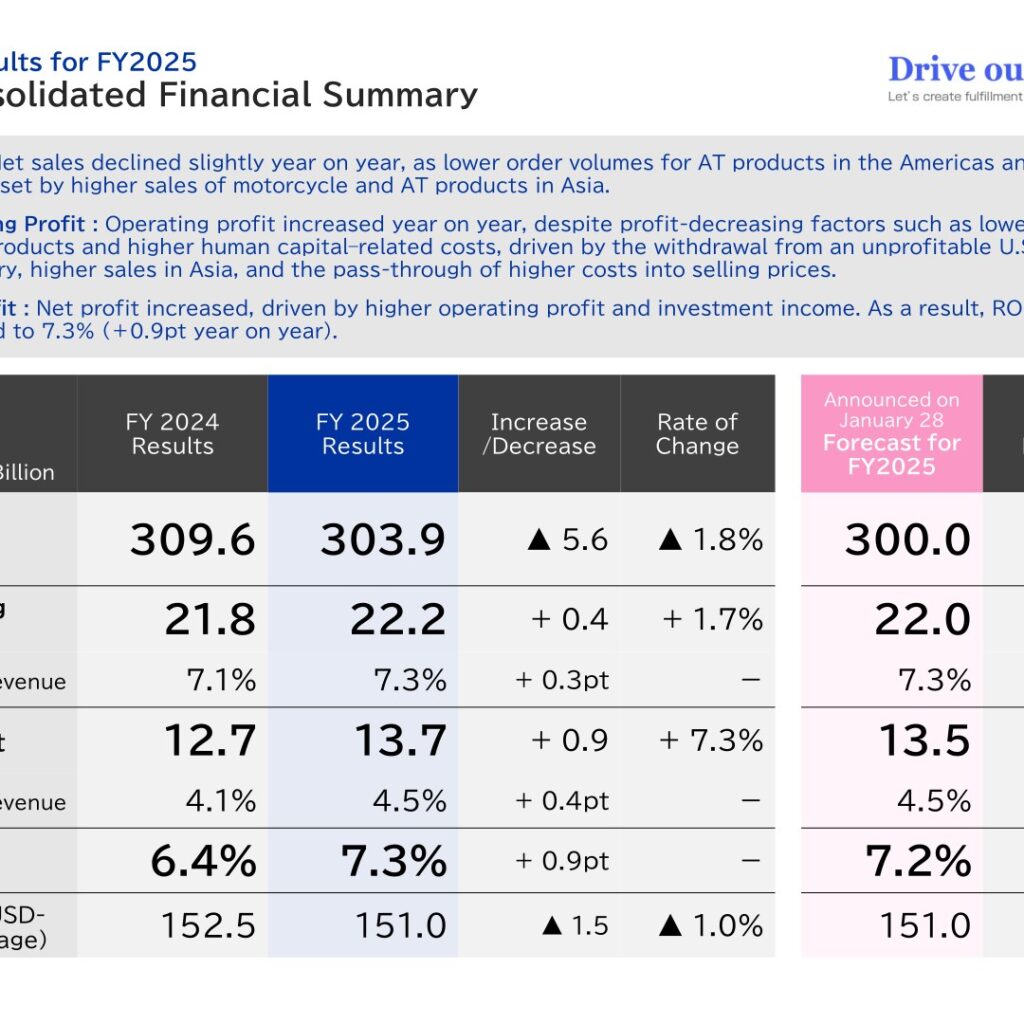
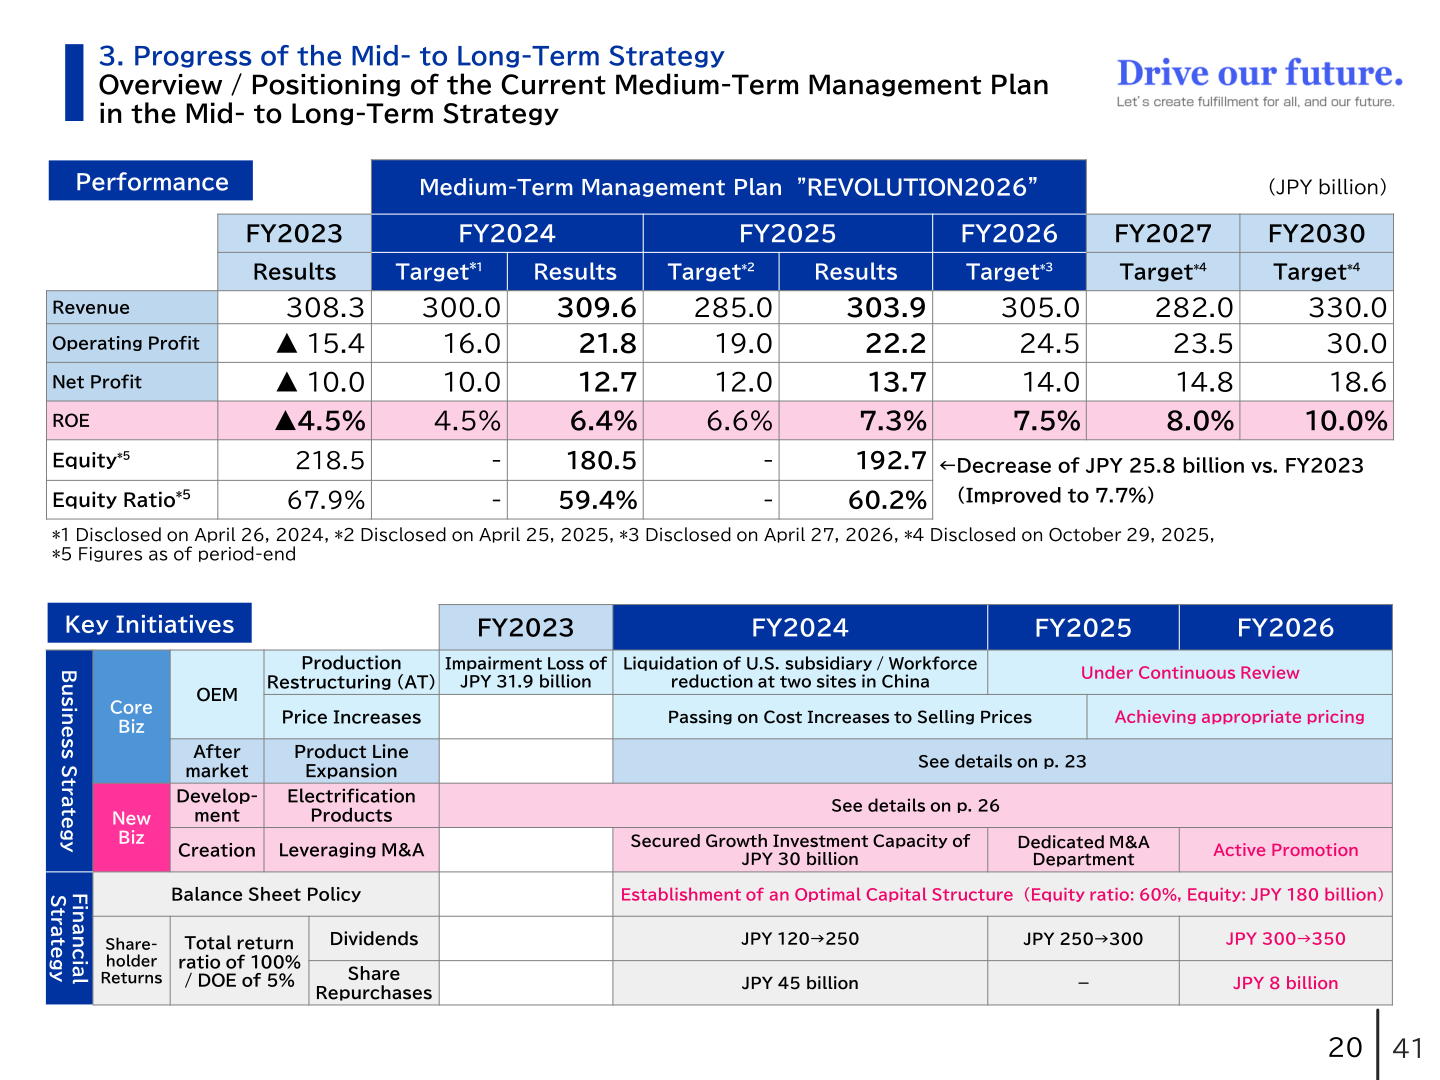
EXEDY Corporation reported FY2025 revenue of JPY 303.9 billion, down 1.8% year on year, while operating profit rose 1.7% to JPY 22.2 billion and net profit rose 7.3% to JPY 13.7 billion. ROE improved to 7.3%, up 0.9pt year on year. Every headline line came in ahead of the forecast announced on January 28: revenue at 101.3% of plan, operating profit at 101.0% and net profit at 101.3%. For FY2026, the final year of the medium-term plan “REVOLUTION 2026”, the Company guides to revenue of JPY 305.0 billion, operating profit of JPY 24.5 billion, net profit of JPY 14.0 billion and ROE of 7.5%, and has decided to raise the annual dividend from JPY 300 to JPY 350 per share alongside share buybacks of JPY 8.0 billion.
Consolidated Results (Full-Year Actual)
Net sales declined slightly year on year, as lower order volumes for AT products in the Americas and Japan were offset by higher sales of motorcycle and AT products in Asia. Operating profit increased despite profit-decreasing factors such as lower orders for AT products and higher human capital-related costs, driven by the withdrawal from an unprofitable U.S. subsidiary, higher sales in Asia, and the pass-through of higher costs into selling prices. Net profit increased on higher operating profit and investment income, lifting ROE to 7.3%.
| Item (Unit: JPY Billion) | FY 2024 Results | FY 2025 Results | Increase/Decrease | Rate of Change | Forecast for FY2025 (Announced on January 28) | vs Forecast |
|---|---|---|---|---|---|---|
| Revenue | 309.6 | 303.9 | ▲ 5.6 | ▲ 1.8% | 300.0 | 101.3% |
| Operating Profit | 21.8 | 22.2 | + 0.4 | + 1.7% | 22.0 | 101.0% |
| Ratio to Revenue | 7.1% | 7.3% | + 0.3pt | - | 7.3% | - |
| Net Profit | 12.7 | 13.7 | + 0.9 | + 7.3% | 13.5 | 101.3% |
| Ratio to Revenue | 4.1% | 4.5% | + 0.4pt | - | 4.5% | - |
| ROE | 6.4% | 7.3% | + 0.9pt | - | 7.2% | - |
| FX Rate (USD-JPY) (average) | 152.5 | 151.0 | ▲ 1.5 | ▲ 1.0% | 151.0 | - |
On the profit bridge from FY2024 to FY2025, operating profit moved by +0.4: impact of revenue fluctuations ▲0.2, impact of exchange rate fluctuations +0.5, materials & subcontracting expenses +1.8, labor cost ▲3.3, depreciation expense +0.7 and other +0.9 (all JPY billion). Within these, the impact of lower order volumes was ▲2.4 and selling price increases reflecting cost increases contributed +2.2, while RS costs (labor cost related to the Restricted Stock Incentive for Employee Shareholding Association implemented in FY2024) were ▲2.7 and wage increases ▲0.6. Below the operating line, finance & others added +2.9, taking profit before income taxes to +3.2, with corporate taxes etc. ▲1.6 and non-controlling interests ▲0.7, leaving net profit +0.9.
The Company also disclosed the impact of U.S. tariff policies on intercompany import transactions at its U.S. operations. Additional tariff payments totalled USD 6,104 thousand (EXEDY Globalparts Corporation 2,787; DYNAX America Corporation 3,317), of which USD 2,258 thousand was passed on to customers, leaving a net burden on the Group of USD 3,846 thousand — approximately JPY 0.6 billion at an exchange rate of JPY 151.0 per USD. As refund applications to the U.S. authorities are currently in process, this matter has not been reflected in the FY2026 earnings forecast.
Segment Results
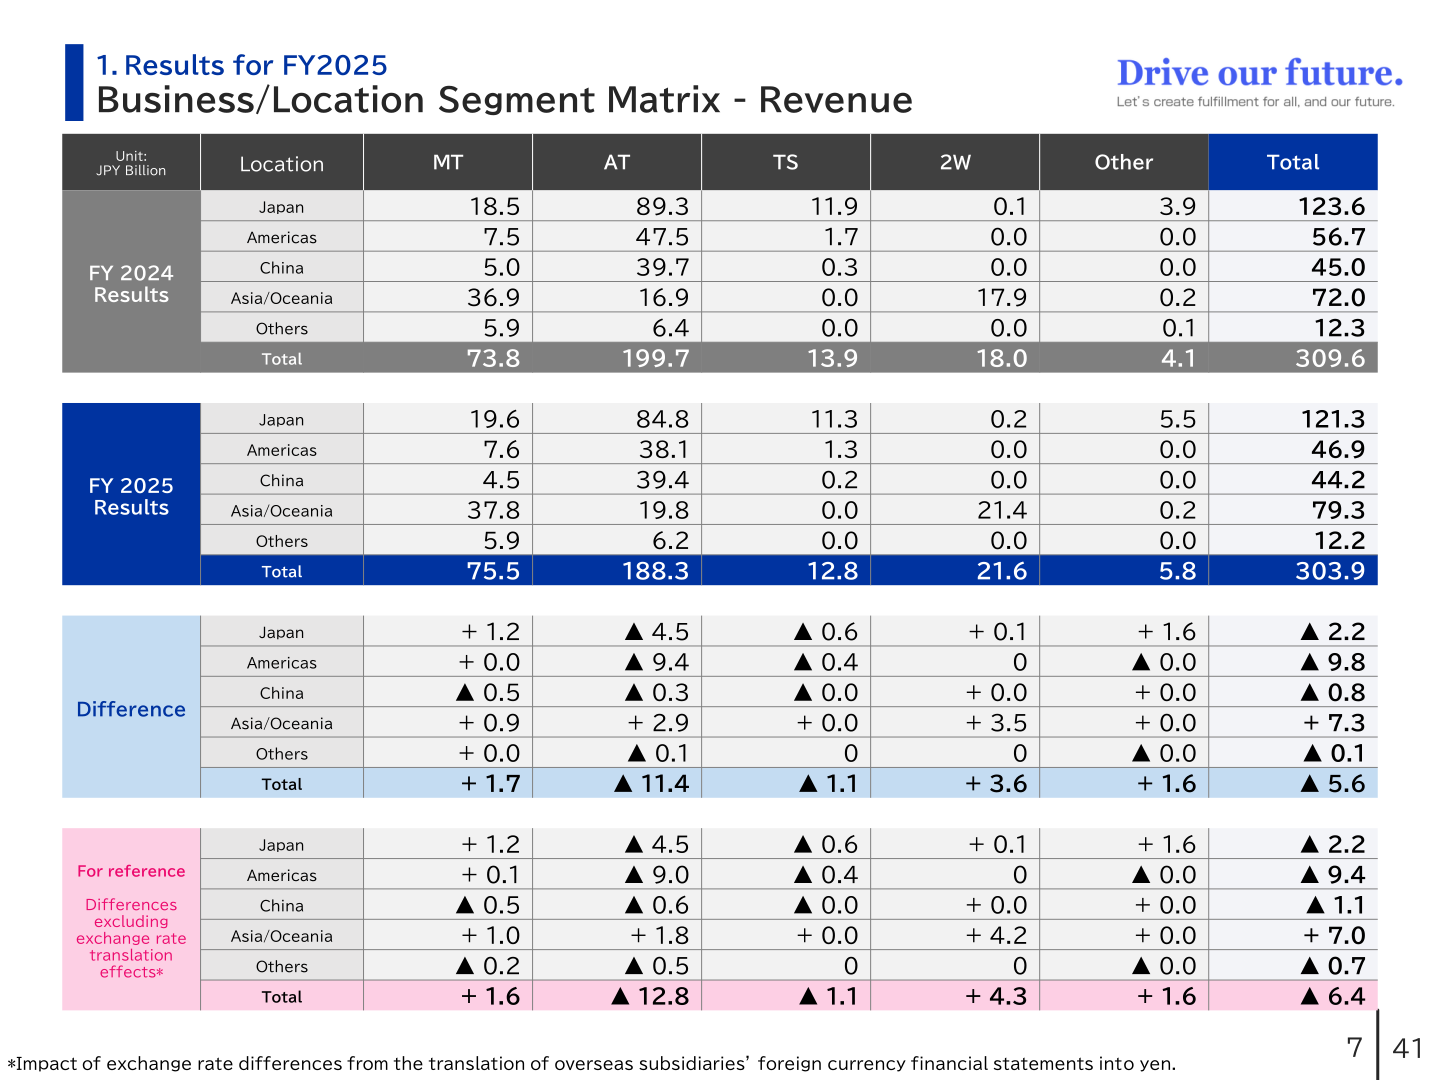
EXEDY discloses a business-by-location matrix. By business, AT revenue fell JPY 11.4 billion to JPY 188.3 billion and TS fell JPY 1.1 billion to JPY 12.8 billion, while MT rose JPY 1.7 billion to JPY 75.5 billion, 2W rose JPY 3.6 billion to JPY 21.6 billion and Other rose JPY 1.6 billion to JPY 5.8 billion.
| Business (Revenue, JPY Billion) | FY 2024 Results | FY 2025 Results | Difference | FY 2026 Forecast |
|---|---|---|---|---|
| MT | 73.8 | 75.5 | + 1.7 | 78.1 |
| AT | 199.7 | 188.3 | ▲ 11.4 | 177.6 |
| TS | 13.9 | 12.8 | ▲ 1.1 | 12.5 |
| 2W | 18.0 | 21.6 | + 3.6 | 22.7 |
| Other | 4.1 | 5.8 | + 1.6 | 14.1 |
| Total | 309.6 | 303.9 | ▲ 5.6 | 305.0 |
By location, the Americas fell JPY 9.8 billion to JPY 46.9 billion and Japan fell JPY 2.2 billion to JPY 121.3 billion, while Asia/Oceania grew JPY 7.3 billion to JPY 79.3 billion. China was JPY 44.2 billion (▲0.8) and Others JPY 12.2 billion (▲0.1). For FY2026 the Company expects Japan and the Americas to recover to JPY 127.3 billion and JPY 48.9 billion respectively, while China is guided down JPY 11.1 billion to JPY 33.2 billion.
| Location (Revenue, JPY Billion) | FY 2024 Results | FY 2025 Results | Difference | FY 2026 Forecast |
|---|---|---|---|---|
| Japan | 123.6 | 121.3 | ▲ 2.2 | 127.3 |
| Americas | 56.7 | 46.9 | ▲ 9.8 | 48.9 |
| China | 45.0 | 44.2 | ▲ 0.8 | 33.2 |
| Asia/Oceania | 72.0 | 79.3 | + 7.3 | 81.6 |
| Others | 12.3 | 12.2 | ▲ 0.1 | 14.0 |
| Total | 309.6 | 303.9 | ▲ 5.6 | 305.0 |
On operating profit, AT improved by JPY 3.25 billion to JPY 15.68 billion and MT by JPY 0.76 billion to JPY 11.52 billion, while “Other” deteriorated by JPY 3.47 billion to ▲JPY 4.68 billion and Company-wide expenses widened by JPY 1.61 billion to ▲JPY 3.94 billion. By location, the Americas swung from ▲JPY 1.45 billion to JPY 0.53 billion and Asia/Oceania rose to JPY 9.26 billion, while Japan fell to JPY 6.24 billion.
| Business (Operating Profit, JPY Billion) | FY 2024 Results | FY 2025 Results | Difference | FY 2026 Forecast |
|---|---|---|---|---|
| MT | 10.77 | 11.52 | + 0.76 | 12.23 |
| AT | 12.44 | 15.68 | + 3.25 | 14.79 |
| TS | 1.67 | 1.53 | ▲ 0.15 | 1.61 |
| 2W | 1.21 | 1.84 | + 0.62 | 1.58 |
| Other | ▲ 1.21 | ▲ 4.68 | ▲ 3.47 | ▲ 3.60 |
| Company-wide expenses | ▲ 2.33 | ▲ 3.94 | ▲ 1.61 | ▲ 2.08 |
| Total | 21.85 | 22.23 | + 0.38 | 24.53 |
FY2026 Forecast
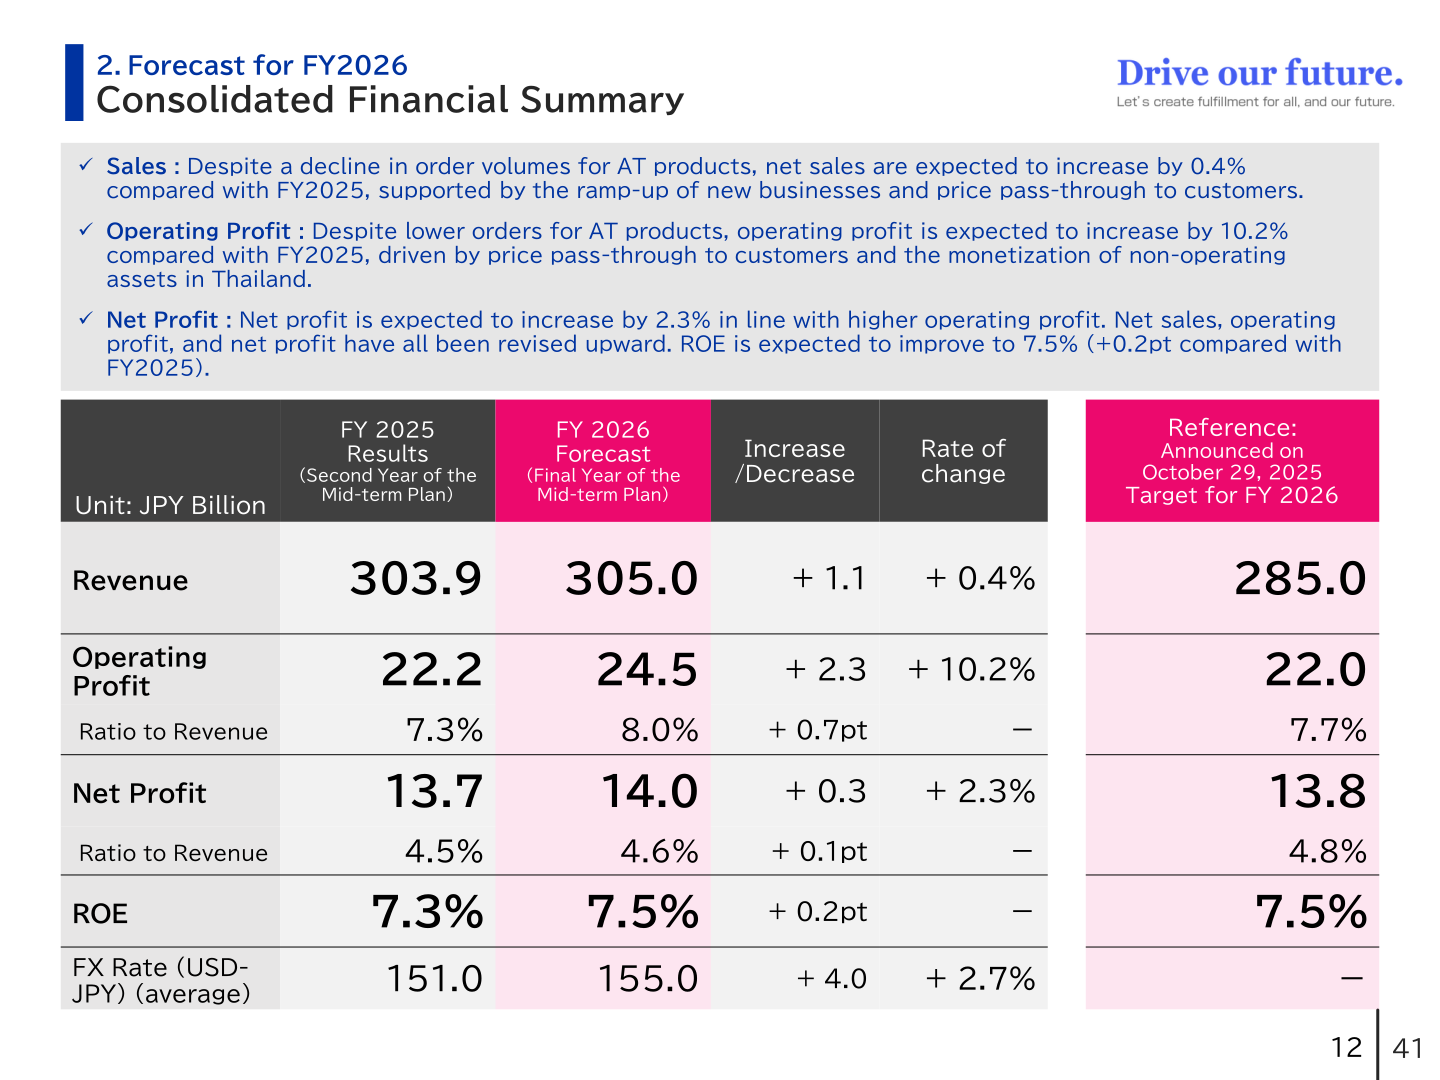
Despite a decline in order volumes for AT products, net sales are expected to increase by 0.4% versus FY2025, supported by the ramp-up of new businesses and price pass-through to customers. Operating profit is expected to rise 10.2%, driven by price pass-through and the monetization of non-operating assets in Thailand, and net profit to rise 2.3%. Revenue, operating profit and net profit have all been revised upward from the FY2026 targets announced on October 29, 2025 (JPY 285.0 billion / JPY 22.0 billion / JPY 13.8 billion).
| Item (Unit: JPY Billion) | FY 2025 Results (Second Year of the Mid-term Plan) | FY 2026 Forecast (Final Year of the Mid-term Plan) | Increase/Decrease | Rate of change | Reference: Target for FY 2026 (Announced on October 29, 2025) |
|---|---|---|---|---|---|
| Revenue | 303.9 | 305.0 | + 1.1 | + 0.4% | 285.0 |
| Operating Profit | 22.2 | 24.5 | + 2.3 | + 10.2% | 22.0 |
| Ratio to Revenue | 7.3% | 8.0% | + 0.7pt | - | 7.7% |
| Net Profit | 13.7 | 14.0 | + 0.3 | + 2.3% | 13.8 |
| Ratio to Revenue | 4.5% | 4.6% | + 0.1pt | - | 4.8% |
| ROE | 7.3% | 7.5% | + 0.2pt | - | 7.5% |
| FX Rate (USD-JPY) (average) | 151.0 | 155.0 | + 4.0 | + 2.7% | - |
On the FY2026 profit bridge, the impact of lower order volumes is ▲3.7 while selling price increases reflecting cost increases and achieving appropriate pricing add +5.2 (JPY billion). Other items include R&D expenses ▲2.0, monetization of non-operating assets +2.2 and reversal of prior-year reserves +1.4, with wage increases at ▲0.9. Below operating profit, finance & others is ▲2.9, reflecting a foreign exchange loss of ▲1.3, investment income of +0.9 and an equity-method loss of ▲0.7.
The Company separately quantified the impact of the situation in the Middle East. In the event of a one-month suspension of marine transportation to the Middle East, the impact on consolidated revenue is estimated at ▲JPY 0.7 billion (EXEDY direct impact ▲0.572, indirect impact ▲0.070, overseas subsidiaries direct impact ▲0.005; total ▲0.647). As the impact of potential order volume declines arising from this situation cannot be appropriately estimated at this time, it has not been reflected in the FY2026 forecast.
Shareholder Returns
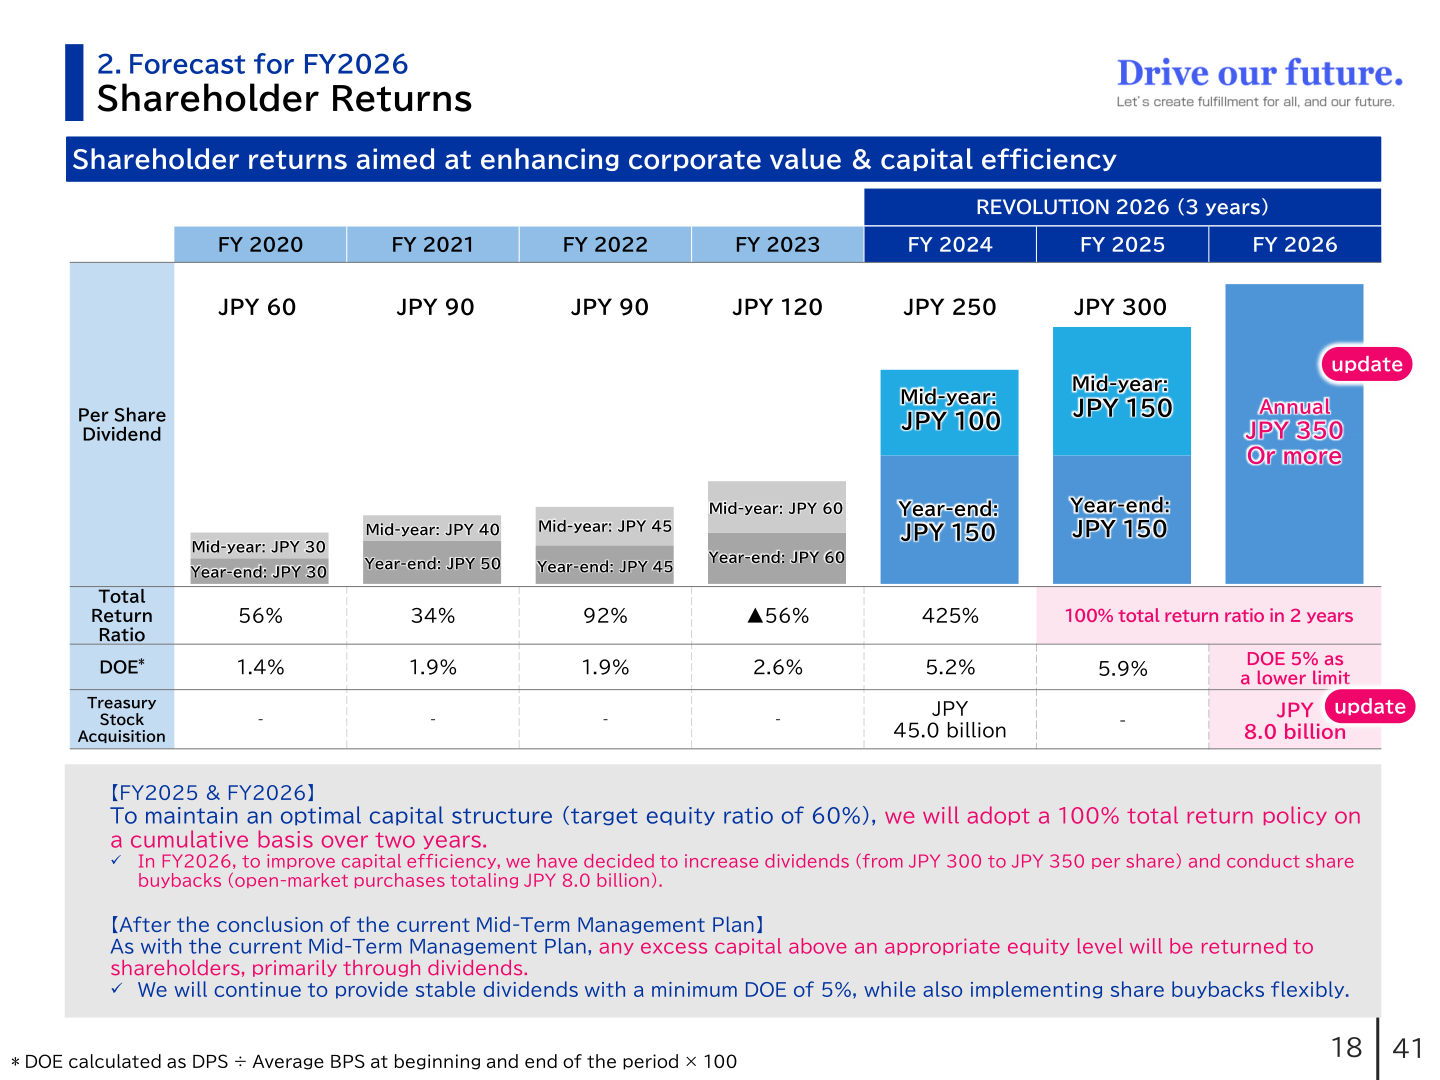
To maintain an optimal capital structure (target equity ratio of 60%), EXEDY has adopted a 100% total return policy on a cumulative basis over the two years FY2025 and FY2026. The FY2025 annual dividend was JPY 300 per share (mid-year JPY 150, year-end JPY 150), with DOE of 5.9%. In FY2026, to improve capital efficiency, the Company has decided to increase the annual dividend to JPY 350 per share or more and to conduct share buybacks through open-market purchases totalling JPY 8.0 billion. After the conclusion of the current medium-term plan, excess capital above an appropriate equity level will be returned to shareholders primarily through dividends, with stable dividends maintained at a minimum DOE of 5% and buybacks implemented flexibly.
| Item | FY 2023 | FY 2024 | FY 2025 | FY 2026 |
|---|---|---|---|---|
| Per Share Dividend | JPY 120 | JPY 250 | JPY 300 | Annual JPY 350 Or more |
| Total Return Ratio | ▲56% | 425% | 100% total return ratio in 2 years | 100% total return ratio in 2 years |
| DOE | 2.6% | 5.2% | 5.9% | DOE 5% as a lower limit |
| Treasury Stock Acquisition | – | JPY 45.0 billion | – | JPY 8.0 billion |
Under the three-year capital allocation plan for FY2024-FY2026, cash-in comprises operating cash flow of JPY 96 billion, reduction of working capital etc. of JPY 7 billion, sale of cross-shareholdings of JPY 1.7 billion and utilization of financial leverage of JPY 30 billion. Cash-out comprises renewal investment of JPY 22 billion, growth investment of JPY 30 billion, dividends of JPY 30 billion and acquisition of treasury stock of JPY 53 billion. Growth investment was JPY 4.9 billion in FY2024 and JPY 11.9 billion in FY2025 (in-wheel motor 6.3, VC 4.1, etc.), with JPY 13.2 billion forecast for FY2026.
Medium- to Long-Term Strategy
FY2025 was the second year of the medium-term management plan “REVOLUTION 2026”. Equity stood at JPY 192.7 billion at period-end with an equity ratio of 60.2%. The Company targets ROE of 8.0% in FY2027 and 10.0% in FY2030, with FY2030 revenue of JPY 330.0 billion and operating profit of JPY 30.0 billion, aiming to shift from an AT-weighted business to a balanced portfolio of AT, MT and new businesses.
| Item (JPY billion) | FY2025 Results | FY2026 Target | FY2027 Target | FY2030 Target |
|---|---|---|---|---|
| Revenue | 303.9 | 305.0 | 282.0 | 330.0 |
| Operating Profit | 22.2 | 24.5 | 23.5 | 30.0 |
| Net Profit | 13.7 | 14.0 | 14.8 | 18.6 |
| ROE | 7.3% | 7.5% | 8.0% | 10.0% |
In the core businesses, AT (OEM & aftermarket) revenue was JPY 188.3 billion in FY2025 with operating profit of JPY 15.7 billion, MT (OEM) JPY 33.8 billion with JPY 1.1 billion, MT (aftermarket) JPY 41.7 billion with JPY 10.4 billion, and Others (TS, 2W, etc.) JPY 37.9 billion with JPY 3.5 billion. In the aftermarket business the Company targets product sales of JPY 57.5 billion in FY2030, and in March 2026 established a joint venture with FRAP S.p.A. of Turin, Italy, a manufacturer of suspension and steering components.
In new businesses, the FY2030 outlook for six electrification projects — small electric mobility, commercial e-mobility, in-wheel motor, drone, smart robot and general-purpose electric drive units — is JPY 70.8 billion; including other projects (totalling over JPY 70.0 billion), the FY2030 outlook is over JPY 140.0 billion against a new product sales target of JPY 100 billion. In March 2026 EXEDY acquired Protean Electric Ltd. of the UK, an in-wheel motor developer whose motors are adopted for the Renault 5 Turbo 3E; in-wheel motor sales are planned at JPY 1.38 billion in FY2026 and JPY 14.9 billion in FY2030. Drone sales are planned at JPY 2.32 billion in FY2026 and JPY 13.8 billion in FY2030, with mass production for the U.S. agricultural drone market planned to start in September 2026.
On governance, the Board shifted to a majority-independent composition (57%) in FY2025, with two female directors on the seven-member board, and the Company plans to transition to a Company with a Nomination Committees, etc. in FY2026, subject to approval at the Annual General Meeting scheduled for June 2026. On IR and SR, the number of companies engaged in dialogue rose from 71 in FY2024 to 137 in FY2025.
This article is an analysis based on publicly available information and is not a recommendation to buy or sell any specific securities. Investment decisions are your own responsibility.
![[Obayashi] Investors’ Guide 2026 — The Complete 24-Article Breakdown](https://japan-equity.com/wp-content/uploads/2026/07/hub_cover-1024x1024.png)
![[Obayashi] IR & SR Policy — Feeding Dialogue Back into Management](https://japan-equity.com/wp-content/uploads/2026/07/p32_sq-1024x1024.jpg)
![[Obayashi] Domestic Civil Engineering — Resilience Spending Supports 9.6% Margin](https://japan-equity.com/wp-content/uploads/2026/07/p11_sq-1024x1024.jpg)
![[Obayashi] Overseas Construction — Orders Reach ¥1.2tn](https://japan-equity.com/wp-content/uploads/2026/07/p15_sq-1024x1024.jpg)
![[Obayashi] Share Price & External Ratings — vs TOPIX, ESG Index Inclusion](https://japan-equity.com/wp-content/uploads/2026/07/p40_sq-1024x1024.jpg)
![[Construction] ¥75.5tn Investment, Shrinking Workforce — Big-5 Market Share](https://japan-equity.com/wp-content/uploads/2026/07/p12_sq-1024x1024.jpg)



![[Obayashi] Capital Policy & Shareholder Returns — ROE 10%+, DOE ~5%, ¥100bn Buyback](https://japan-equity.com/wp-content/uploads/2026/07/p27_sq-1024x1024.jpg)
![[Obayashi] Reducing Cross-Shareholdings — ¥285.2bn Sold in Five Years](https://japan-equity.com/wp-content/uploads/2026/07/p29_sq-1024x1024.jpg)
![[Obayashi] ¥750bn Investment Plan — ¥300bn to Development, ¥190bn to Tech/DX](https://japan-equity.com/wp-content/uploads/2026/07/p30_sq-1024x1024.jpg)
![[Obayashi] MTP2022 KPIs — Operating Profit ~2x Target, ROE 14.4%](https://japan-equity.com/wp-content/uploads/2026/07/p25_sq-1024x1024.jpg)
![[Obayashi] Cash Allocation — ¥420bn Investment CF Over Five Years](https://japan-equity.com/wp-content/uploads/2026/07/p26_sq-1024x1024.jpg)
![[Obayashi] Green Energy — 44 Plants, 344MW, and the Green Hydrogen Challenge](https://japan-equity.com/wp-content/uploads/2026/07/p21_sq-1024x1024.jpg)
![[Obayashi] Tackling the Labor Shortage — Robotics Construction®](https://japan-equity.com/wp-content/uploads/2026/07/p14_sq-1024x1024.jpg)
