
This article is based on publicly available IR materials and is not a recommendation to buy or sell any specific securities.
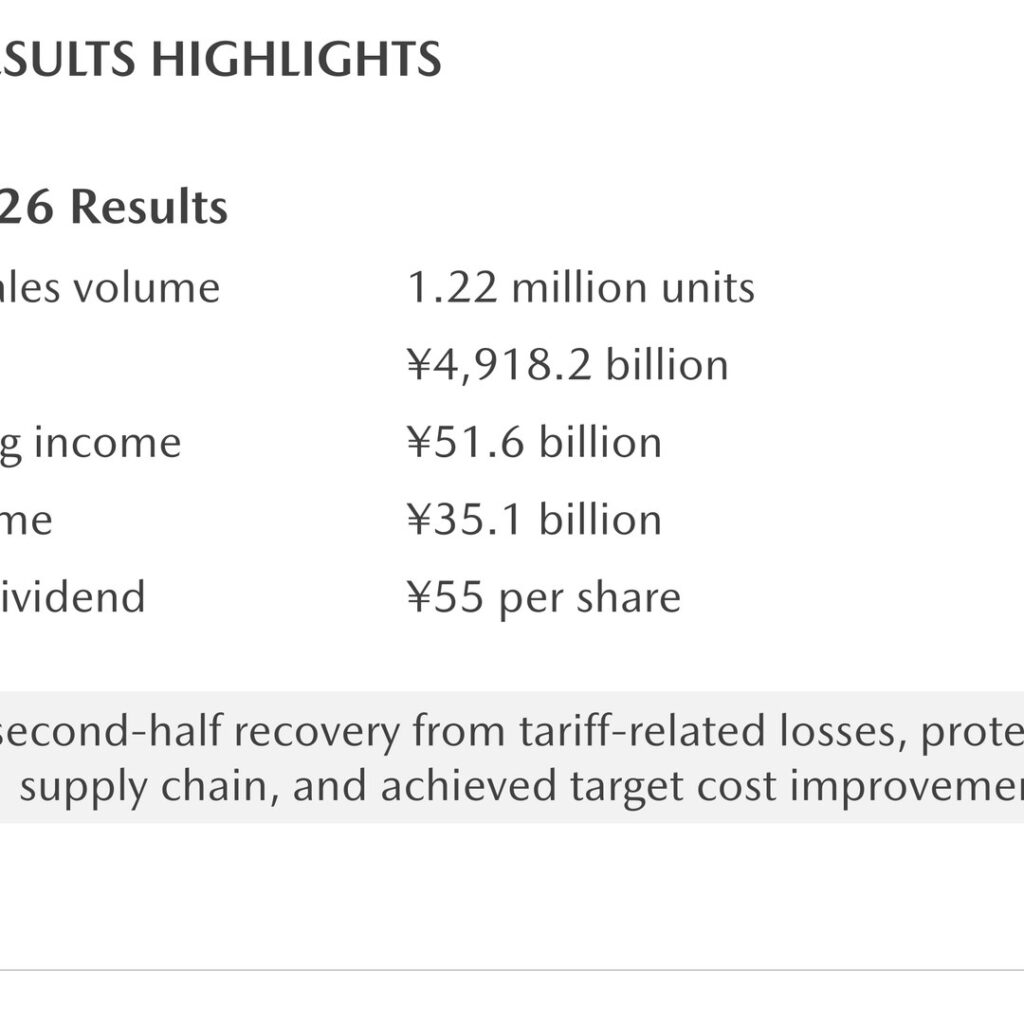
Note: Mazda labels the fiscal year ended March 31, 2026 as “FY March 2026”; this site classifies the most recent completed fiscal year as FY2025, and the labels used in the text, tables and segment data below follow the company’s own presentation. Mazda’s presentation of May 12, 2026 reports FY March 2026 global sales volume of 1.22 million units, net sales of ¥4,918.2 billion, operating income of ¥51.6 billion, net income of ¥35.1 billion and an annual dividend of ¥55 per share. The company describes the year as a strong second-half recovery from tariff-related losses, with the global supply chain protected and target cost improvements achieved. For FY March 2027 Mazda forecasts global sales volume of 1.32 million units, operating income of ¥150 billion and net income of ¥90 billion, with an annual dividend plan of ¥55 per share.
Consolidated Results (Full-Year Actual)
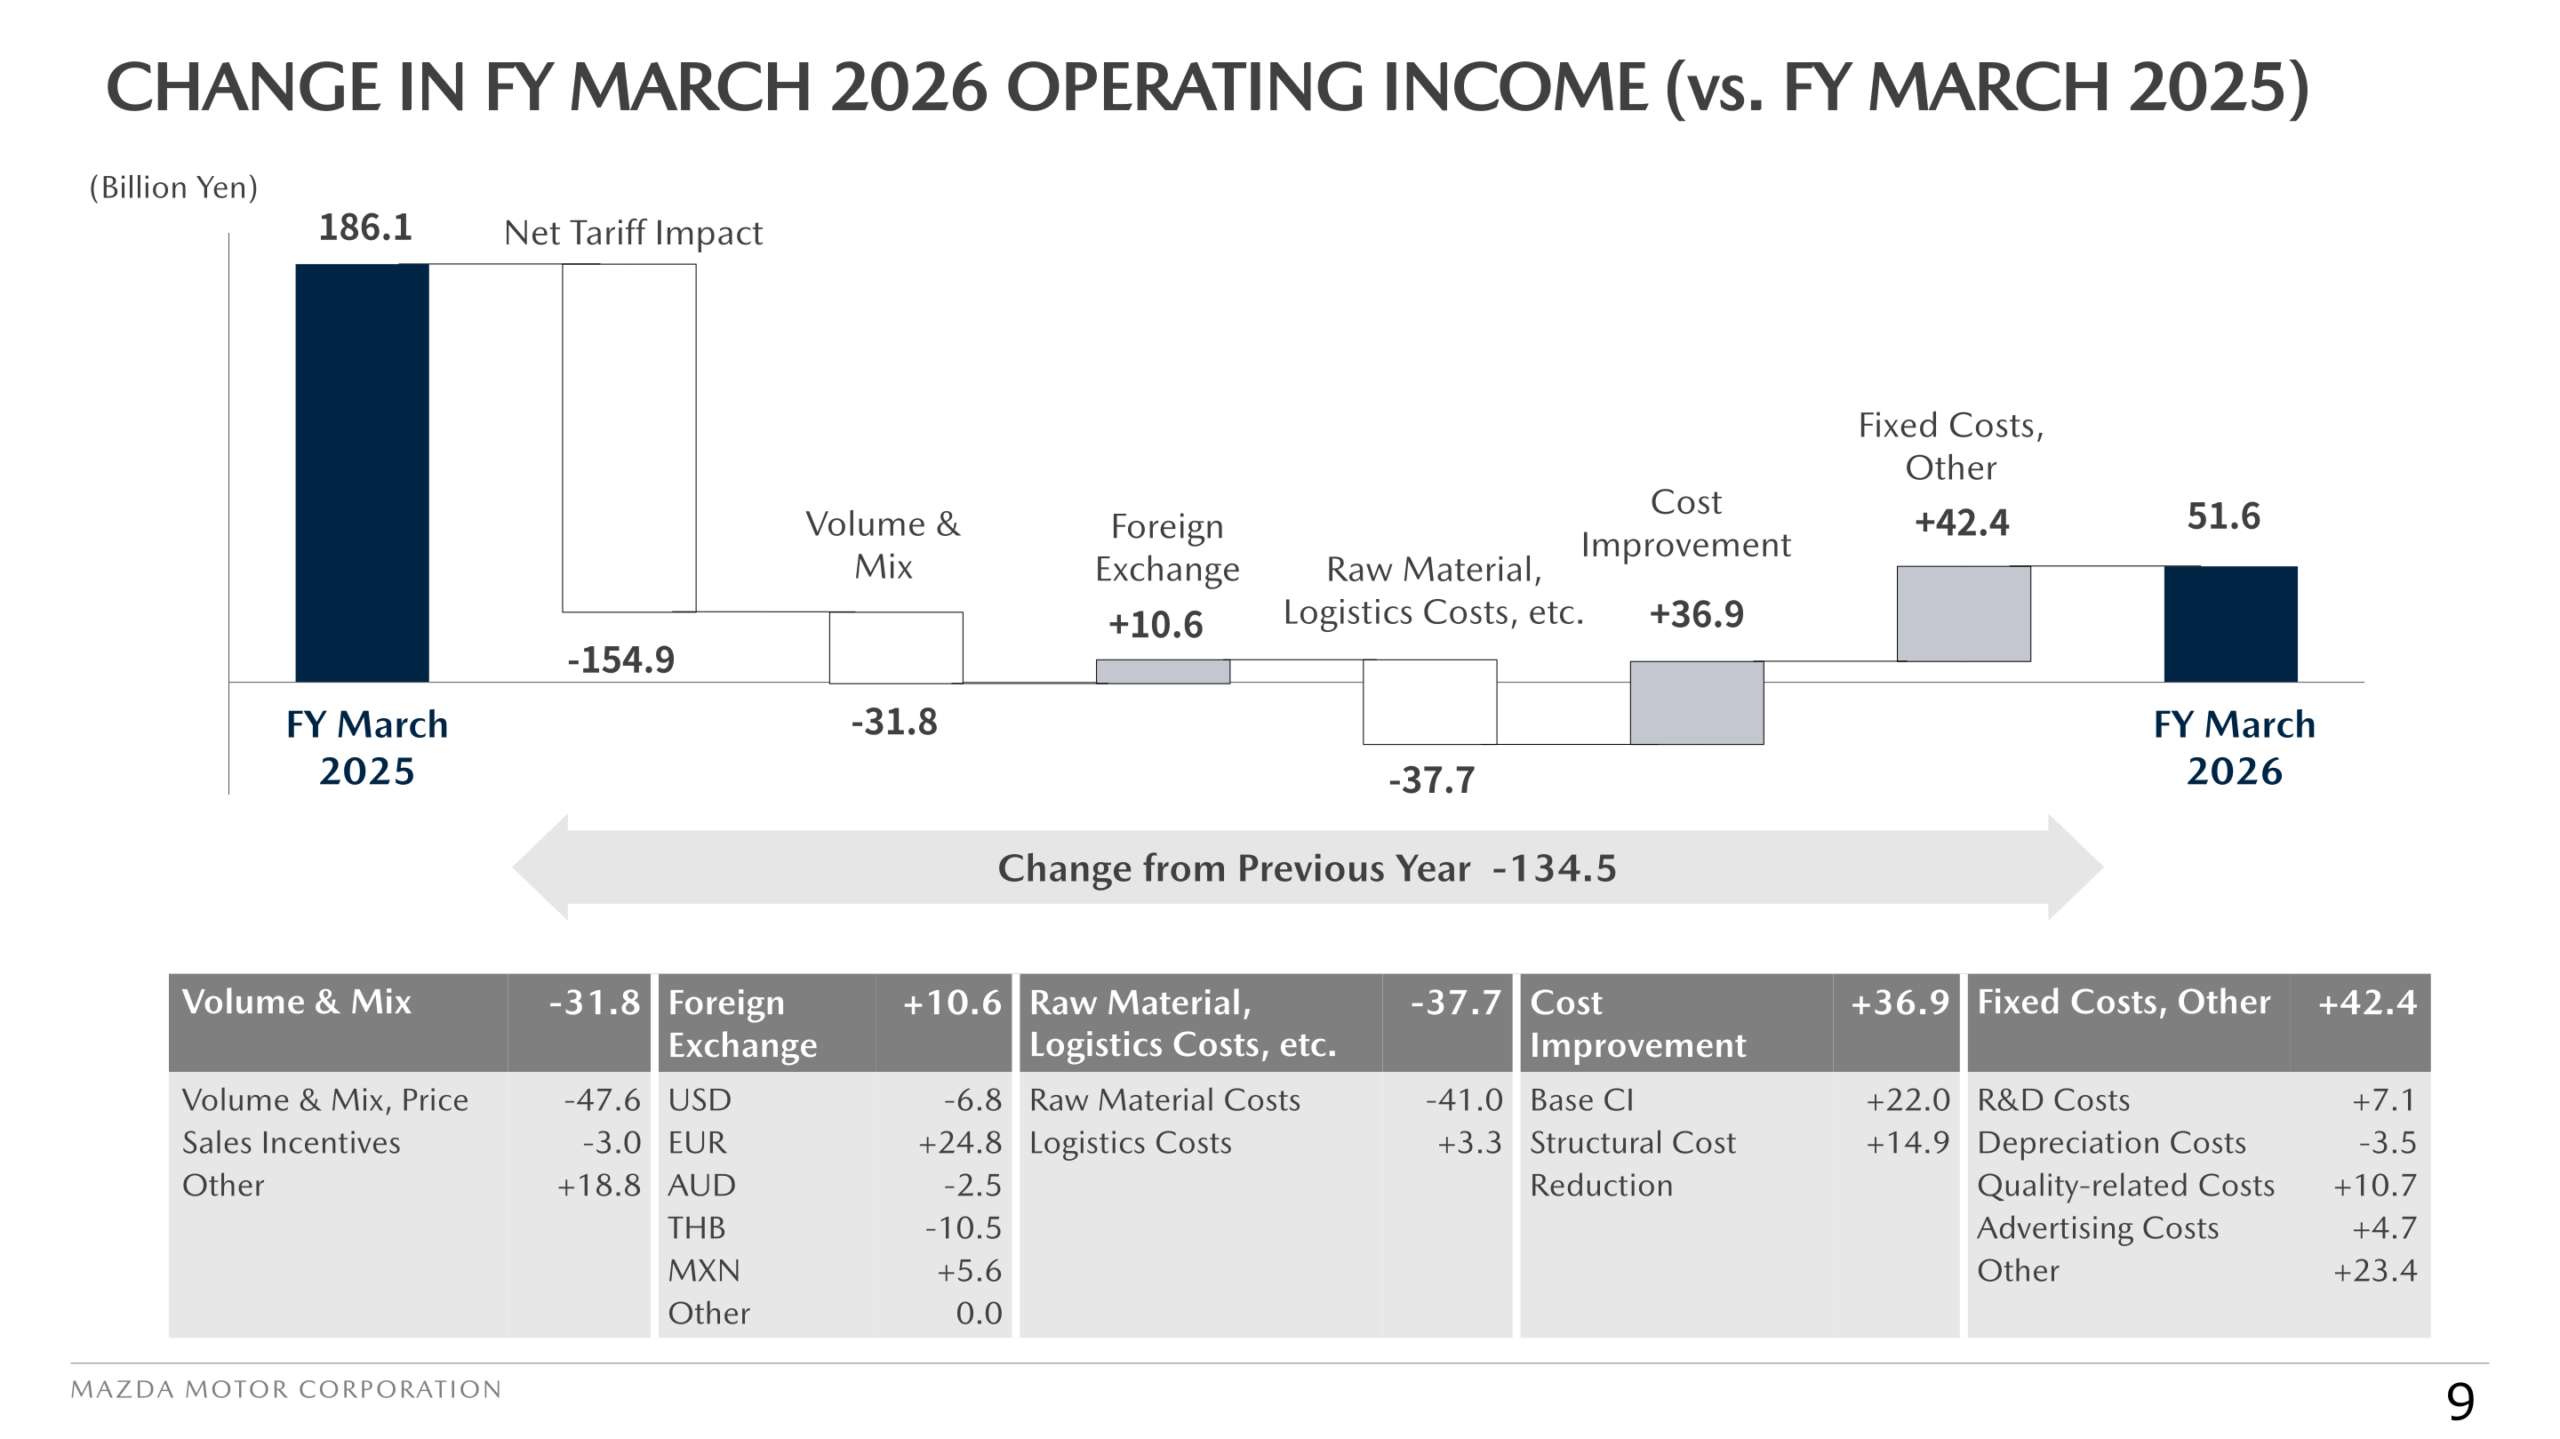
Net sales for FY March 2026 were ¥4,918.2 billion, down ¥100.7 billion or 2% from ¥5,018.9 billion in FY March 2025, and ¥98.2 billion above the February forecast. Operating income fell ¥134.5 billion or 72% to ¥51.6 billion, ¥1.6 billion above the February forecast, while ordinary income declined ¥57.2 billion or 30% to ¥131.8 billion and net income fell ¥79.0 billion or 69% to ¥35.1 billion. Operating return on sales was 1.0%, down 2.7 pts year on year, and EPS was ¥55.6 against ¥181.0 a year earlier. Consolidated wholesales were 1,147 thousand units, down 72 thousand units or 6%. Note that net income in the presentation indicates net income/loss attributable to owners of the parent.
| Item | FY March 2025 (Full Year) | FY March 2026 (Full Year) | Change from Previous Year | Change from Feb. Forecast |
|---|---|---|---|---|
| Consolidated Wholesales (Thousand Units) | 1,219 | 1,147 | -72 / -6% | -25 |
| Net Sales (Billion Yen) | 5,018.9 | 4,918.2 | -100.7 / -2% | +98.2 |
| Operating Income (Billion Yen) | 186.1 | 51.6 | -134.5 / -72% | +1.6 |
| Ordinary Income (Billion Yen) | 189.0 | 131.8 | -57.2 / -30% | +53.8 |
| Net Income (Billion Yen) | 114.1 | 35.1 | -79.0 / -69% | +15.1 |
| Operating Return on Sales | 3.7 % | 1.0 % | -2.7 pts | 0 pts |
| EPS (Yen) | 181.0 | 55.6 | -125.4 | +23.9 |
| Exchange Rate: US Dollar (Yen) | 153 | 151 | -2 | 0 |
| Exchange Rate: Euro (Yen) | 164 | 175 | +11 | +1 |
| Exchange Rate: Thai Baht (Yen) | 4.38 | 4.67 | +0.29 | +0.03 |
| Exchange Rate: Mexican Peso (Yen) | 8.02 | 8.16 | +0.14 | +0.09 |
Mazda’s bridge from FY March 2025 operating income of ¥186.1 billion to FY March 2026’s ¥51.6 billion shows a net tariff impact of -¥154.9 billion, volume and mix of -¥31.8 billion, foreign exchange of +¥10.6 billion, raw material and logistics costs and other items of -¥37.7 billion, cost improvement of +¥36.9 billion, and fixed costs and other items of +¥42.4 billion. Within volume and mix, volume and mix and price accounted for -¥47.6 billion and sales incentives for -¥3.0 billion, with other items at +¥18.8 billion. Within raw material and logistics, raw material costs were -¥41.0 billion and logistics costs +¥3.3 billion. Cost improvement comprised base CI of +¥22.0 billion and structural cost reduction of +¥14.9 billion.
The company highlights a return to profitability in the second half: operating income moved from -¥53.9 billion in the first half to +¥105.5 billion in the second half, a change of +¥159.4 billion. Free cash flow improved from -¥150.7 billion in the first half to +¥150.1 billion in the second half, a change of +¥300.8 billion. The factors behind the half-on-half profit increase were volume and mix of ¥100.0 billion, cost improvement of ¥20.0 billion, foreign exchange of ¥60.0 billion and tariff impact of ¥40.0 billion, for a total of ¥220.0 billion, against decrease factors of fixed cost and others of -¥40.6 billion and raw material and logistics costs and other items of -¥20.0 billion, for a total of -¥60.6 billion.
| Item (Billion Yen) | FY March 2025 (Full Year) | FY March 2026 (Full Year) | Change from Previous FY End |
|---|---|---|---|
| Cash Flow from Operating Activities | 305.6 | 0.2 | – |
| Cash Flow from Investing Activities | -200.0 | -0.9 | – |
| Free Cash Flow | 105.7 | -0.6 | – |
| Cash and Cash Equivalents | 1,105.6 | 1,293.2 | +187.6 |
| Interest-bearing Debt | 705.2 | 850.1 | +144.9 |
| Net Cash | 400.3 | 443.0 | +42.7 |
| Total Assets | 4,090.1 | 4,479.5 | +389.4 |
| Equity | 1,792.3 | 1,905.6 | +113.3 |
| Equity Ratio | 44 % | 43 % | -1 pts |
Sales Volume by Region
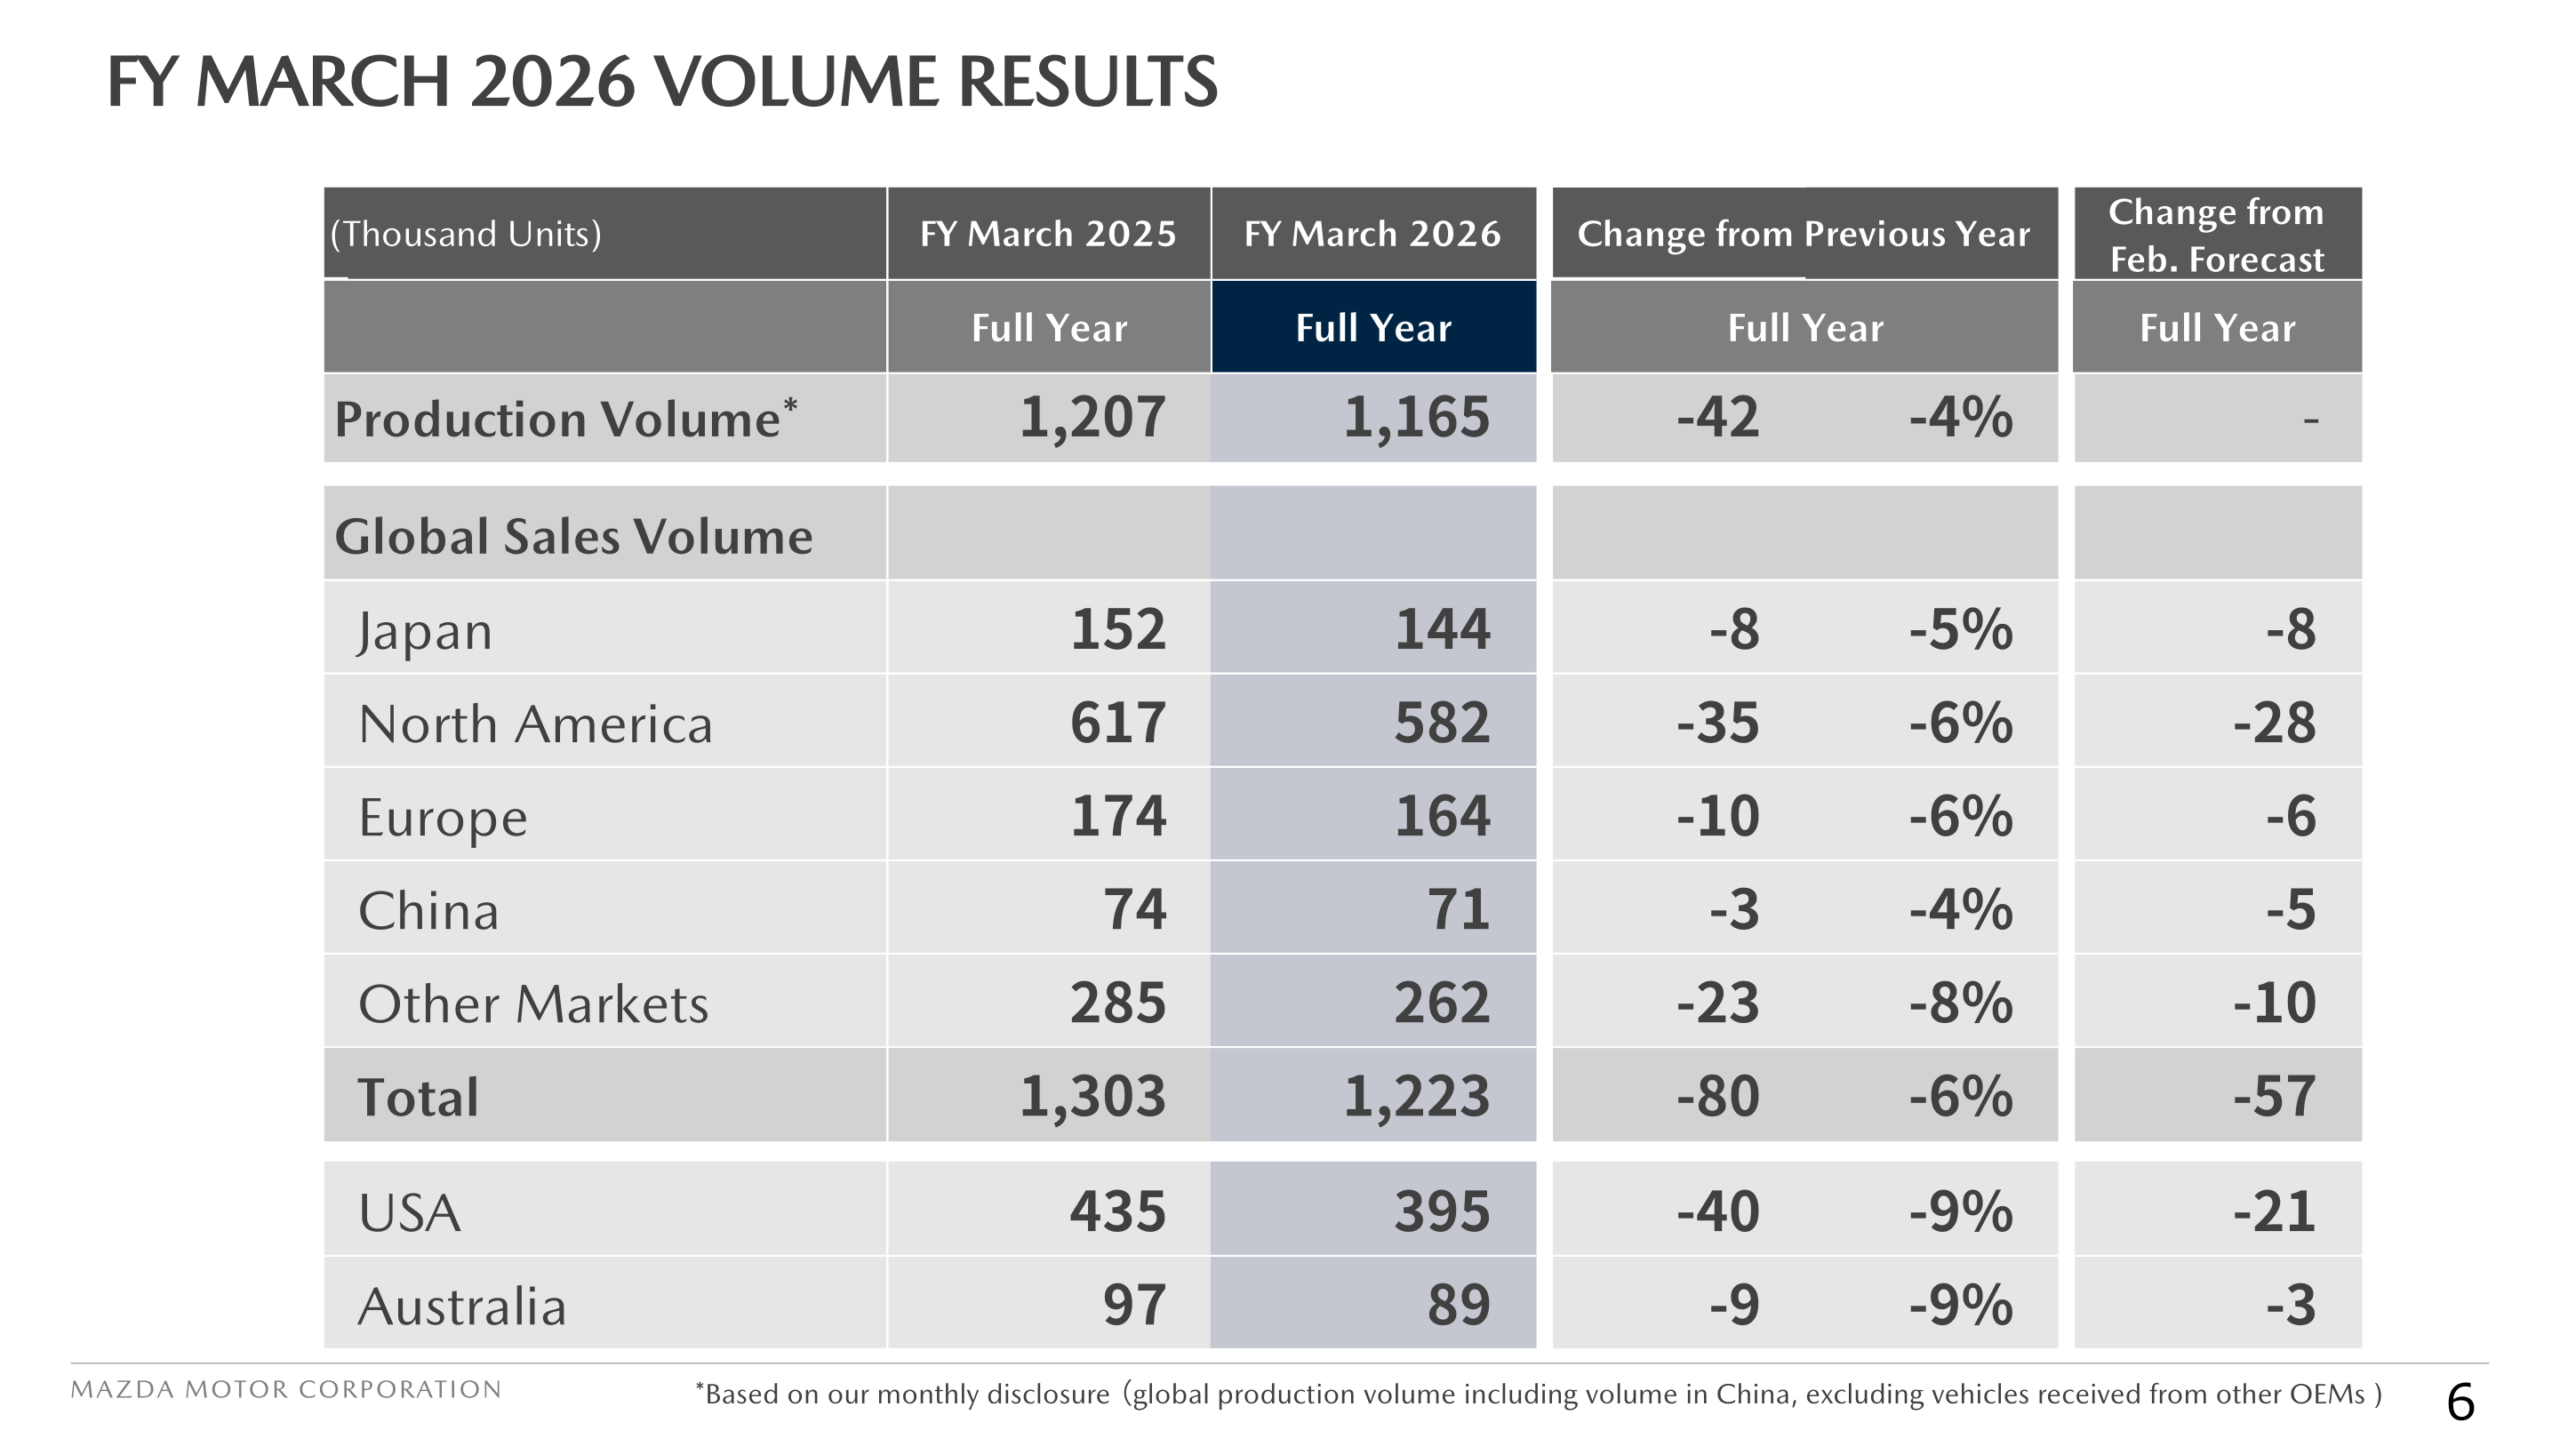
Mazda reports results by region rather than by business segment. Global sales volume totalled 1,223 thousand units in FY March 2026, down 80 thousand units or 6% year on year and 57 thousand units below the February forecast. Production volume, based on the company’s monthly disclosure of global production volume including volume in China and excluding vehicles received from other OEMs, was 1,165 thousand units, down 42 thousand units or 4%. All reported regions declined: Japan -5%, North America -6%, Europe -6%, China -4% and Other Markets -8%.
| Global Sales Volume (Thousand Units) | FY March 2025 (Full Year) | FY March 2026 (Full Year) | Change from Previous Year | Change from Feb. Forecast |
|---|---|---|---|---|
| Production Volume | 1,207 | 1,165 | -42 / -4% | – |
| Japan | 152 | 144 | -8 / -5% | -8 |
| North America | 617 | 582 | -35 / -6% | -28 |
| Europe | 174 | 164 | -10 / -6% | -6 |
| China | 74 | 71 | -3 / -4% | -5 |
| Other Markets | 285 | 262 | -23 / -8% | -10 |
| Total | 1,303 | 1,223 | -80 / -6% | -57 |
| USA (of which) | 435 | 395 | -40 / -9% | -21 |
| Australia (of which) | 97 | 89 | -9 / -9% | -3 |
In Japan, 144,000 units were sold, down 5% year on year; sales of the CX-80 and CX-30 declined while the CX-60, CX-5 and MX-5 Roadster remained strong, and market share was 3.2%, down 0.1 percentage points. In North America, U.S. sales were 395,000 units, down 9%, with the CX-5 and CX-50 strong despite shrinking demand; Mexico sold 105,000 units, on par with the previous year, helped by CX-30 sales up 13%; and Canada sold 80,000 units, up 7%. In Europe, 164,000 units were sold, down 6%, with market share down 0.1 percentage points to 1.0%. In China, 71,000 units were sold, down 4%, as increased sales of the new EZ-6 and EZ-60 electric vehicles partially offset a decline in ICE vehicle sales. In Other Markets, Australia sold 89,000 units, down 9%, and ASEAN 59,000 units, down 6%, with Vietnam reaching a record high of 34,000 units.
FY March 2027 Forecast
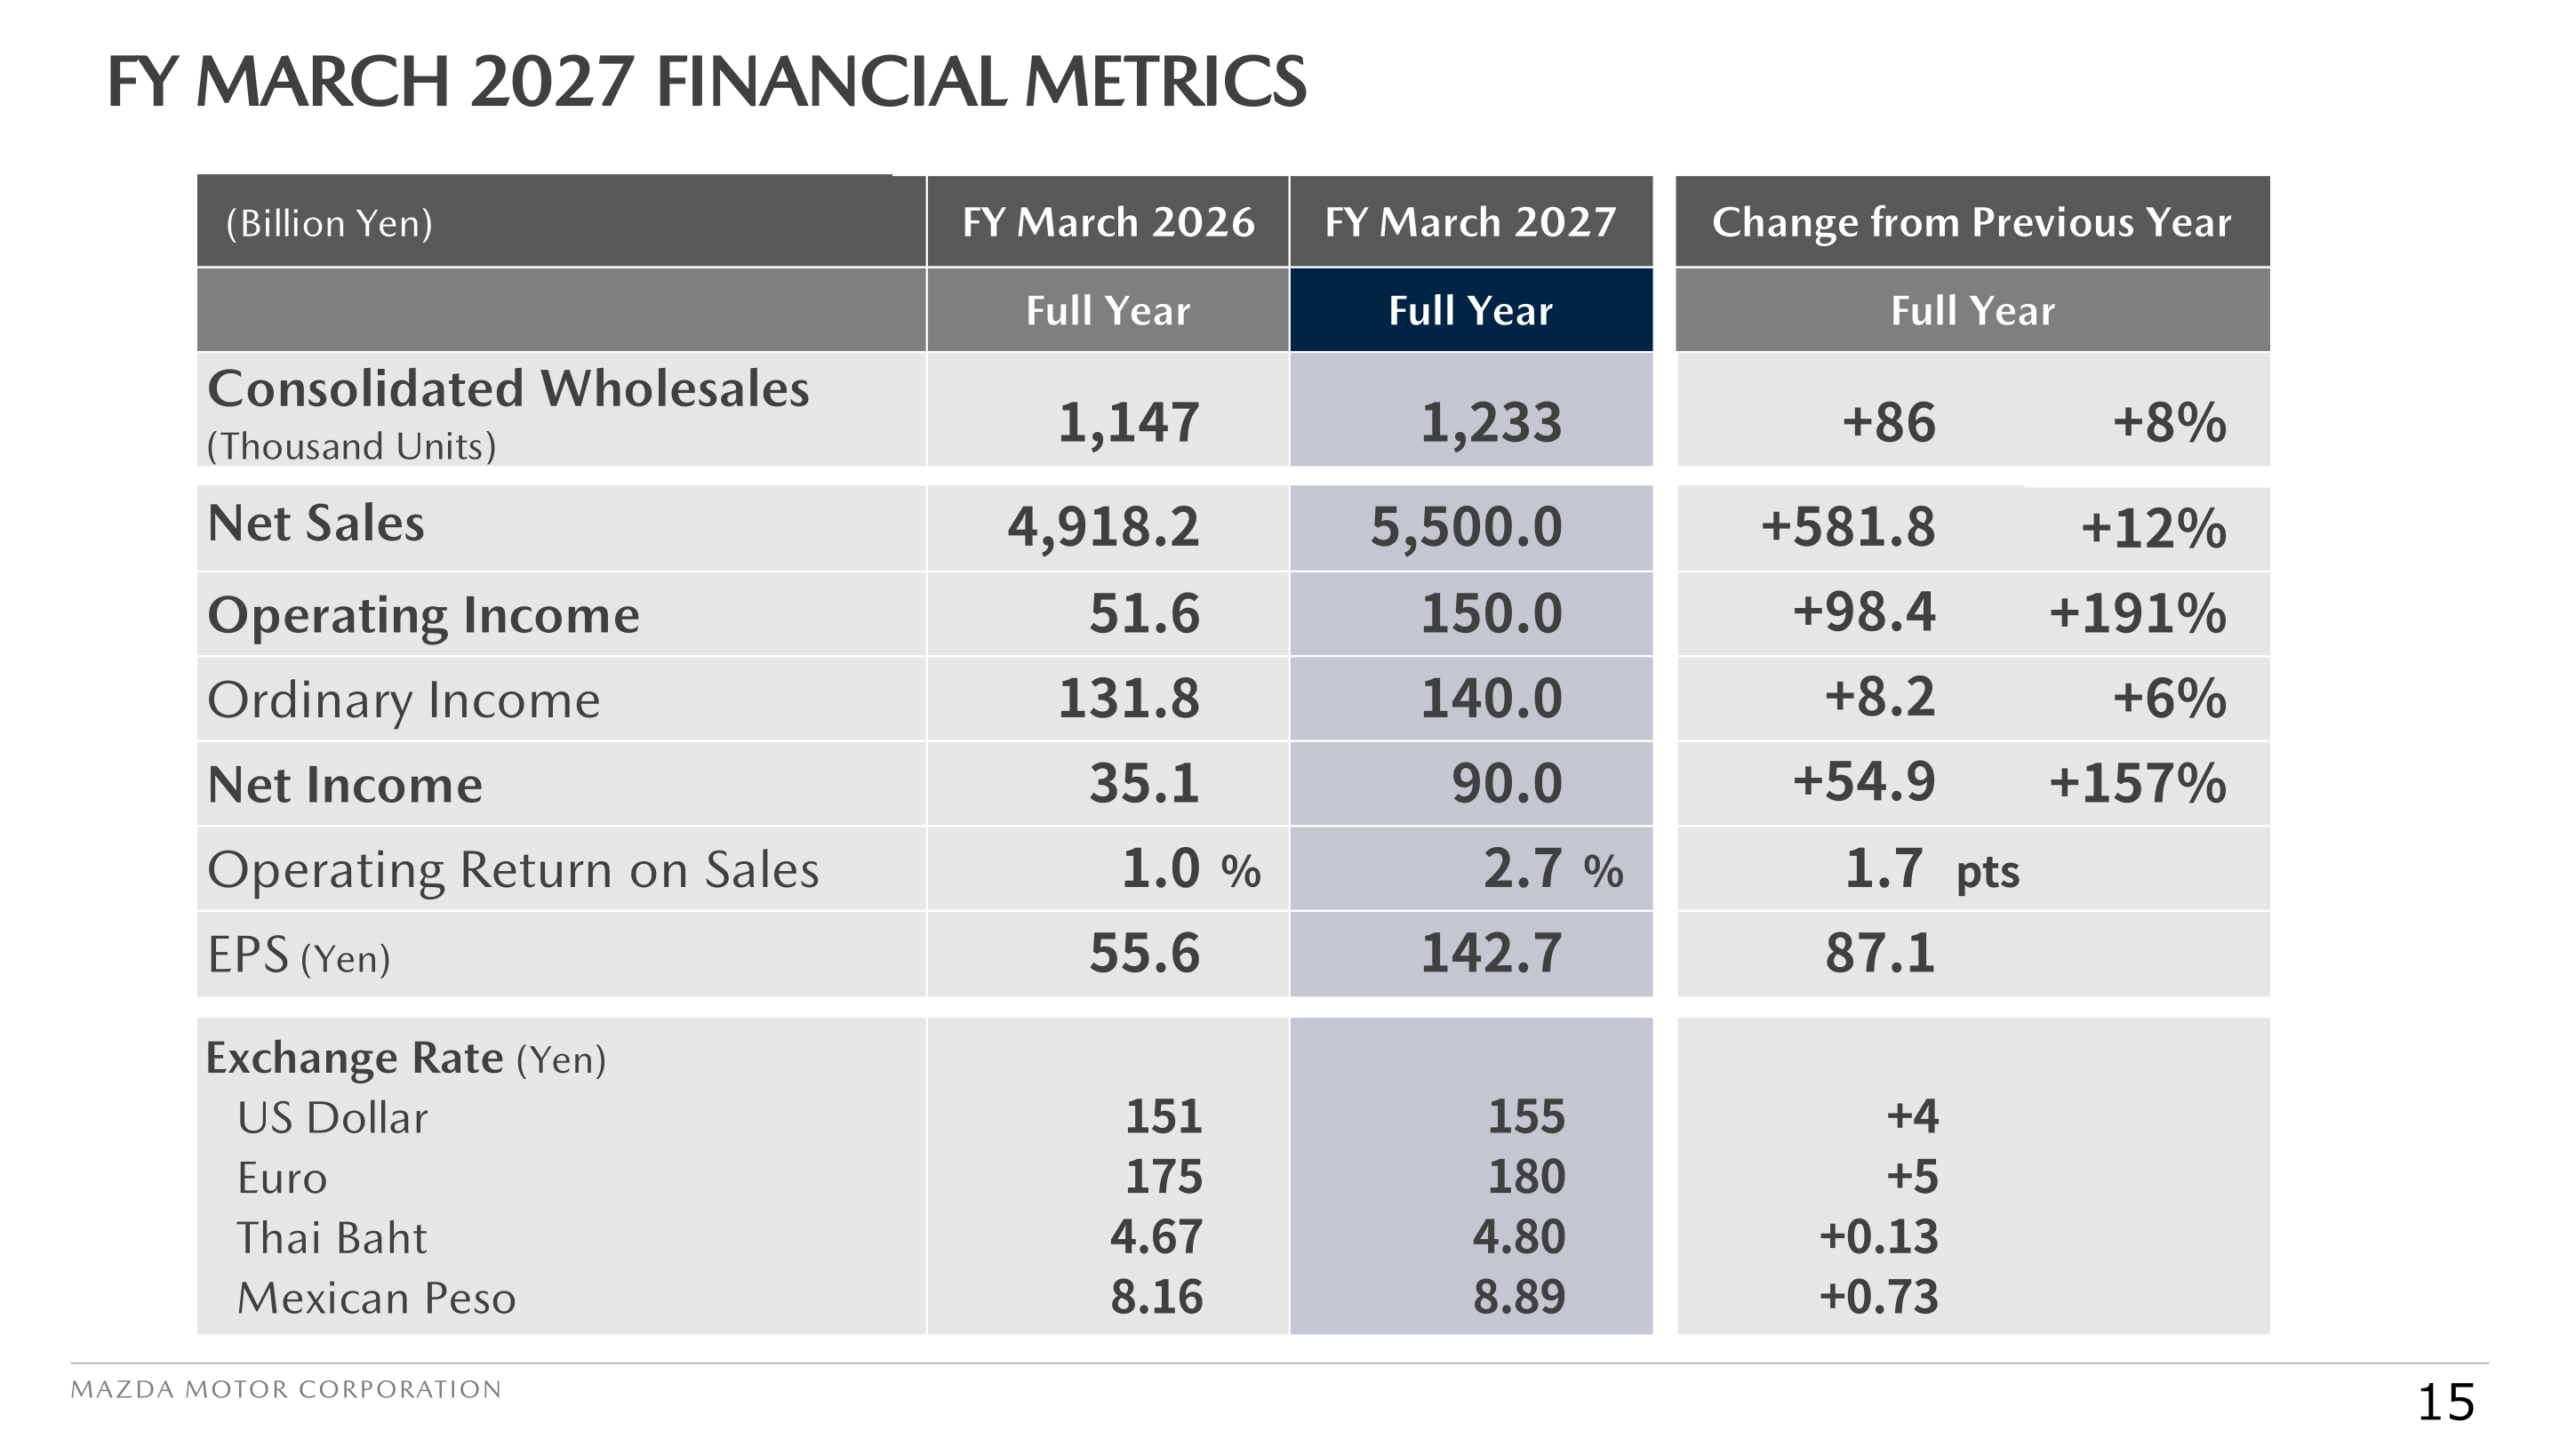
For FY March 2027 Mazda forecasts net sales of ¥5,500.0 billion, up ¥581.8 billion or 12%, operating income of ¥150.0 billion, up ¥98.4 billion or 191%, ordinary income of ¥140.0 billion, up ¥8.2 billion or 6%, and net income of ¥90.0 billion, up ¥54.9 billion or 157%. Operating return on sales is forecast at 2.7%, up 1.7 pts, with EPS of ¥142.7. Consolidated wholesales are forecast at 1,233 thousand units, up 86 thousand units or 8%, and global sales volume at 1,324 thousand units, up 102 thousand units or 8% — described by the company as 100,000-unit product-led growth including the new CX-5 launch. Assumed exchange rates are ¥155 to the U.S. dollar, ¥180 to the euro, ¥4.80 to the Thai baht and ¥8.89 to the Mexican peso. The company states it targets an improved business structure despite a sharp increase in input costs and aims to manage uncertainties in the global environment, with cumulative structural cost reduction impact exceeding ¥60 billion.
| Item | FY March 2026 (Full Year) | FY March 2027 Forecast (Full Year) | Change from Previous Year |
|---|---|---|---|
| Consolidated Wholesales (Thousand Units) | 1,147 | 1,233 | +86 / +8% |
| Net Sales (Billion Yen) | 4,918.2 | 5,500.0 | +581.8 / +12% |
| Operating Income (Billion Yen) | 51.6 | 150.0 | +98.4 / +191% |
| Ordinary Income (Billion Yen) | 131.8 | 140.0 | +8.2 / +6% |
| Net Income (Billion Yen) | 35.1 | 90.0 | +54.9 / +157% |
| Operating Return on Sales | 1.0 % | 2.7 % | 1.7 pts |
| EPS (Yen) | 55.6 | 142.7 | 87.1 |
| Exchange Rate: US Dollar (Yen) | 151 | 155 | +4 |
| Exchange Rate: Euro (Yen) | 175 | 180 | +5 |
| Exchange Rate: Thai Baht (Yen) | 4.67 | 4.80 | +0.13 |
| Exchange Rate: Mexican Peso (Yen) | 8.16 | 8.89 | +0.73 |
| Global Sales Volume Forecast (Thousand Units) | FY March 2026 (Full Year) | FY March 2027 (Full Year) | Change from Previous Year |
|---|---|---|---|
| Japan | 144 | 153 | +9 / +6% |
| North America | 582 | 629 | +47 / +8% |
| Europe | 164 | 197 | +34 / +21% |
| China | 71 | 71 | 0 / 0% |
| Other Markets | 262 | 274 | +13 / +5% |
| Total | 1,223 | 1,324 | +102 / +8% |
| USA (of which) | 395 | 435 | +41 / +10% |
| Australia (of which) | 89 | 100 | +11 / +13% |
The bridge from FY March 2026 operating income of ¥51.6 billion to the FY March 2027 forecast of ¥150.0 billion comprises volume and mix of +¥69.8 billion, foreign exchange of +¥79.8 billion, raw material and logistics costs and other items of -¥81.7 billion, cost improvement of +¥77.6 billion, growth investment of -¥30.5 billion and fixed costs and other items of -¥16.6 billion. Within cost improvement, base CI accounts for +¥29.5 billion and structural cost reduction for +¥48.1 billion. On a consolidated wholesales basis by region, the company forecasts Japan at 148 thousand units (+5, +4%), North America 632 thousand units (+51, +9%), Europe 184 thousand units (+15, +9%), Other Markets 270 thousand units (+16, +6%) and the USA 440 thousand units (+49, +12%).
Shareholder Returns
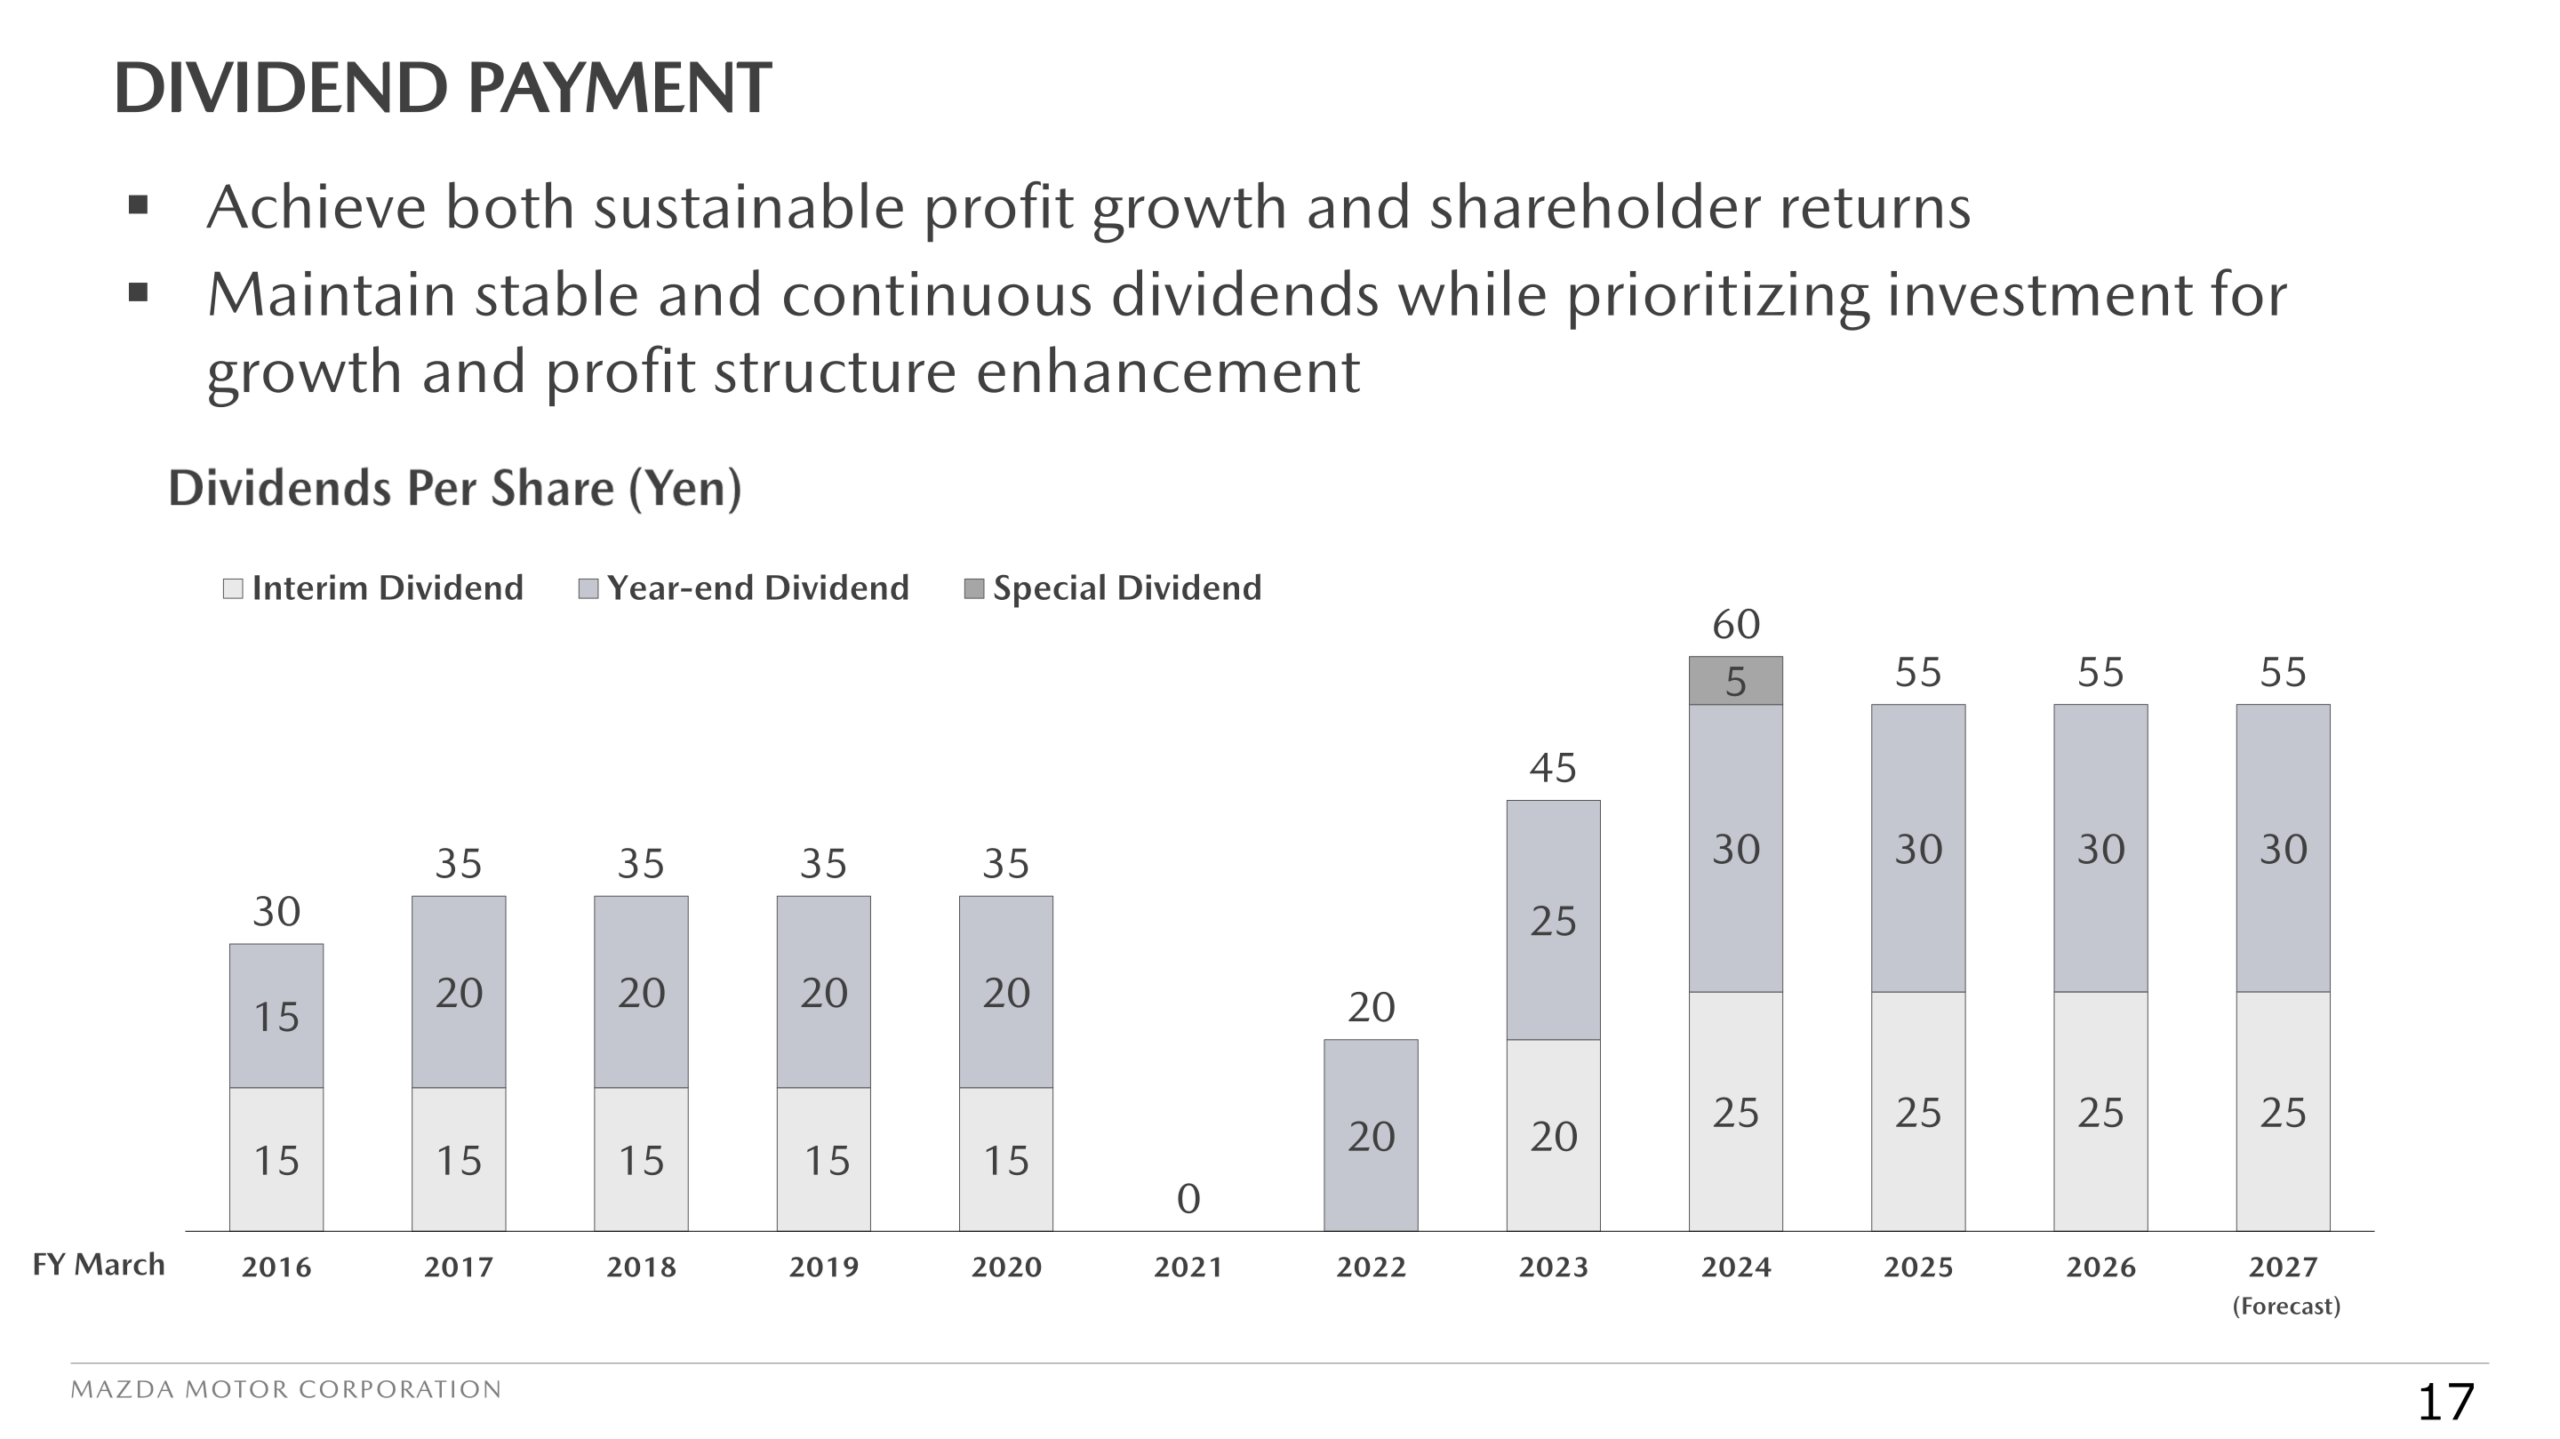
The annual dividend for FY March 2026 was ¥55 per share, and the company plans an annual dividend of ¥55 per share for FY March 2027. Mazda states that it aims to achieve both sustainable profit growth and shareholder returns, and to maintain stable and continuous dividends while prioritizing investment for growth and profit structure enhancement. No share buyback is disclosed in this presentation.
Management Policy up to 2030 and Topics
Mazda frames its progress around five themes. First, business structure transformation: moving from management focused on adapting to the business environment toward a structure resilient to external change and capable of generating stable profits, with a multi-solution strategy, a lean asset and partnership strategy, and brand value management as the top management priorities to “maintain future options.” Second, the multi-solution strategy: the company operates in more than 130 markets where the pace of electrification varies by region and regulation, and combines electrification, hybrid technology and internal combustion engines rather than converging on a single solution, supported by model-based development and a flexible production system.
Third, the lean asset and partnership strategy: electrification investment cumulative for 2022–2030, initially estimated at 1.5 trillion yen as of the November 2022 announcement and estimated at approximately 2 trillion yen due to inflation as of March 2025, has been optimized to 1.2 trillion yen as of March 2026, with the in-house BEV program thoroughly reviewed and launch timing optimized. Mazda plans to develop and launch four jointly developed electric vehicles with Changan Automobile and to establish a framework to cover 200,000 to 250,000 BEVs, approximately 15% of global sales by 2030. Fourth, business growth through brand value management: expanding to Asian markets the approach proven in the U.S., introducing Changan-developed electric vehicles sequentially in ASEAN, Europe and Australia, and introducing the next-generation CX-3 compact SUV scheduled for production at AAT in Thailand next year, while expanding the hybrid lineup from one model to four.
Fifth, cost structure reform and customer value enhancement: in Phase 2 (2025–2027) Mazda targets variable cost reductions of ¥100 billion and fixed cost reductions of ¥100 billion, aiming to improve the operating profit margin by approximately 4 percentage points (ROS +4%) to create a profit structure capable of absorbing external fluctuations. In Phase 3 (2028–2030) it plans to increase business speed and productivity through AI utilization and further streamline fixed costs. On products, the new CX-5 is now on sale in Europe and the U.S. with deliveries progressing as planned, sales began in Japan in May, and rollout is planned in Australia and other global markets; in Europe cumulative dealer orders exceeded 15,000 units. The Mazda6e, the first battery EV developed with Changan Automobile, was introduced in autumn 2025, and the second jointly developed model, the CX-6e crossover SUV, is planned around summer 2026.
This article is an analysis based on publicly available information and is not a recommendation to buy or sell any specific securities. Investment decisions are your own responsibility.
![[Obayashi] Investors’ Guide 2026 — The Complete 24-Article Breakdown](https://japan-equity.com/wp-content/uploads/2026/07/hub_cover-1024x1024.png)
![[Obayashi] IR & SR Policy — Feeding Dialogue Back into Management](https://japan-equity.com/wp-content/uploads/2026/07/p32_sq-1024x1024.jpg)
![[Obayashi] Real Estate Development — 18.7% Margin, ¥287.7bn Unrealized Gains](https://japan-equity.com/wp-content/uploads/2026/07/p20_sq-1024x1024.jpg)
![[Obayashi] Domestic Civil Engineering — Resilience Spending Supports 9.6% Margin](https://japan-equity.com/wp-content/uploads/2026/07/p11_sq-1024x1024.jpg)
![[Obayashi] Share Price & External Ratings — vs TOPIX, ESG Index Inclusion](https://japan-equity.com/wp-content/uploads/2026/07/p40_sq-1024x1024.jpg)
![[Construction] ¥75.5tn Investment, Shrinking Workforce — Big-5 Market Share](https://japan-equity.com/wp-content/uploads/2026/07/p12_sq-1024x1024.jpg)



![[Obayashi] Capital Policy & Shareholder Returns — ROE 10%+, DOE ~5%, ¥100bn Buyback](https://japan-equity.com/wp-content/uploads/2026/07/p27_sq-1024x1024.jpg)
![[Obayashi] Reducing Cross-Shareholdings — ¥285.2bn Sold in Five Years](https://japan-equity.com/wp-content/uploads/2026/07/p29_sq-1024x1024.jpg)
![[Obayashi] ¥750bn Investment Plan — ¥300bn to Development, ¥190bn to Tech/DX](https://japan-equity.com/wp-content/uploads/2026/07/p30_sq-1024x1024.jpg)
![[Obayashi] MTP2022 KPIs — Operating Profit ~2x Target, ROE 14.4%](https://japan-equity.com/wp-content/uploads/2026/07/p25_sq-1024x1024.jpg)
![[Obayashi] Cash Allocation — ¥420bn Investment CF Over Five Years](https://japan-equity.com/wp-content/uploads/2026/07/p26_sq-1024x1024.jpg)
![[Obayashi] Green Energy — 44 Plants, 344MW, and the Green Hydrogen Challenge](https://japan-equity.com/wp-content/uploads/2026/07/p21_sq-1024x1024.jpg)
![[Obayashi] Tackling the Labor Shortage — Robotics Construction®](https://japan-equity.com/wp-content/uploads/2026/07/p14_sq-1024x1024.jpg)
