
This article is based on publicly available IR materials and is not a recommendation to buy or sell any specific securities.
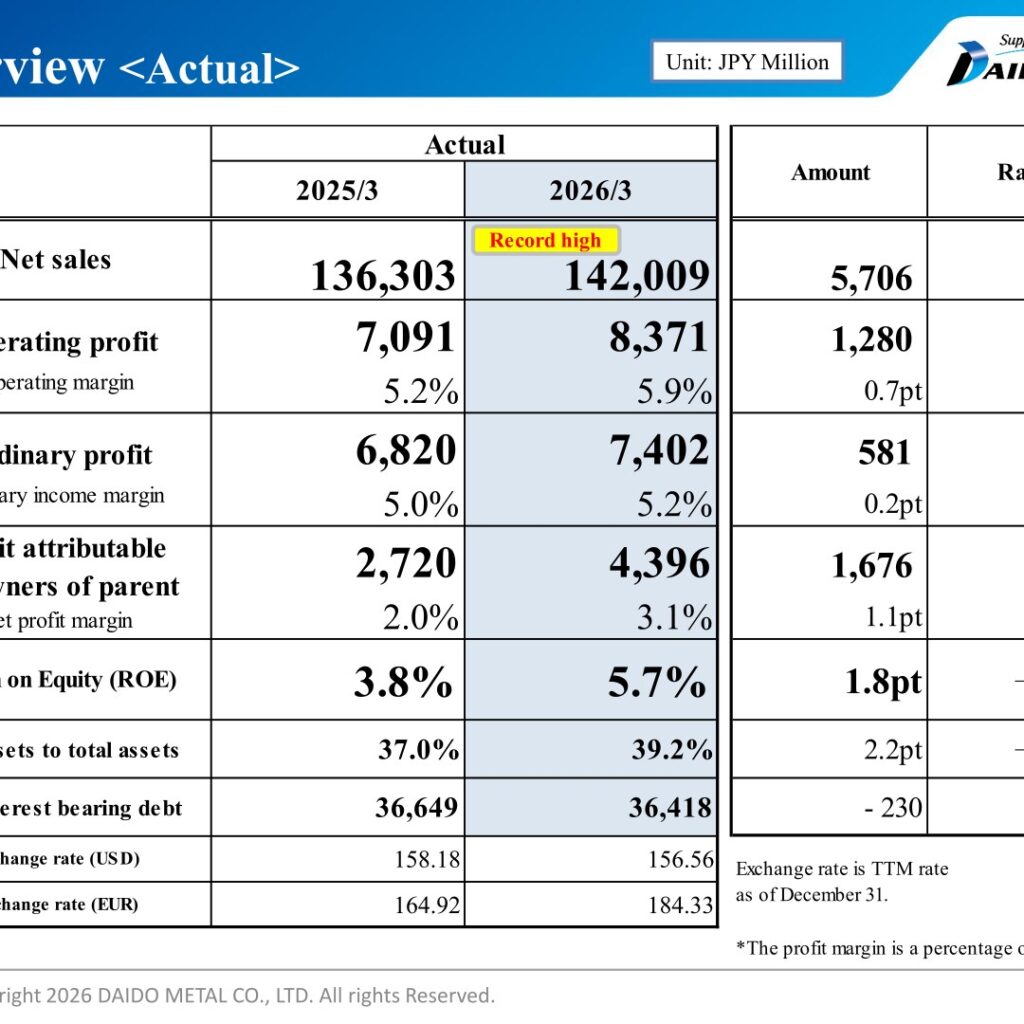
Daido Metal Co., Ltd. (TSE Prime / NSE Premier, Code: 7245) released its FY2025 Consolidated Financial Results presentation on May 12, 2026, covering the fiscal year ended March 31, 2026 (labeled “2026/3” in the materials). Net sales were JPY 142,009 million, up 4.2% year on year and marked as a record high in the materials, while operating profit rose 18.1% to JPY 8,371 million and profit attributable to owners of parent rose 61.6% to JPY 4,396 million. For the fiscal year ending March 31, 2027 (“2027/3”), the company forecasts net sales of JPY 145,000 million and operating profit of JPY 9,500 million, with the annual dividend planned to rise to 36 yen per share.
Key Points of the Results
The materials state that net sales increased year on year due to a recovery in automotive demand, continued strength in the newbuild ship market, and expanding demand for generators for marine and data center applications. Operating profit also increased year on year despite higher labor costs and tariff impacts, supported by strengthened profitability management and progress in price revisions to customers.
Consolidated Results (Full-Year Actual)
Figures are presented in JPY million. “Record high” is indicated for net sales. Exchange rates shown are TTM rates as of December 31, and profit margins are expressed as a percentage of net sales.
| Item | 2025/3 (Actual) | 2026/3 (Actual) | Change (Amount) | Change (Ratio) |
|---|---|---|---|---|
| Net sales | 136,303 | 142,009 | 5,706 | 4.2% |
| Operating profit | 7,091 | 8,371 | 1,280 | 18.1% |
| Operating margin | 5.2% | 5.9% | 0.7pt | — |
| Ordinary profit | 6,820 | 7,402 | 581 | 8.5% |
| Ordinary income margin | 5.0% | 5.2% | 0.2pt | — |
| Profit attributable to owners of parent | 2,720 | 4,396 | 1,676 | 61.6% |
| Net profit margin | 2.0% | 3.1% | 1.1pt | — |
| Return on Equity (ROE) | 3.8% | 5.7% | 1.8pt | — |
| Net assets to total assets | 37.0% | 39.2% | 2.2pt | — |
| Net interest bearing debt | 36,649 | 36,418 | – 230 | – 0.6% |
| Exchange rate (USD) | 158.18 | 156.56 | — | — |
| Exchange rate (EUR) | 164.92 | 184.33 | — | — |
On the operating profit bridge, the materials explain that although profit decreased by approximately JPY 2.27 billion due to increases in labor costs, expenses, tariff impacts, depreciation and others, the increase in labor costs was absorbed through price passing. In addition, approximately JPY 3.55 billion in profit growth was secured through profit improvement and reductions in air freight. Profit contribution from higher sales was roughly offset by the impacts of foreign exchange fluctuations and price pass-through. As a result, operating profit increased by approximately JPY 1.28 billion year on year, from JPY 7.09 billion to JPY 8.37 billion.
Segment Results
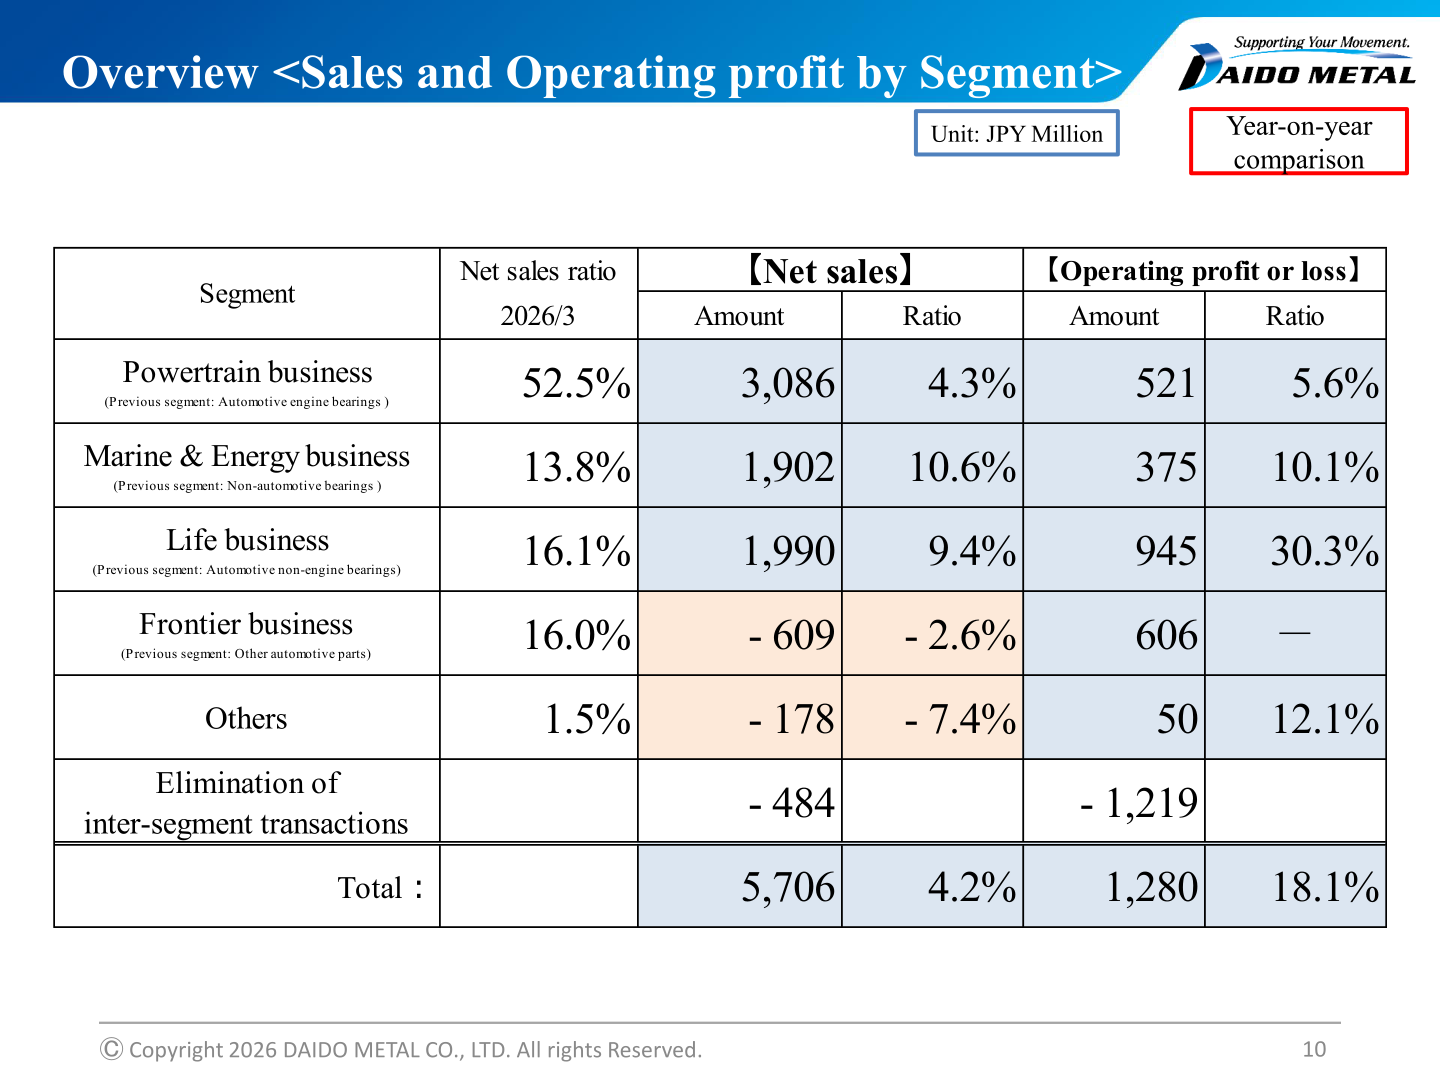
From this fiscal year the company presents its businesses under renamed segments, with the previous segment names shown in parentheses in the materials: Powertrain business (previously Automotive engine bearings), Marine & Energy business (previously Non-automotive bearings), Life business (previously Automotive non-engine bearings), Frontier business (previously Other automotive parts), and Others. The table below shows the year-on-year comparison as presented on the segment summary slide.
| Segment | Net sales ratio (2026/3) | Net sales: Change (Amount) | Net sales: Change (Ratio) | Operating profit or loss: Change (Amount) | Operating profit or loss: Change (Ratio) |
|---|---|---|---|---|---|
| Powertrain business (Previous segment: Automotive engine bearings) | 52.5% | 3,086 | 4.3% | 521 | 5.6% |
| Marine & Energy business (Previous segment: Non-automotive bearings) | 13.8% | 1,902 | 10.6% | 375 | 10.1% |
| Life business (Previous segment: Automotive non-engine bearings) | 16.1% | 1,990 | 9.4% | 945 | 30.3% |
| Frontier business (Previous segment: Other automotive parts) | 16.0% | – 609 | – 2.6% | 606 | — |
| Others | 1.5% | – 178 | – 7.4% | 50 | 12.1% |
| Elimination of inter-segment transactions | – 484 | – 1,219 | |||
| Total | 5,706 | 4.2% | 1,280 | 18.1% |
The individual segment slides show sales and operating profit or loss before elimination of inter-segment transactions, in JPY million.
| Segment | Net sales 2025/3 | Net sales 2026/3 | Operating profit or loss 2025/3 | Operating profit or loss 2026/3 |
|---|---|---|---|---|
| Powertrain business | 72,589 | 75,675 | 9,285 | 9,806 |
| Marine & Energy business | 17,923 | 19,825 | 3,712 | 4,088 |
| Life business | 21,266 | 23,257 | 3,119 | 4,064 |
| Frontier business | 23,680 | 23,071 | -1,362 | -755 |
| Others | 2,403 | 2,224 | 416 | 467 |
For the Powertrain business, the materials cite strong demand for passenger cars in Japan, a recovery in demand for trucks, increased orders due to the launch of new models and progress in price revisions; higher orders in South Korea on market recovery and strong hybrid vehicle demand; higher orders in China on recovering Chinese brand vehicle demand, expanding plug-in hybrid sales and Chinese brand motorcycle development; and higher orders in North America driven by hybrid vehicle demand and increased share for downsizing engines. In Europe, demand for internal combustion engine vehicles decreased due to the slump in the automotive industry and the impact of vehicle electrification. In the Marine & Energy business, supply capacity for large ships expanded on strong newbuild demand and in-house facility expansion, and orders increased for marine auxiliary equipment, industrial generators including those for data centers, and bearings for medium and high-speed engines transferred from competitors. The Life business benefited from the recovery in the Japanese automotive market (a rebound from the previous year’s vehicle certification issues), progress in price revisions, and higher orders for shock absorber bearings in China. In the Frontier business, net sales declined while the operating loss narrowed to JPY -755 million on lower transportation costs (air freight) and other cost reductions.
Results by Region
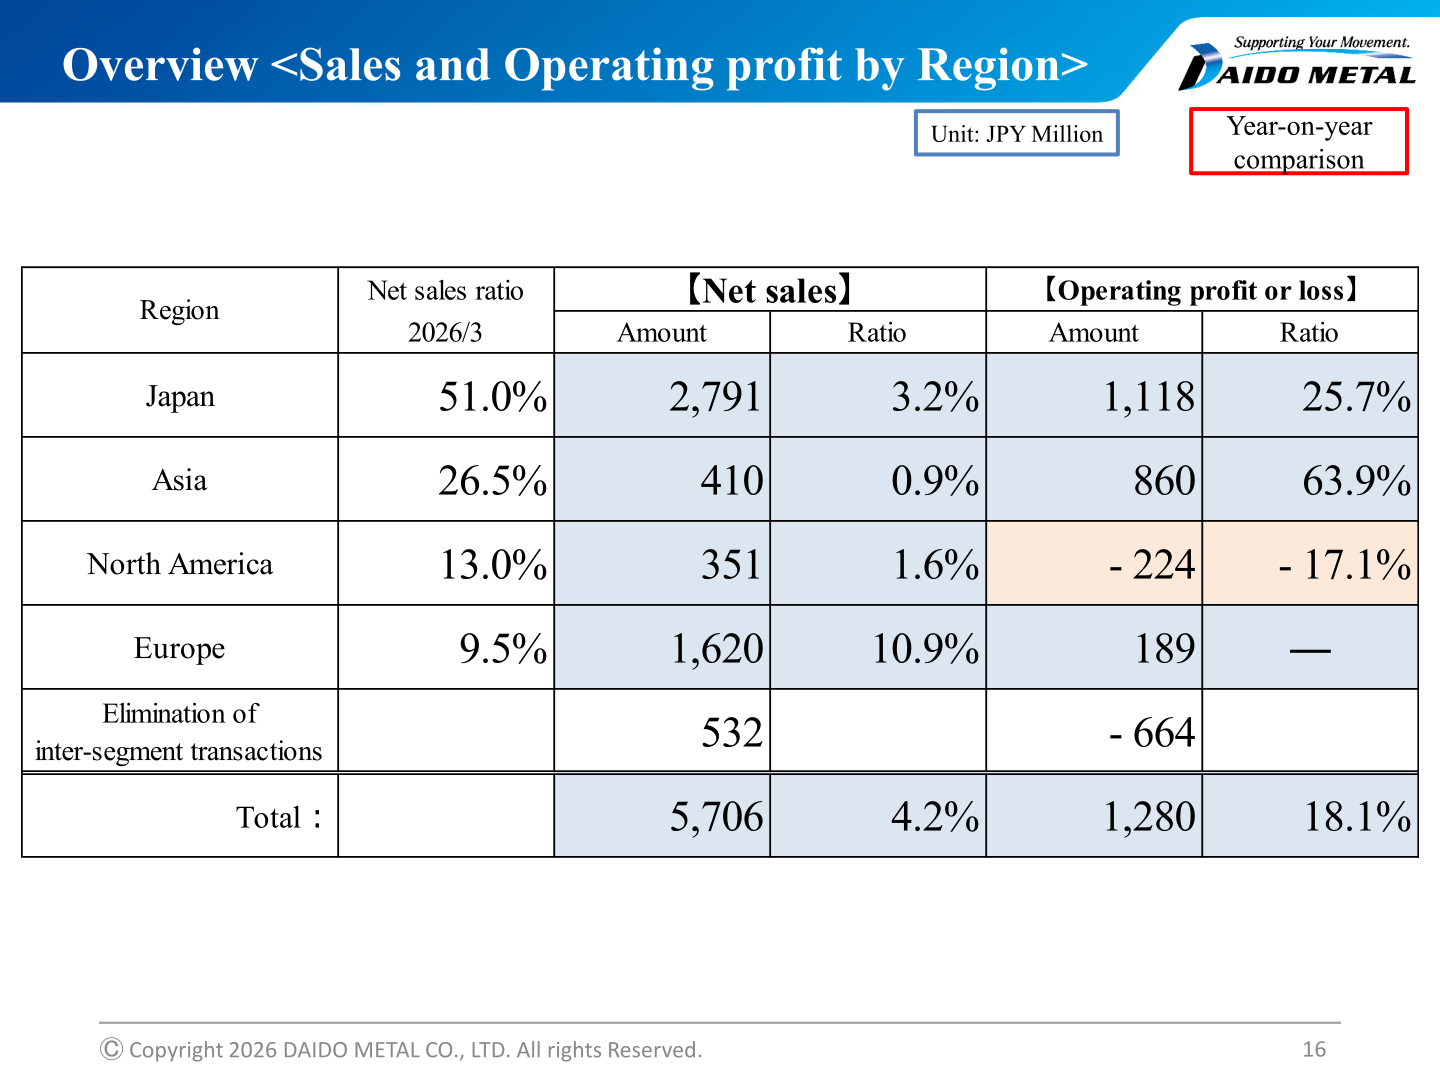
The materials also present a year-on-year comparison by region (JPY million).
| Region | Net sales ratio (2026/3) | Net sales: Change (Amount) | Net sales: Change (Ratio) | Operating profit or loss: Change (Amount) | Operating profit or loss: Change (Ratio) |
|---|---|---|---|---|---|
| Japan | 51.0% | 2,791 | 3.2% | 1,118 | 25.7% |
| Asia | 26.5% | 410 | 0.9% | 860 | 63.9% |
| North America | 13.0% | 351 | 1.6% | – 224 | – 17.1% |
| Europe | 9.5% | 1,620 | 10.9% | 189 | — |
| Elimination of inter-segment transactions | 532 | – 664 | |||
| Total | 5,706 | 4.2% | 1,280 | 18.1% |
On a before-elimination basis, Japan net sales rose from 85,905 to 88,697 and operating profit from 4,346 to 5,465; Asia rose from 45,660 to 46,070 in sales and from 1,346 to 2,207 in operating profit; North America sales rose from 22,267 to 22,618 while operating profit declined from 1,312 to 1,087, reflecting the cost impact of changes in the tariff environment and delayed pass-through of price revisions for precision metal work parts; and Europe sales rose from 14,909 to 16,529 with operating profit or loss improving from -156 to 33, where the materials cite the impact of yen depreciation.
FY2026 Forecast
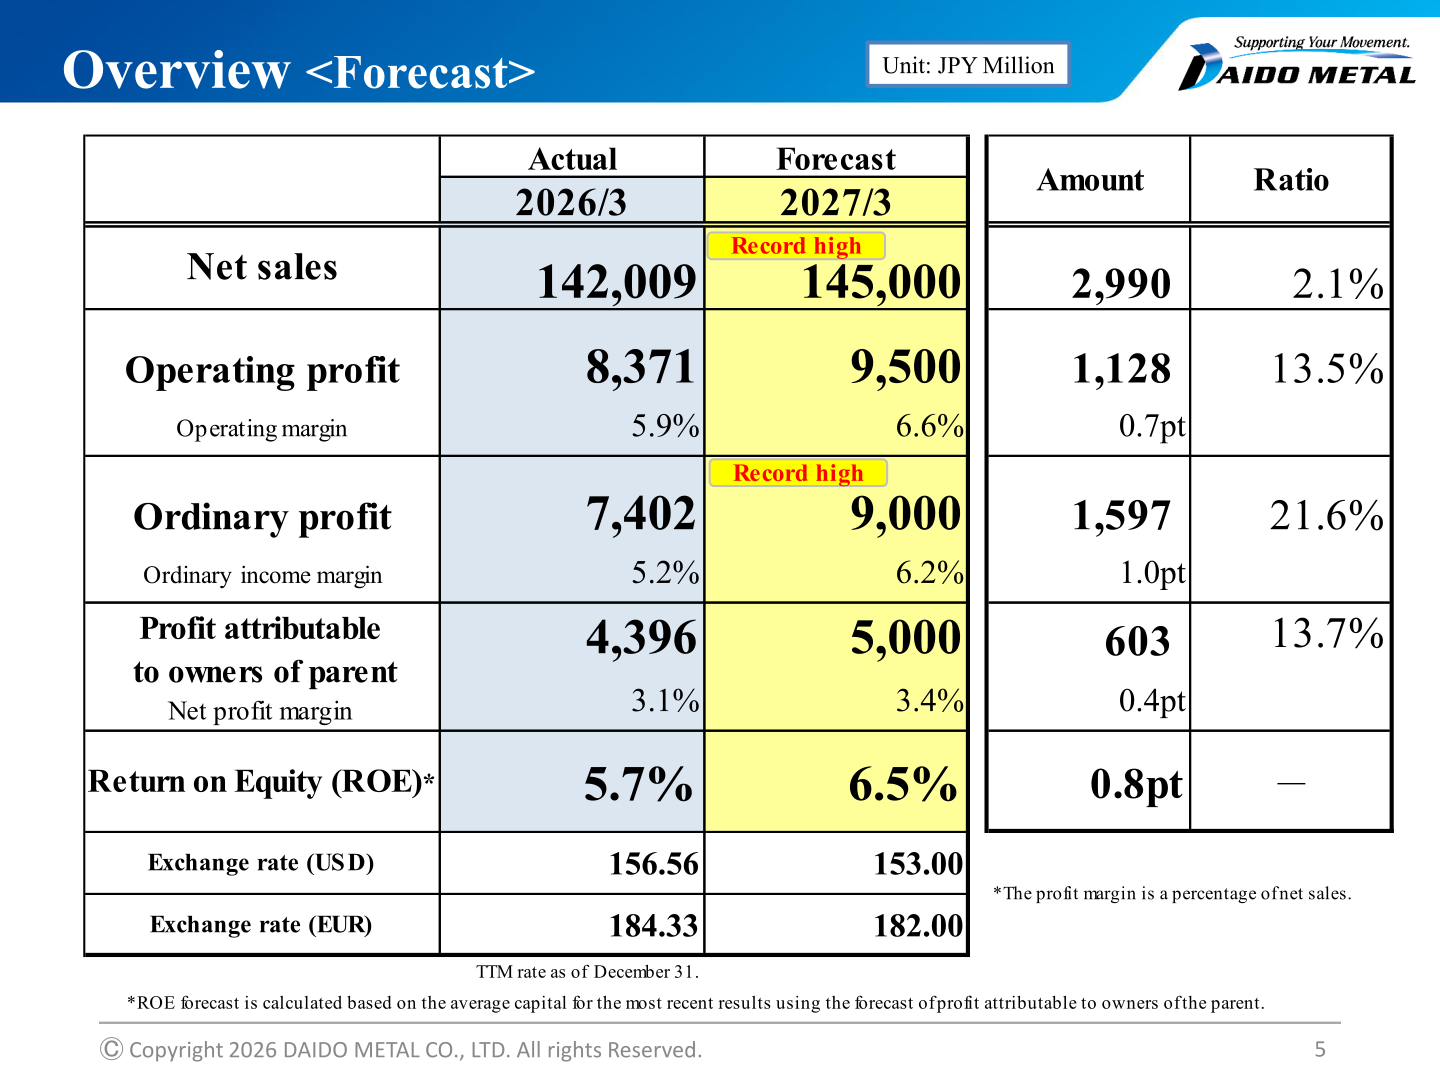
For the fiscal year ending March 31, 2027, net sales are forecast to increase to JPY 145.0 billion, supported in part by growing demand for generators for marine and data center applications. Although uncertainty in the external environment remains, operating profit is forecast to increase to JPY 9.5 billion due to the continued strengthening of profitability management. “Record high” is indicated for the forecast net sales and forecast ordinary profit.
| Item | 2026/3 (Actual) | 2027/3 (Forecast) | Change (Amount) | Change (Ratio) |
|---|---|---|---|---|
| Net sales | 142,009 | 145,000 | 2,990 | 2.1% |
| Operating profit | 8,371 | 9,500 | 1,128 | 13.5% |
| Operating margin | 5.9% | 6.6% | 0.7pt | — |
| Ordinary profit | 7,402 | 9,000 | 1,597 | 21.6% |
| Ordinary income margin | 5.2% | 6.2% | 1.0pt | — |
| Profit attributable to owners of parent | 4,396 | 5,000 | 603 | 13.7% |
| Net profit margin | 3.1% | 3.4% | 0.4pt | — |
| Return on Equity (ROE) | 5.7% | 6.5% | 0.8pt | — |
| Exchange rate (USD) | 156.56 | 153.00 | — | — |
| Exchange rate (EUR) | 184.33 | 182.00 | — | — |
On the forecast operating profit bridge, the materials state that although profit is expected to decrease by approximately JPY 2.75 billion due to increases in labor costs (including investments in human capital), expenses and others, approximately JPY 3.87 billion in profit growth is expected to be generated through higher sales, price passing of increased labor costs, and profit improvement. Foreign exchange impacts are expected to be limited. As a result, operating profit is forecast to increase by approximately JPY 1.12 billion year on year, from JPY 8.37 billion to JPY 9.50 billion.
Shareholder Returns
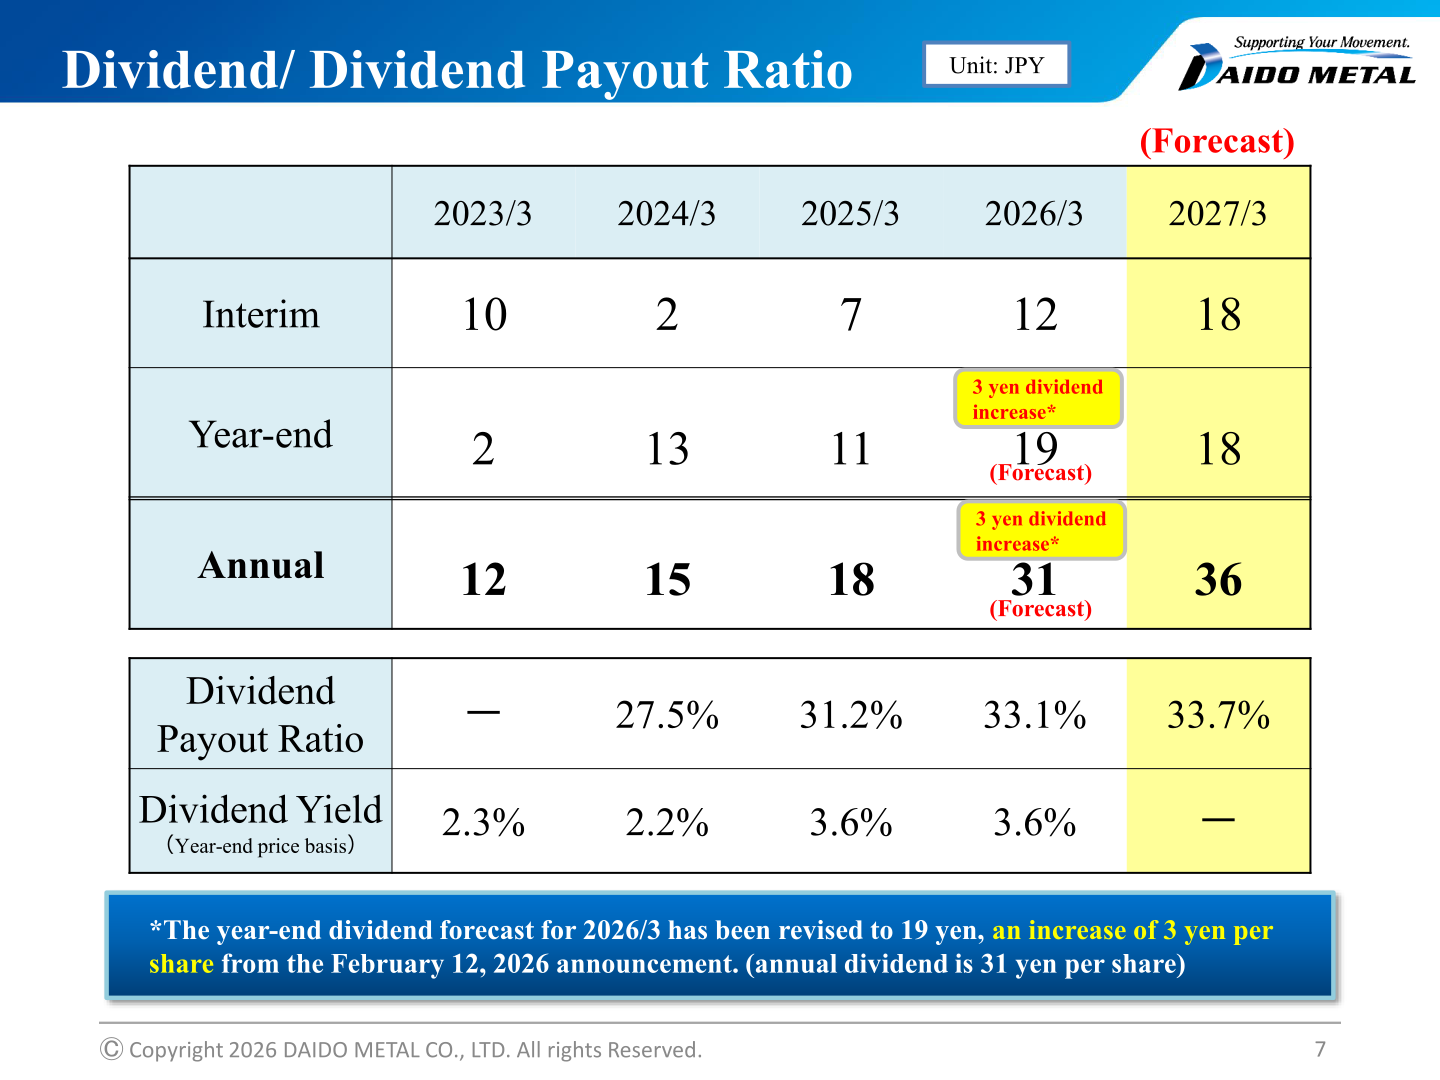
Annual dividends for the fiscal year ending March 31, 2026 are projected to rise by 13 yen year on year to 31 yen per share, reflecting a 3 yen upward revision to the year-end dividend forecast to 19 yen from the February 12, 2026 announcement, with a payout ratio of 33.1%. For the fiscal year ending March 31, 2027, annual dividends are planned to increase by 5 yen to 36 yen per share, with an expected payout ratio of 33.7%. The materials state that shareholder returns will be implemented in line with the shareholder return policy set forth in the medium-term management plan.
| Item (Unit: JPY) | 2023/3 | 2024/3 | 2025/3 | 2026/3 | 2027/3 (Forecast) |
|---|---|---|---|---|---|
| Interim | 10 | 2 | 7 | 12 | 18 |
| Year-end | 2 | 13 | 11 | 19 | 18 |
| Annual | 12 | 15 | 18 | 31 | 36 |
| Dividend Payout Ratio | ー | 27.5% | 31.2% | 33.1% | 33.7% |
| Dividend Yield (Year-end price basis) | 2.3% | 2.2% | 3.6% | 3.6% | ー |
Capital Expenditure, Depreciation and R&D
Capital expenditure and depreciation are shown in JPY billion. Capital expenditure was 10.9 in 2026/3 against depreciation of 9.9, and the 2027/3 forecast is 8.0 for capital expenditure and 9.5 for depreciation. R&D expenses were 2.8 in 2026/3, with 2.5 forecast for 2027/3.
| Item (Unit: JPY Billion) | 2023/3 | 2024/3 | 2025/3 | 2026/3 | 2027/3 (Forecast) |
|---|---|---|---|---|---|
| Capital Expenditure | 5.9 | 7.7 | 11.5 | 10.9 | 8.0 |
| Depreciation | 9.1 | 9.5 | 9.5 | 9.9 | 9.5 |
| R&D expenses | 2.2 | 2.3 | 2.5 | 2.8 | 2.5 |
This article is an analysis based on publicly available information and is not a recommendation to buy or sell any specific securities. Investment decisions are your own responsibility.
![[Obayashi] Investors’ Guide 2026 — The Complete 24-Article Breakdown](https://japan-equity.com/wp-content/uploads/2026/07/hub_cover-1024x1024.png)
![[Obayashi] IR & SR Policy — Feeding Dialogue Back into Management](https://japan-equity.com/wp-content/uploads/2026/07/p32_sq-1024x1024.jpg)
![[Obayashi] Real Estate Development — 18.7% Margin, ¥287.7bn Unrealized Gains](https://japan-equity.com/wp-content/uploads/2026/07/p20_sq-1024x1024.jpg)
![[Obayashi] Domestic Civil Engineering — Resilience Spending Supports 9.6% Margin](https://japan-equity.com/wp-content/uploads/2026/07/p11_sq-1024x1024.jpg)
![[Obayashi] Share Price & External Ratings — vs TOPIX, ESG Index Inclusion](https://japan-equity.com/wp-content/uploads/2026/07/p40_sq-1024x1024.jpg)
![[Construction] ¥75.5tn Investment, Shrinking Workforce — Big-5 Market Share](https://japan-equity.com/wp-content/uploads/2026/07/p12_sq-1024x1024.jpg)



![[Obayashi] Capital Policy & Shareholder Returns — ROE 10%+, DOE ~5%, ¥100bn Buyback](https://japan-equity.com/wp-content/uploads/2026/07/p27_sq-1024x1024.jpg)
![[Obayashi] Reducing Cross-Shareholdings — ¥285.2bn Sold in Five Years](https://japan-equity.com/wp-content/uploads/2026/07/p29_sq-1024x1024.jpg)
![[Obayashi] ¥750bn Investment Plan — ¥300bn to Development, ¥190bn to Tech/DX](https://japan-equity.com/wp-content/uploads/2026/07/p30_sq-1024x1024.jpg)
![[Obayashi] MTP2022 KPIs — Operating Profit ~2x Target, ROE 14.4%](https://japan-equity.com/wp-content/uploads/2026/07/p25_sq-1024x1024.jpg)
![[Obayashi] Cash Allocation — ¥420bn Investment CF Over Five Years](https://japan-equity.com/wp-content/uploads/2026/07/p26_sq-1024x1024.jpg)
![[Obayashi] Green Energy — 44 Plants, 344MW, and the Green Hydrogen Challenge](https://japan-equity.com/wp-content/uploads/2026/07/p21_sq-1024x1024.jpg)
![[Obayashi] Tackling the Labor Shortage — Robotics Construction®](https://japan-equity.com/wp-content/uploads/2026/07/p14_sq-1024x1024.jpg)
