
This article is based on publicly available IR materials and is not a recommendation to buy or sell any specific securities.
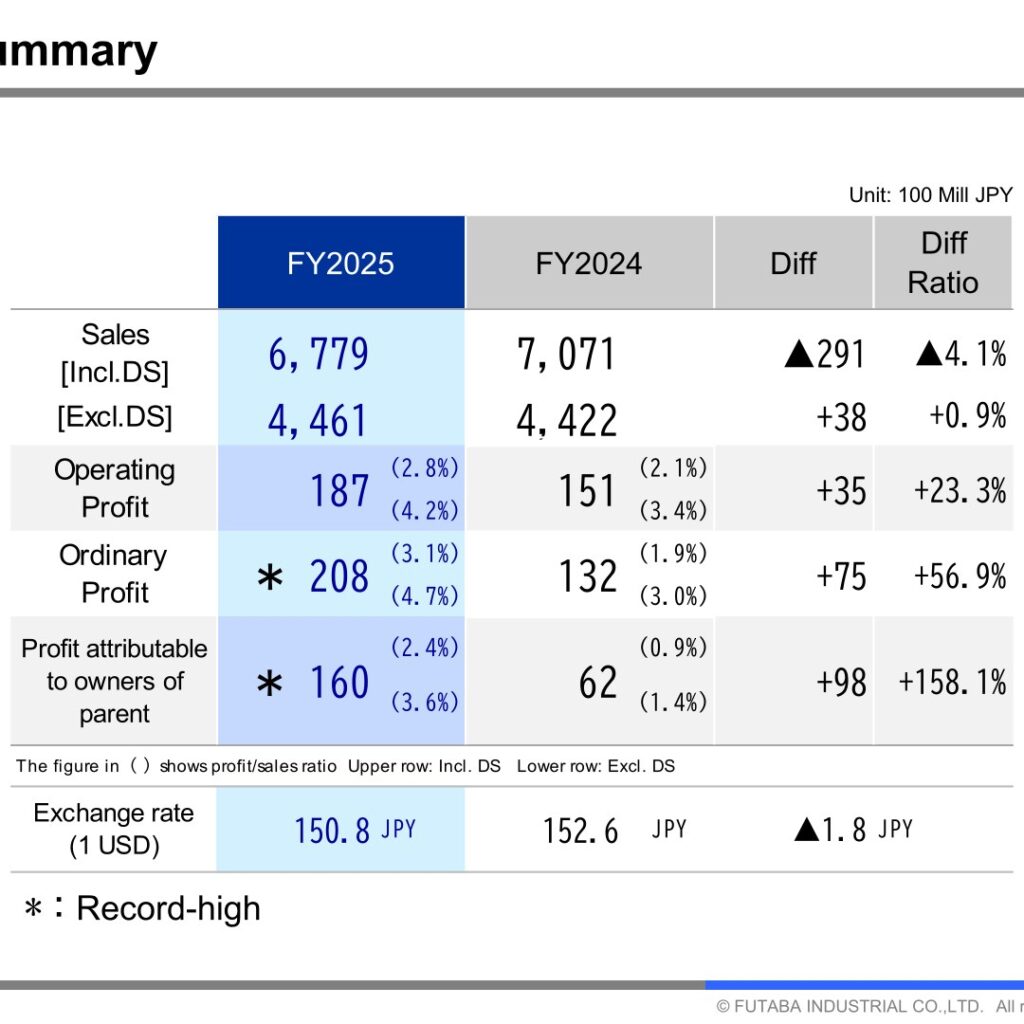
Futaba Industrial Co., Ltd. reported FY2025 (112th term) sales including DS parts of 6,779, down ▲291 or ▲4.1% year on year, while sales excluding DS parts rose +38 or +0.9% to 4,461. Operating profit increased +35 or +23.3% to 187, ordinary profit rose +75 or +56.9% to 208, and profit attributable to owners of parent rose +98 or +158.1% to 160. The presentation marks ordinary profit and profit attributable to owners of parent with an asterisk denoting “Record-high.” For FY2026 the company forecasts operating profit of 190 (+1.6%) but profit attributable to owners of parent of 140 (▲12.5%). All figures in this article are stated in the presentation’s unit of 100 Mill JPY unless otherwise noted.
Consolidated Results (Full-Year Actual)
The PL summary separates sales including and excluding DS parts (Direct Supply Parts, defined in the deck as parts supplied by customers whose value is included in the selling price with no profit impact). The figures in parentheses on the slide are profit/sales ratios, with the upper row calculated on sales including DS parts and the lower row on sales excluding DS parts: operating profit 2.8% / 4.2%, ordinary profit 3.1% / 4.7% and profit attributable to owners of parent 2.4% / 3.6% in FY2025.
| Item (Unit: 100 Mill JPY) | FY2025 | FY2024 | Diff | Diff Ratio |
|---|---|---|---|---|
| Sales [Incl.DS] | 6,779 | 7,071 | ▲291 | ▲4.1% |
| Sales [Excl.DS] | 4,461 | 4,422 | +38 | +0.9% |
| Operating Profit | 187 | 151 | +35 | +23.3% |
| Ordinary Profit | 208 | 132 | +75 | +56.9% |
| Profit attributable to owners of parent | 160 | 62 | +98 | +158.1% |
| Exchange rate (1 USD) | 150.8 JPY | 152.6 JPY | ▲1.8 JPY |
The sales bridge on P.3 shows that the DS amount fell from 2,649 to 2,318, which is why sales including DS parts declined while sales excluding DS parts increased. Excluding external factors, sales excluding DS parts would have been 4,573, or +150 (+3.4%): the external factor totalled ▲112, made up of a material impact of ▲117 and an exchange rate impact of +5.
Segment Results (by Region, Excl.DS)
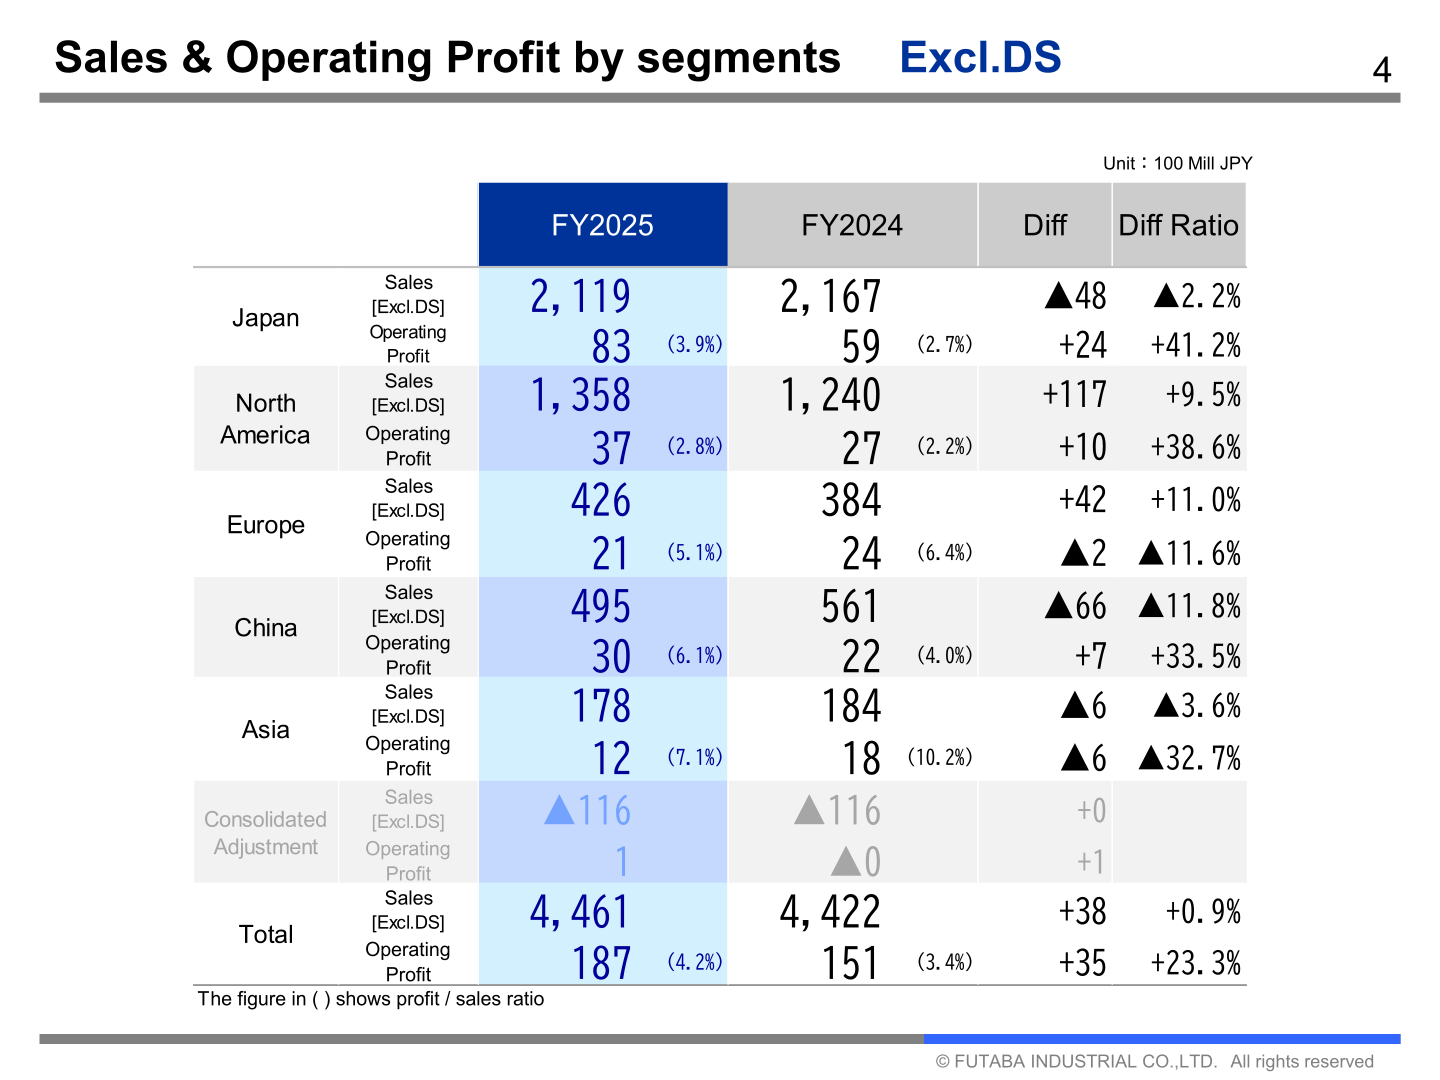
Japan remained the largest region with sales excluding DS parts of 2,119, down ▲48 (▲2.2%), but its operating profit rose +24 (+41.2%) to 83 with a margin of 3.9%. North America grew sales +117 (+9.5%) to 1,358 and lifted operating profit +10 (+38.6%) to 37. Europe grew sales +42 (+11.0%) to 426 but operating profit fell ▲2 (▲11.6%) to 21. China’s sales declined ▲66 (▲11.8%) to 495 while operating profit rose +7 (+33.5%) to 30, and Asia’s sales fell ▲6 (▲3.6%) to 178 with operating profit down ▲6 (▲32.7%) to 12.
| Segment (Excl.DS) | Sales FY2025 | Sales FY2024 | Operating Profit FY2025 | Operating Profit FY2024 |
|---|---|---|---|---|
| Japan | 2,119 | 2,167 | 83 | 59 |
| North America | 1,358 | 1,240 | 37 | 27 |
| Europe | 426 | 384 | 21 | 24 |
| China | 495 | 561 | 30 | 22 |
| Asia | 178 | 184 | 12 | 18 |
| Consolidated Adjustment | ▲116 | ▲116 | 1 | ▲0 |
| Total | 4,461 | 4,422 | 187 | 151 |
The operating profit flux analysis on P.5 bridges FY2024’s 151 to FY2025’s 187, a gap of +35. Favorable items were price pass-through +122, kaizen +32, depreciation +26 and parts sales volume +10; unfavorable items were material, labor and expense ▲93, non-parts business ▲34 (of which tooling sales ▲31) and sales price revision ▲28. By region the gap was +24 in Japan, +10 in North America, ▲2 in Europe, +7 in China, ▲6 in Asia and +1 in the adjustment.
Sales by Customer
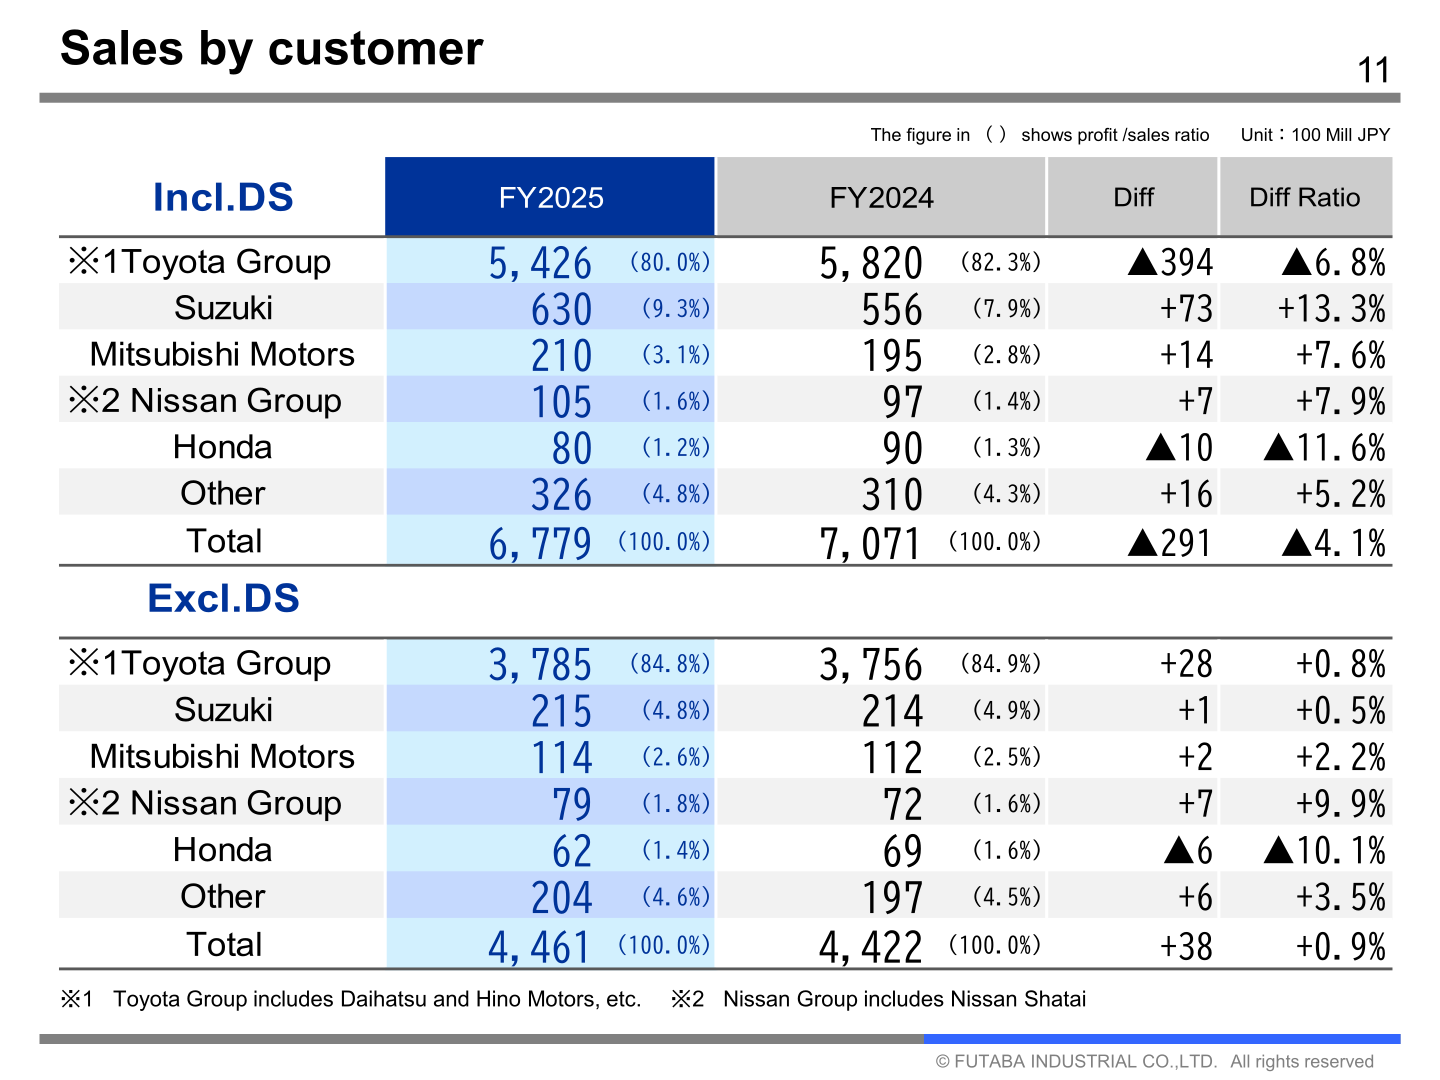
On a basis including DS parts, the Toyota Group (which the deck notes includes Daihatsu and Hino Motors, etc.) accounted for 80.0% of sales in FY2025 against 82.3% in FY2024, while Suzuki rose to 9.3% from 7.9%. Excluding DS parts, the Toyota Group share was 84.8% versus 84.9%, and total sales excluding DS parts were 4,461 against 4,422.
| Customer (Incl.DS) | FY2025 | FY2024 | Diff | Diff Ratio |
|---|---|---|---|---|
| Toyota Group | 5,426 (80.0%) | 5,820 (82.3%) | ▲394 | ▲6.8% |
| Suzuki | 630 (9.3%) | 556 (7.9%) | +73 | +13.3% |
| Mitsubishi Motors | 210 (3.1%) | 195 (2.8%) | +14 | +7.6% |
| Nissan Group | 105 (1.6%) | 97 (1.4%) | +7 | +7.9% |
| Honda | 80 (1.2%) | 90 (1.3%) | ▲10 | ▲11.6% |
| Other | 326 (4.8%) | 310 (4.3%) | +16 | +5.2% |
| Total | 6,779 (100.0%) | 7,071 (100.0%) | ▲291 | ▲4.1% |
The product mix slide shows that on a sales basis including DS parts, exhaust and fuel system parts represented 46.9% and body and interior parts 42.5%, whereas excluding DS parts the shares were 28.9% (▲18.0pt) and 56.1% (+13.6pt) respectively, with suspension at 7.7% and other at 7.4%.
FY2026 Forecast
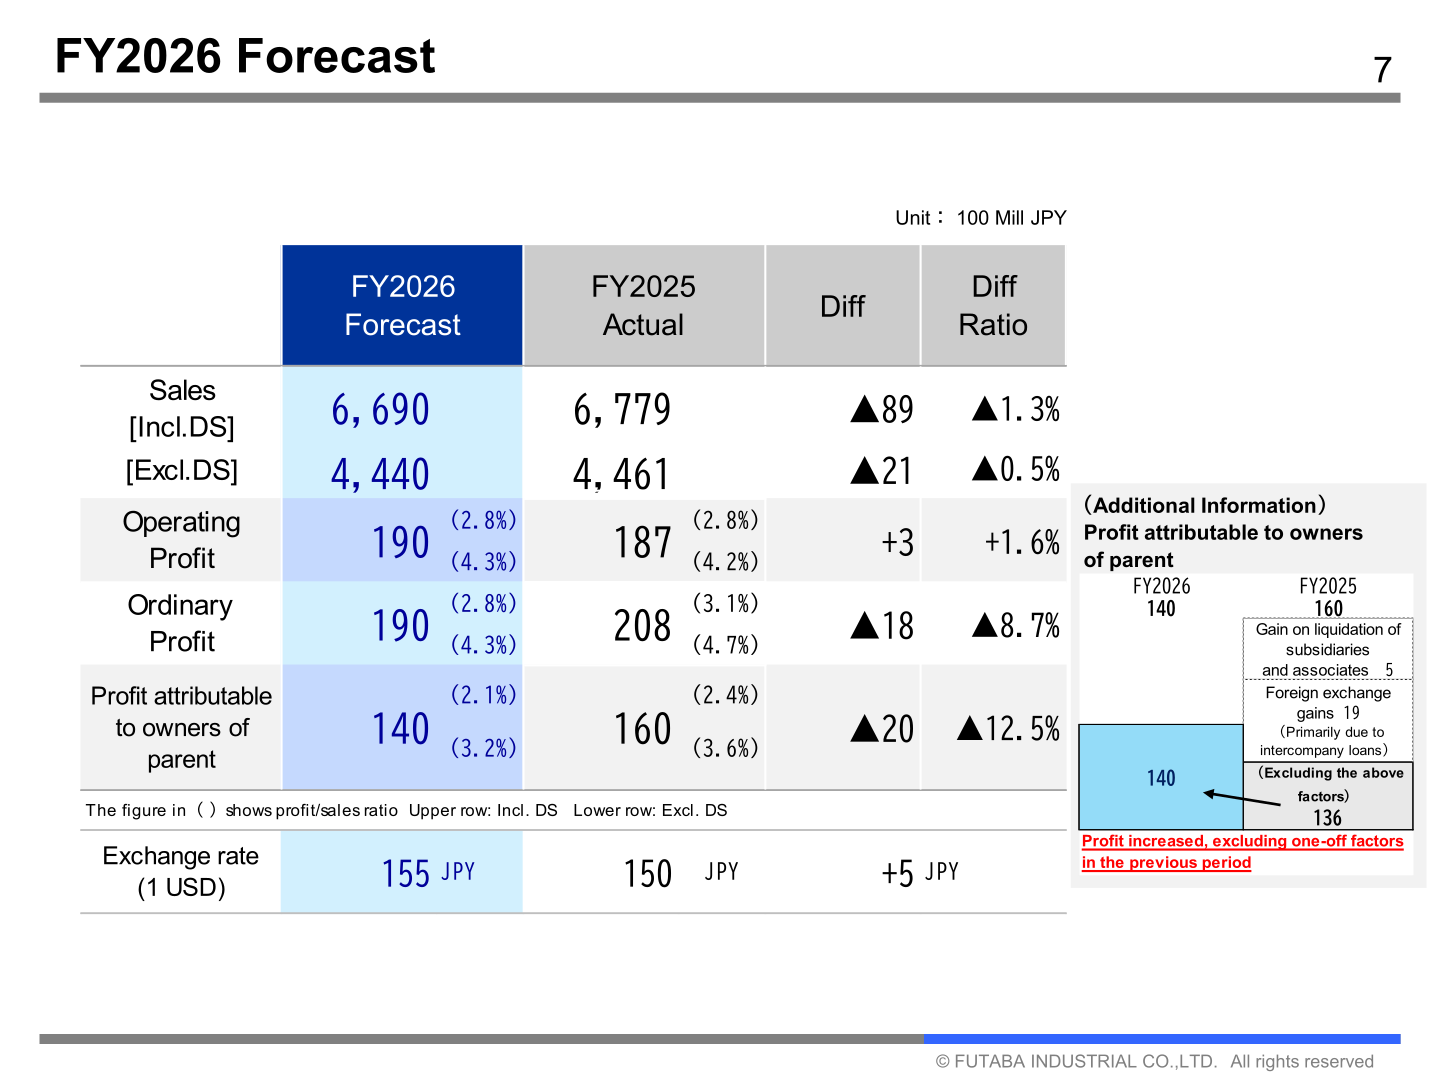
For FY2026 the company forecasts sales including DS parts of 6,690 (▲89, ▲1.3%) and sales excluding DS parts of 4,440 (▲21, ▲0.5%). Operating profit is forecast to rise +3 (+1.6%) to 190, while ordinary profit is forecast at 190 (▲18, ▲8.7%) and profit attributable to owners of parent at 140 (▲20, ▲12.5%). The assumed exchange rate is 155 JPY per USD against 150 JPY shown for FY2025 on the same slide, a difference of +5 JPY. In the additional information box the deck explains that FY2025’s 160 included a gain on liquidation of subsidiaries and associates of 5 and foreign exchange gains of 19 (primarily due to intercompany loans), leaving 136 excluding those factors, so that profit increases excluding one-off factors in the previous period.
| Item (Unit: 100 Mill JPY) | FY2026 Forecast | FY2025 Actual | Diff | Diff Ratio |
|---|---|---|---|---|
| Sales [Incl.DS] | 6,690 | 6,779 | ▲89 | ▲1.3% |
| Sales [Excl.DS] | 4,440 | 4,461 | ▲21 | ▲0.5% |
| Operating Profit | 190 | 187 | +3 | +1.6% |
| Ordinary Profit | 190 | 208 | ▲18 | ▲8.7% |
| Profit attributable to owners of parent | 140 | 160 | ▲20 | ▲12.5% |
| Exchange rate (1 USD) | 155 JPY | 150 JPY | +5 JPY |
By region the FY2026 forecast is for operating profit of 85 in Japan (+2), 57 in North America (+20), 14 in Europe (▲7), 24 in China (▲6) and 10 in Asia (▲2). The FY25 versus FY26 operating profit flux shows kaizen and price pass-through of +104 and non-parts sales volume of +12 as favorable, against material, labor and expense ▲44, depreciation ▲29, parts sales volume ▲20 and sales price revision ▲20, for a total gap of +3.
Shareholder Returns
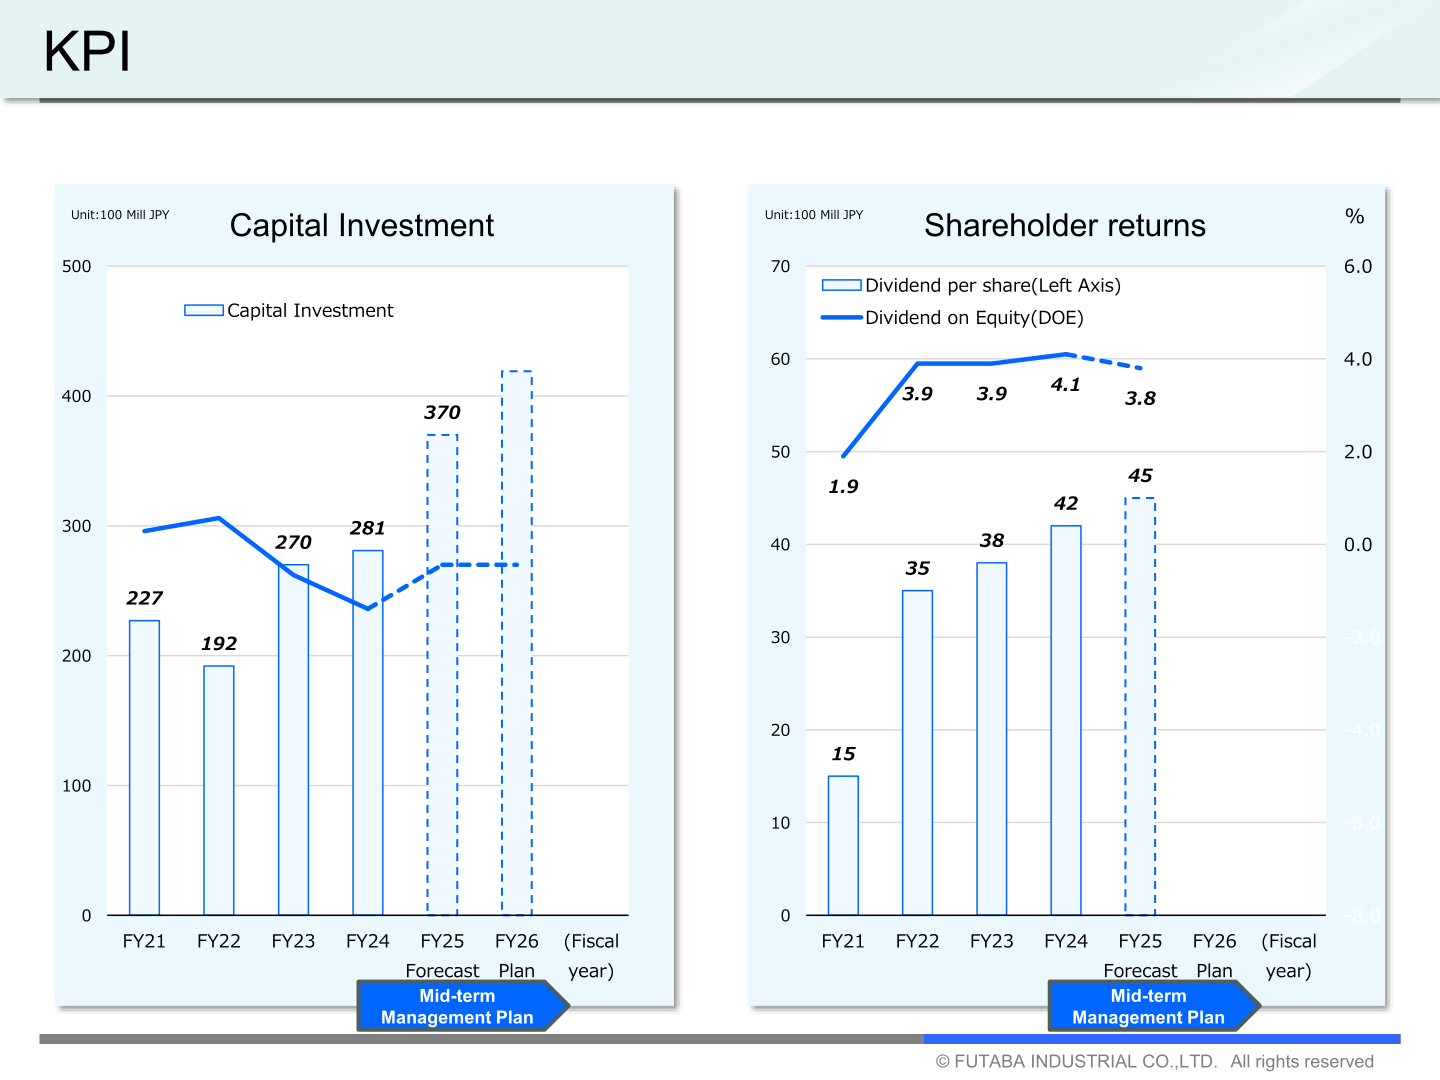
Shareholder returns appear only in the KPI charts in the appendix. Note that these KPI charts use fiscal-year labels one year earlier than the results tables: the column labelled “FY24” carries the same figures reported as FY2025 in the results tables (operating profit 187, profit attributable to owners of parent 160, equity 1,389 and equity ratio 41.5%), and the dashed column labelled “FY25 Forecast” carries the FY2026 forecast figures (sales 6,690 and operating profit 190).
On the shareholder returns chart, dividend per share is shown as 15 (FY21), 35 (FY22), 38 (FY23) and 42 (FY24), with 45 shown as a dashed bar at FY25 (Forecast). Dividend on Equity (DOE) is shown as 1.9, 3.9, 3.9, 4.1 and 3.8 for the same points.
Mid-Term Management Plan and KPI
The KPI pages carry a “Mid-term Management Plan” band covering the last two columns of each chart. Under the FY26 Plan column the deck shows sales excluding DS parts of 4,200 and an operating profit ratio (excluding DS parts) of 5.0%. Equity is shown rising from 940 to 1,389 with the equity ratio improving from 29.4% to 41.5%, and ROE is shown at 11.9%, 11.7%, 5.1% and 12.5%, with profit attributable to owners of parent of 105, 128, 62 and 160 and a dashed 140. Capital investment is shown as 227, 192, 270 and 281, with 370 as a dashed bar at FY25 (Forecast).
This article is an analysis based on publicly available information and is not a recommendation to buy or sell any specific securities. Investment decisions are your own responsibility.
![[Obayashi] Investors’ Guide 2026 — The Complete 24-Article Breakdown](https://japan-equity.com/wp-content/uploads/2026/07/hub_cover-1024x1024.png)
![[Obayashi] IR & SR Policy — Feeding Dialogue Back into Management](https://japan-equity.com/wp-content/uploads/2026/07/p32_sq-1024x1024.jpg)
![[Obayashi] Real Estate Development — 18.7% Margin, ¥287.7bn Unrealized Gains](https://japan-equity.com/wp-content/uploads/2026/07/p20_sq-1024x1024.jpg)
![[Obayashi] Domestic Civil Engineering — Resilience Spending Supports 9.6% Margin](https://japan-equity.com/wp-content/uploads/2026/07/p11_sq-1024x1024.jpg)
![[Obayashi] Share Price & External Ratings — vs TOPIX, ESG Index Inclusion](https://japan-equity.com/wp-content/uploads/2026/07/p40_sq-1024x1024.jpg)
![[Construction] ¥75.5tn Investment, Shrinking Workforce — Big-5 Market Share](https://japan-equity.com/wp-content/uploads/2026/07/p12_sq-1024x1024.jpg)



![[Obayashi] Capital Policy & Shareholder Returns — ROE 10%+, DOE ~5%, ¥100bn Buyback](https://japan-equity.com/wp-content/uploads/2026/07/p27_sq-1024x1024.jpg)
![[Obayashi] Reducing Cross-Shareholdings — ¥285.2bn Sold in Five Years](https://japan-equity.com/wp-content/uploads/2026/07/p29_sq-1024x1024.jpg)
![[Obayashi] ¥750bn Investment Plan — ¥300bn to Development, ¥190bn to Tech/DX](https://japan-equity.com/wp-content/uploads/2026/07/p30_sq-1024x1024.jpg)
![[Obayashi] MTP2022 KPIs — Operating Profit ~2x Target, ROE 14.4%](https://japan-equity.com/wp-content/uploads/2026/07/p25_sq-1024x1024.jpg)
![[Obayashi] Cash Allocation — ¥420bn Investment CF Over Five Years](https://japan-equity.com/wp-content/uploads/2026/07/p26_sq-1024x1024.jpg)
![[Obayashi] Green Energy — 44 Plants, 344MW, and the Green Hydrogen Challenge](https://japan-equity.com/wp-content/uploads/2026/07/p21_sq-1024x1024.jpg)
![[Obayashi] Tackling the Labor Shortage — Robotics Construction®](https://japan-equity.com/wp-content/uploads/2026/07/p14_sq-1024x1024.jpg)
