
This article is based on publicly available IR materials and is not a recommendation to buy or sell any specific securities.
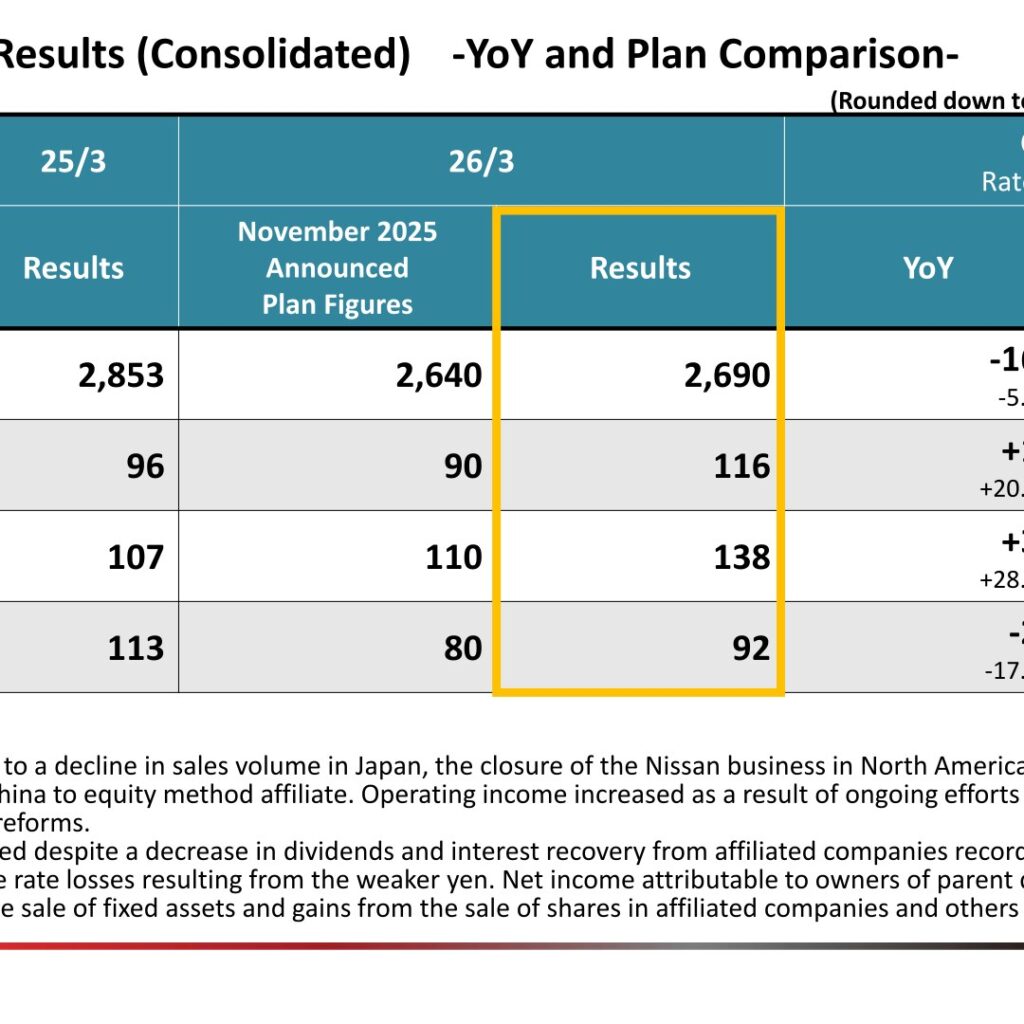
TACHI-S reported FY2025 (April 1, 2025 through March 31, 2026) consolidated net sales of 2,690 (100 million yen), down 163 or 5.7% year on year, while operating income rose 19 or 20.6% to 116 and ordinary income rose 30 or 28.2% to 138. Net income attributable to owners of parent decreased 20 or 17.8% to 92. All four lines came in above the plan figures announced in November 2025, with operating income 26 (+28.9%) above plan. The company attributes the sales decline to lower sales volume in Japan, the closure of the Nissan business in North America and the conversion of business companies in China to equity method affiliates, and the profit growth to ongoing efforts to improve profitability and the effects of structural reforms.
Consolidated Results (Full-Year Actual)
Figures below are in 100 million yen and are rounded down to the nearest 100 million yen, as presented in the materials. The 25/3 column is the previous fiscal year’s results and the 26/3 columns are the November 2025 announced plan figures and the FY2025 results.
| Item | 25/3 Results | 26/3 November 2025 Announced Plan Figures | 26/3 Results | YoY | Plan Comparison |
|---|---|---|---|---|---|
| Net sales | 2,853 | 2,640 | 2,690 | -163 (-5.7%) | +50 (+1.9%) |
| Operating income | 96 | 90 | 116 | +19 (+20.6%) | +26 (+28.9%) |
| Ordinary income | 107 | 110 | 138 | +30 (+28.2%) | +28 (+25.5%) |
| Net income attributable to owners of parent | 113 | 80 | 92 | -20 (-17.8%) | +12 (+16.2%) |
On ordinary income, the materials note that profit increased despite a decrease in dividends and interest recovery from affiliated companies recorded in the previous period, due to reduced exchange rate losses resulting from the weaker yen. Net income attributable to owners of parent decreased because of the absence of gains from the sale of fixed assets and gains from the sale of shares in affiliated companies and others recorded in the previous period. Average foreign exchange rates moved from USD 150.88, MXN 8.31 and RMB 20.98 in 25/03 to USD 150.23, MXN 7.76 and RMB 20.81 in 26/03.
Results by Region and Customer
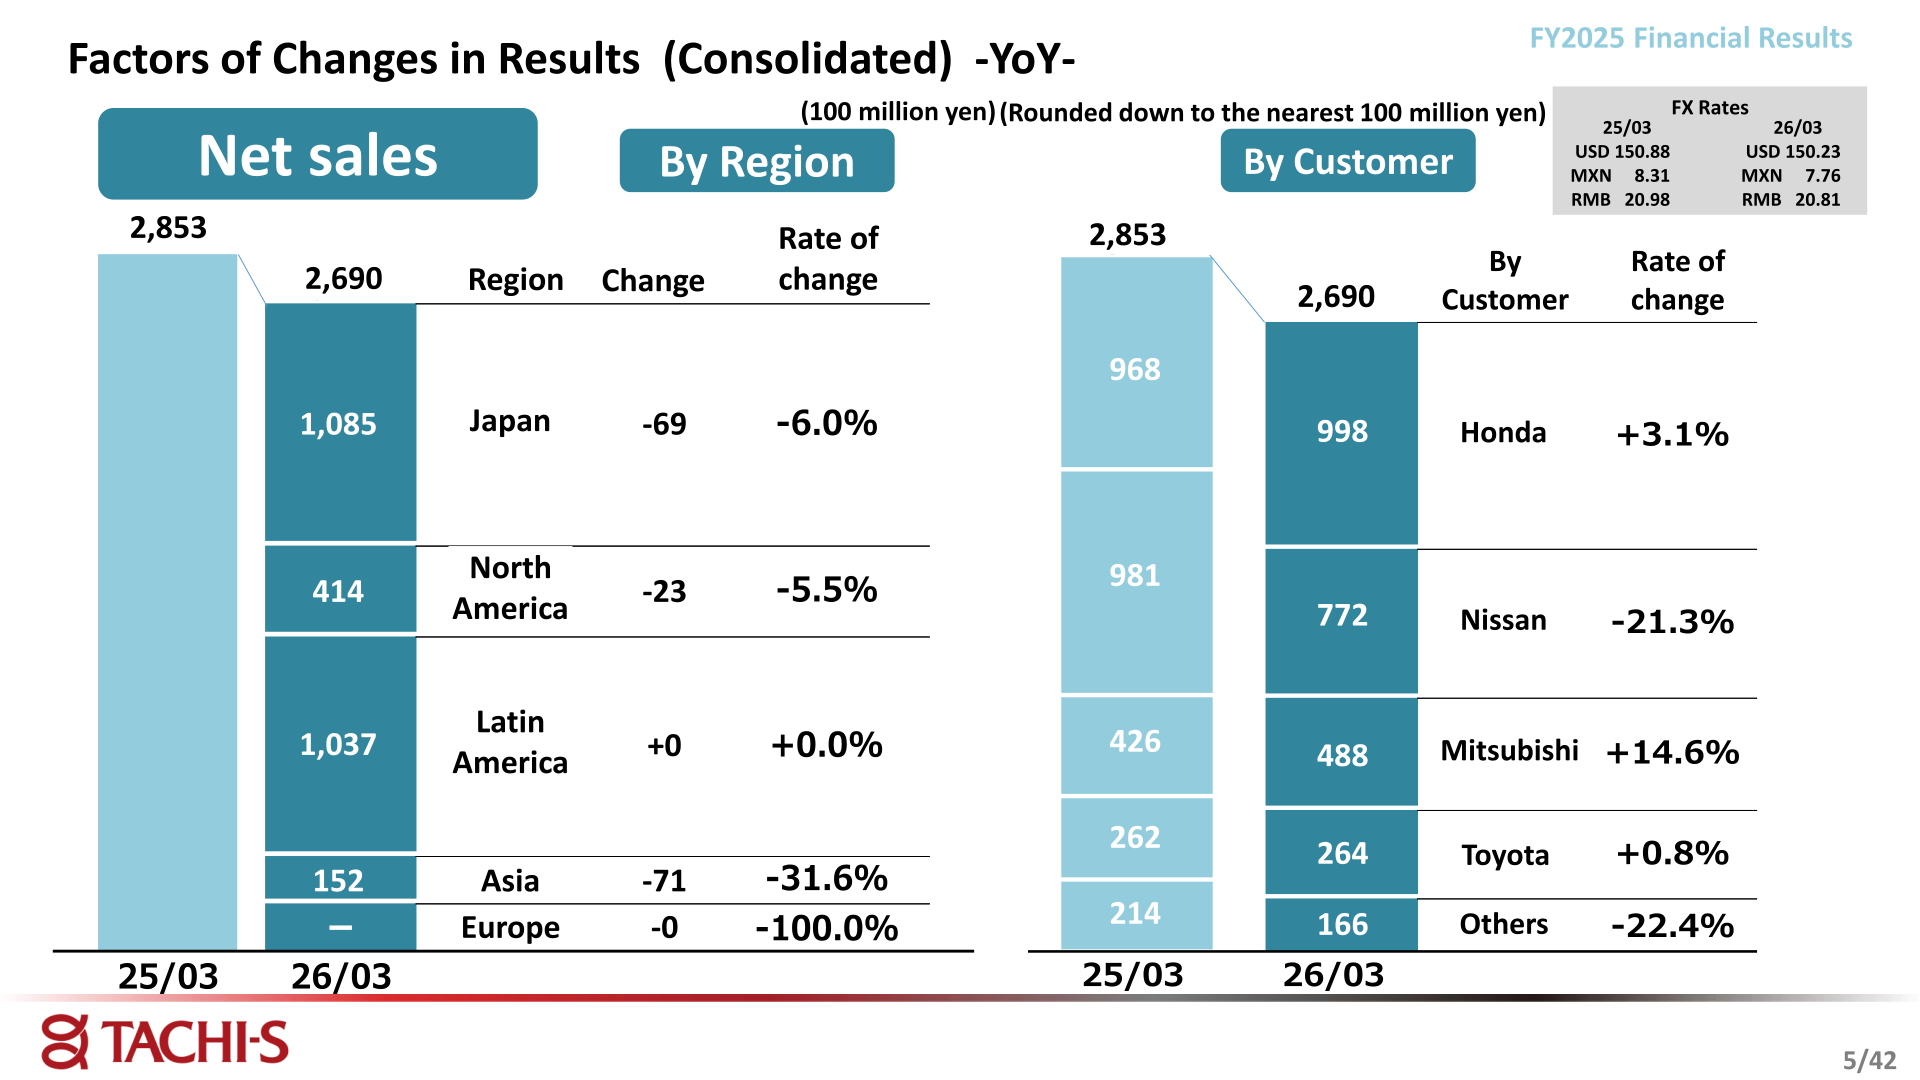
TACHI-S presents its breakdown by region and by customer rather than by reportable segment. Japan remained the largest region at 1,085, but Asia fell 31.6% following the business restructuring in China. On the profit side, Asia swung to 26 and North America to 5, while Japan and Latin America declined.
| Region | Net sales 26/3 | Net sales change | Rate of change | Operating income 26/3 | Operating income change |
|---|---|---|---|---|---|
| Japan | 1,085 | -69 | -6.0% | 61 | -6 |
| North America | 414 | -23 | -5.5% | 5 | +5 |
| Latin America | 1,037 | +0 | +0.0% | 23 | -7 |
| Asia | 152 | -71 | -31.6% | 26 | +26 |
| Europe | — | -0 | -100.0% | — | +0 |
| Total | 2,690 | -163 | -5.7% | 116 | +19 |
The operating income bridge shows a decrease in sales volume in Japan and China of -2,300 million yen and an increase in sales volume in ASEAN of +300 million yen, together with an impact of business restructuring in China of +1,600 million yen and a once-off profit increase in North America of +1,000 million yen. The materials also cite an impact of improved profitability in China and Japan of +2,300 million yen and deteriorating performance in North and Latin America of -1,300 million yen.
| Customer | Net sales 26/3 | Share 26/3 | Net sales 25/3 | Share 25/3 | Rate of change |
|---|---|---|---|---|---|
| Honda | 998 | 37% | 968 | 34% | +3.1% |
| Nissan | 772 | 29% | 981 | 34% | -21.3% |
| Mitsubishi | 488 | 18% | 426 | 15% | +14.6% |
| Toyota | 264 | 10% | 262 | 9% | +0.8% |
| Other | 166 | 6% | 214 | 8% | -22.4% |
| Total | 2,690 | — | 2,853 | — | -5.7% |
By region, net income attributable to owners of parent for 26/03 breaks down as Japan 50 (-18), North America 3 (-30), Latin America 15 (+12), Asia 18 (+22), equity method affiliates 4 (+0) and Europe 0 (-6).
FY2026 Forecast
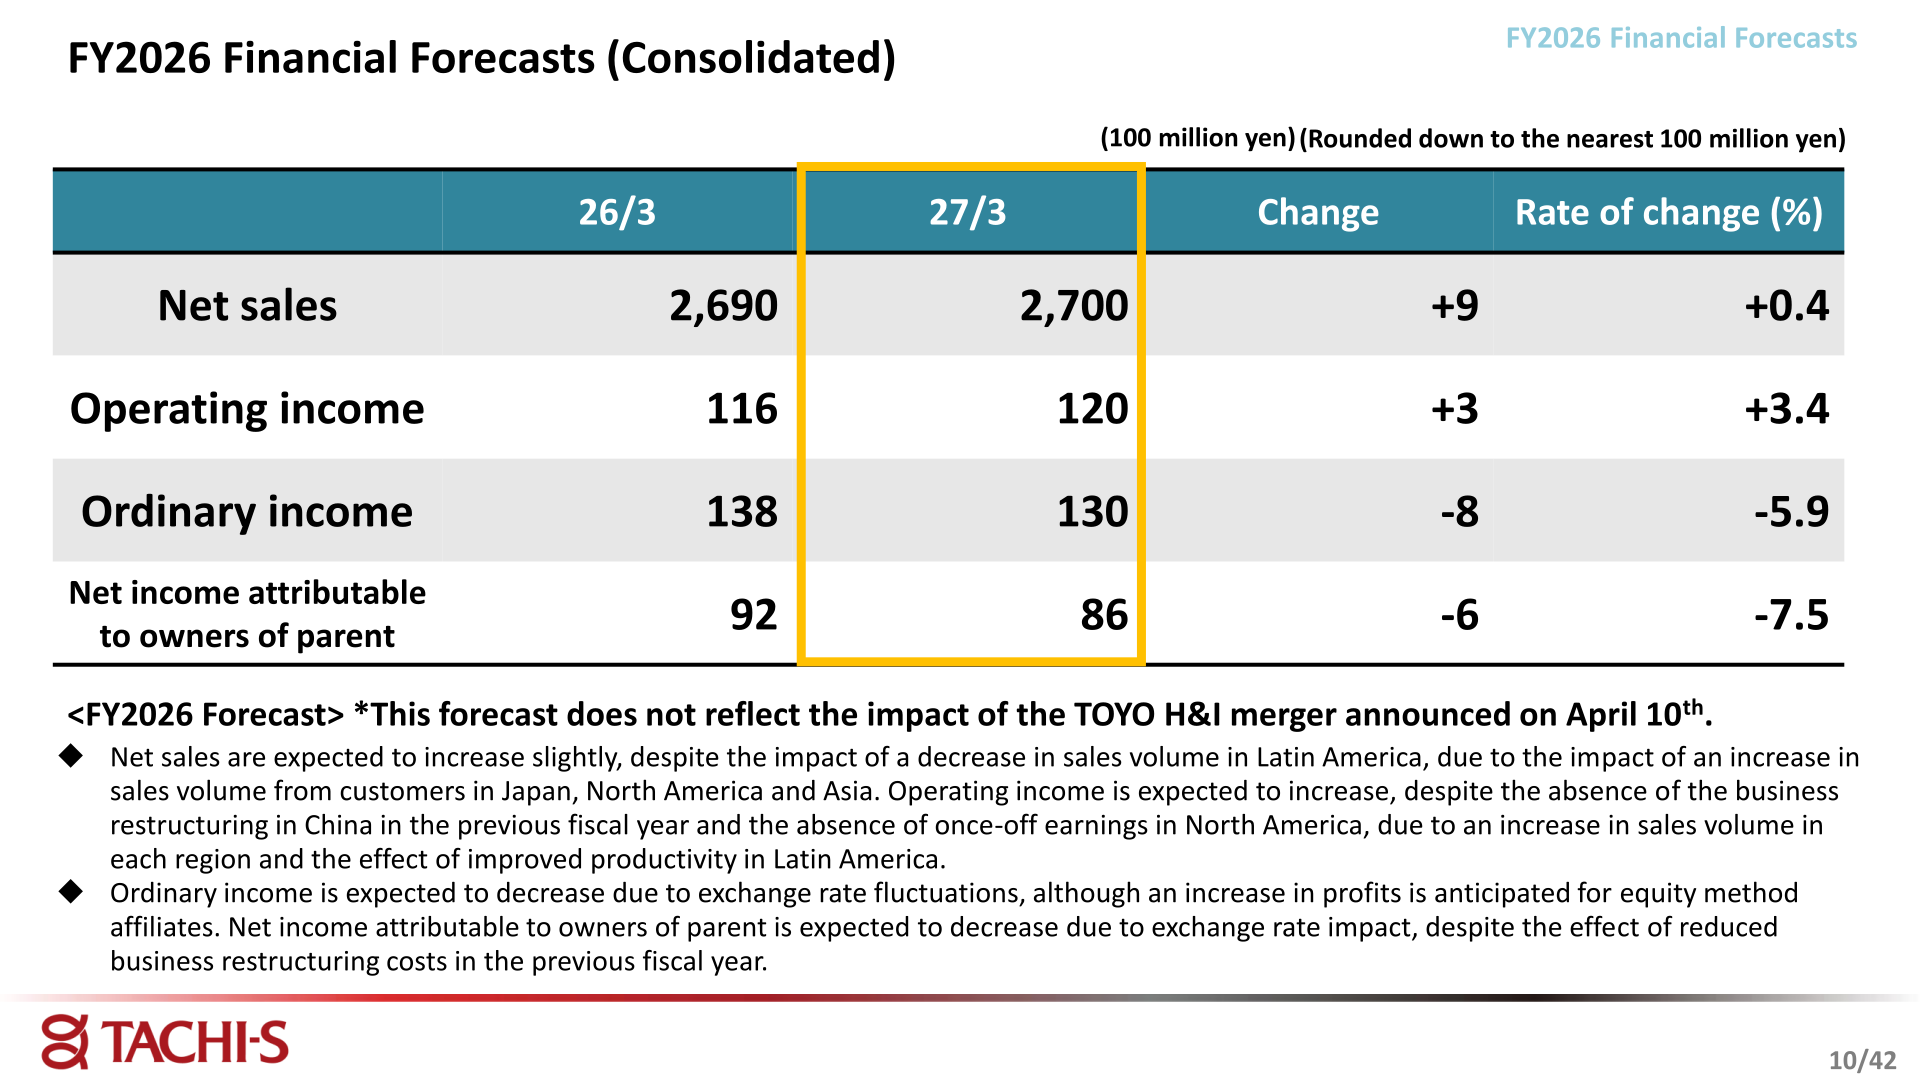
For FY2026 (the year ending March 31, 2027), TACHI-S forecasts a slight increase in net sales and higher operating income, but lower ordinary income and net income. The materials state that this forecast does not reflect the impact of the TOYO H&I merger announced on April 10.
| Item | 26/3 (Actual) | 27/3 (Forecast) | Change | Rate of change (%) |
|---|---|---|---|---|
| Net sales | 2,690 | 2,700 | +9 | +0.4 |
| Operating income | 116 | 120 | +3 | +3.4 |
| Ordinary income | 138 | 130 | -8 | -5.9 |
| Net income attributable to owners of parent | 92 | 86 | -6 | -7.5 |
By region, forecast net sales are Japan 1,062 (-23, -2.1%), North America 447 (+32, +7.9%), Latin America 977 (-60, -5.8%) and Asia 213 (+60, +39.7%). Forecast operating income is Japan 48 (-12), Latin America 35 (+12), Asia 36 (+9) and North America -0 (-5). Forecast net income attributable to owners of parent is Japan 46 (-4), Latin America 7 (-7), Asia 27 (+8), equity method affiliates 4 (+0) and North America -0 (-4). Assumed exchange rates for 27/03 are USD 152.00, MXN 8.20 and RMB 22.00.
Shareholder Returns
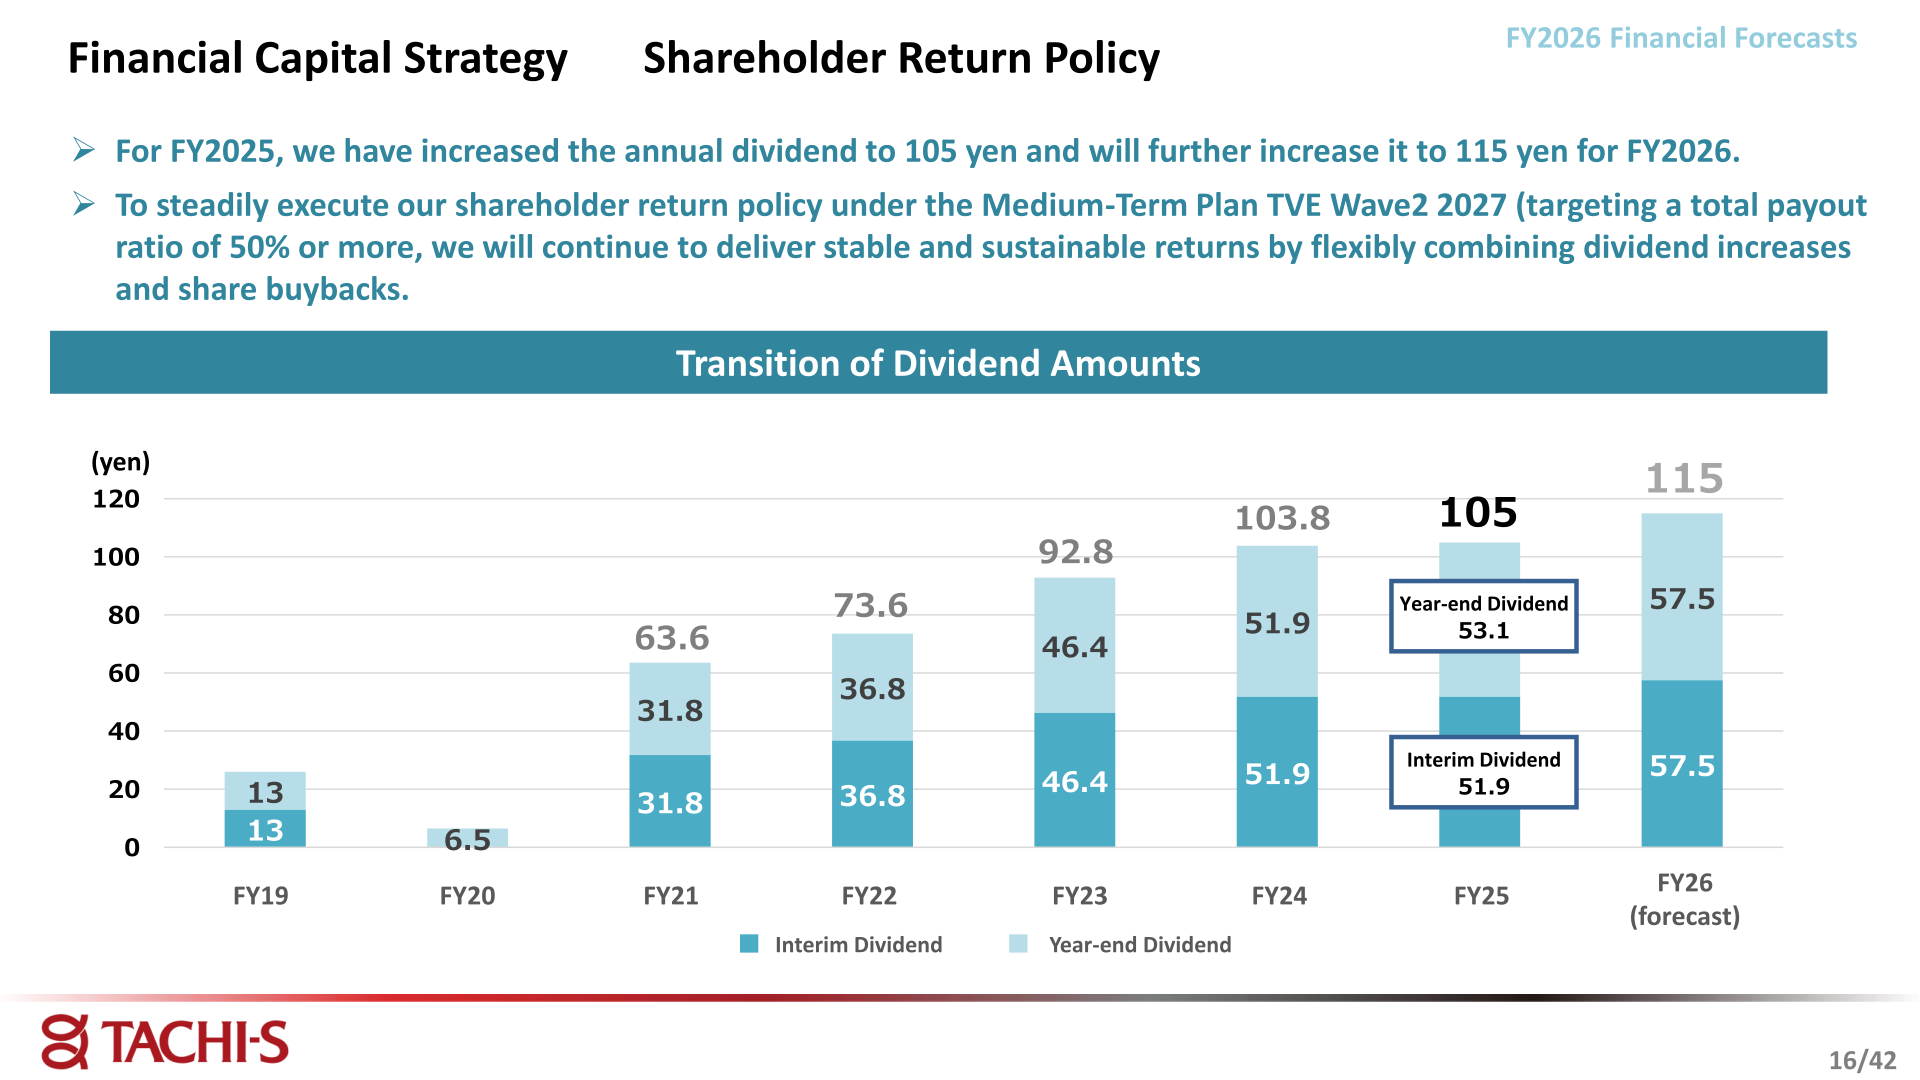
The company states that for FY2025 it has increased the annual dividend to 105 yen, comprising an interim dividend of 51.9 yen and a year-end dividend of 53.1 yen, and will further increase it to 115 yen for FY2026, comprising an interim dividend of 57.5 yen and a year-end dividend of 57.5 yen. To steadily execute its shareholder return policy under the Medium-Term Plan TVE Wave2 2027, targeting a total payout ratio of 50% or more, TACHI-S says it will continue to deliver stable and sustainable returns by flexibly combining dividend increases and share buybacks.
Medium-Term Management Plan TVE Wave2 2027
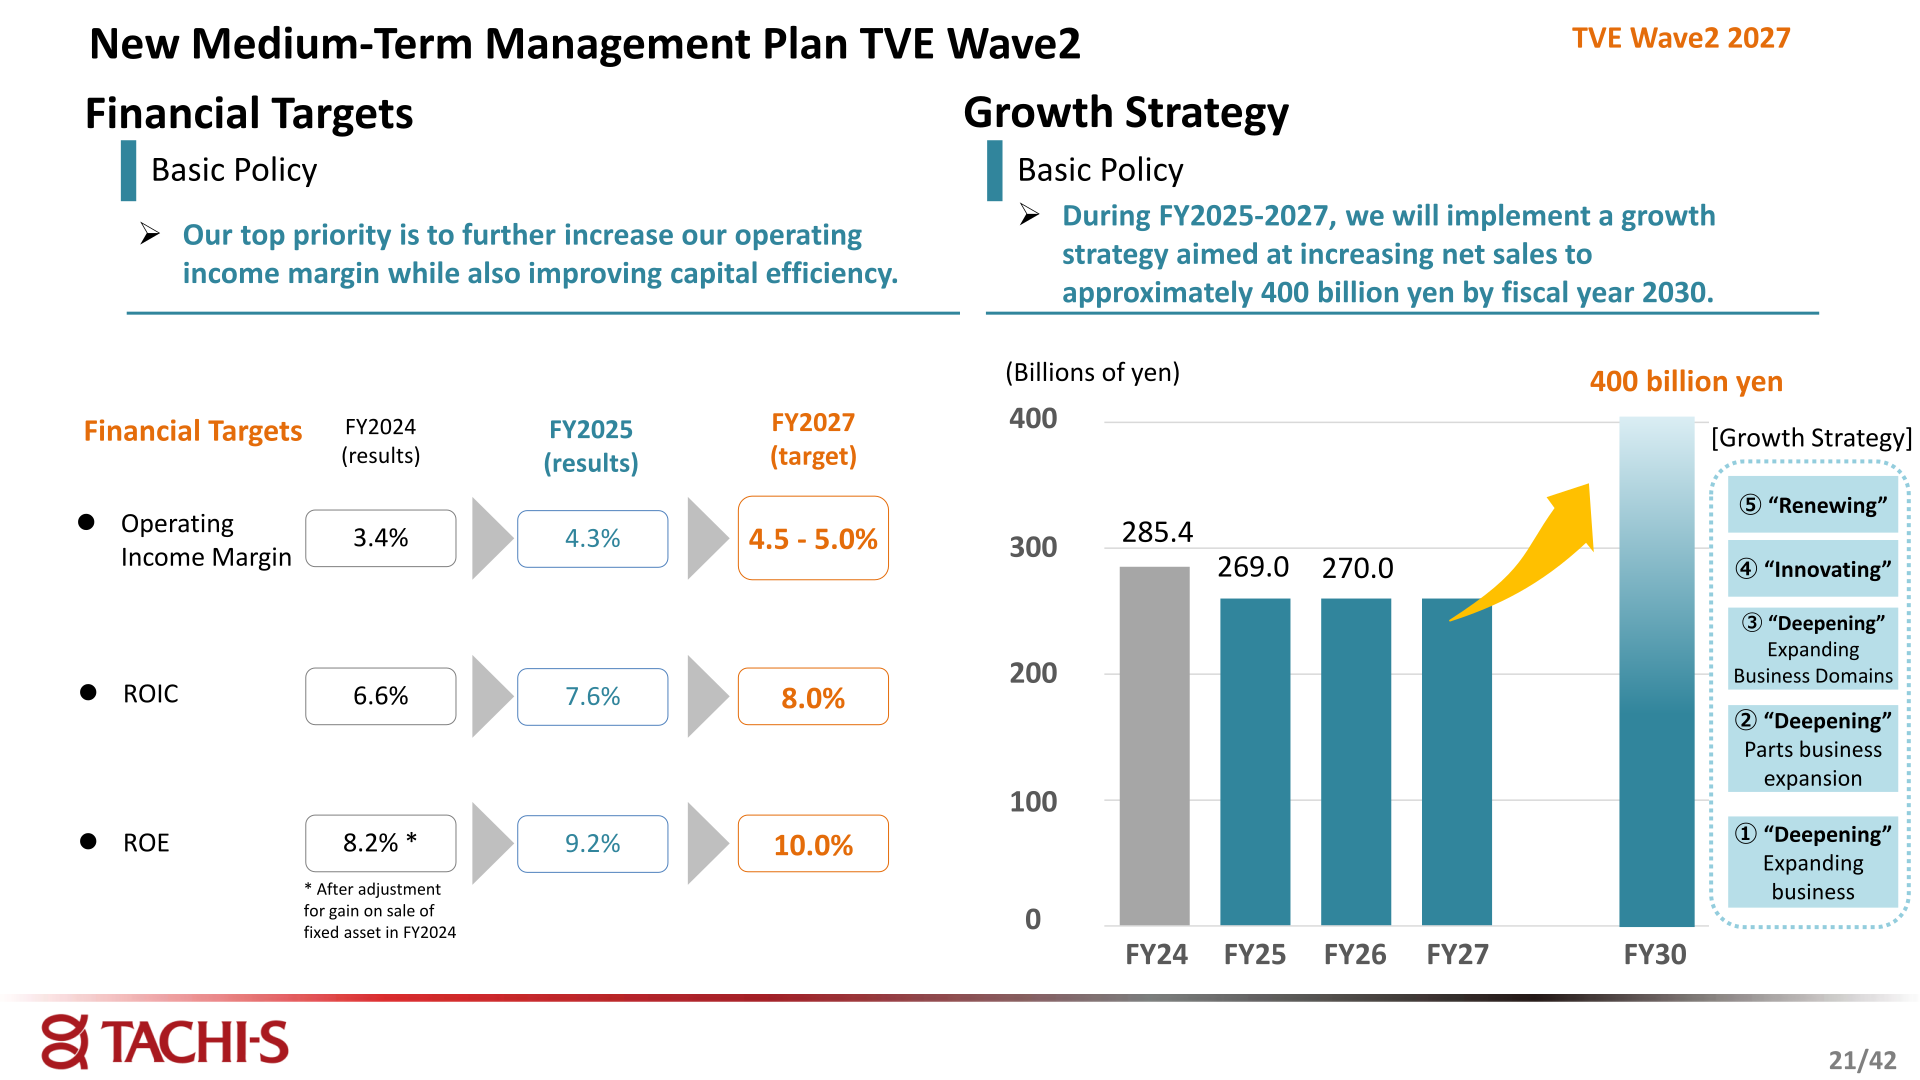
Under the medium-term management plan TVE (Transformative Value Evolution) Wave2 2027, the operating income margin improved from 3.4% in FY2024 (results) to 4.3% in FY2025 (results) against an FY2027 target of 4.5-5.0%. ROIC improved from 6.6% to 7.6% against a target of 8.0%, and ROE from 8.2% (after adjustment for gain on sale of fixed asset in FY2024) to 9.2% against a target of 10.0%. The growth strategy chart shows net sales of 285.4 in FY24, 269.0 in FY25 and 270.0 in FY26 (billions of yen), with a target of approximately 400 billion yen by fiscal year 2030.
On order acquisition, the materials state that in FY2025 the group received orders globally for 6 types of seats, 5 types of Seat Trim Covers and 2 types of mechanism parts, including seat business orders for three vehicle models and mechanism parts orders for one vehicle model in Japan, and seat business orders in India through joint venture partner sales activities. Under the TPW (TACHI-S Production Way) strategy, a labor-saving ratio of -5.6% versus FY24 was achieved in 2025 against a 2030 target of -34%, and the digital phase of the development process was shortened by 40% in 2025 results. On the environment, CO2 emissions were reduced by 27% versus FY19 for Scope 1 and 2 combined (preliminary figures before third-party verification), against the FY2025 target of -27%.
Topics: Business Integration with TOYO H&I
Reproduced from the release dated April 10, 2026, the materials describe the business integration of TOYO H&I Co., Ltd., under which TACHI-S will combine the customer bases and business domains of TACHI-S and the TOYO H&I Group. The stated objectives are enhancing the customer portfolio, mutual utilization of products and maximizing asset utilization, optimizing development resources and creating technological innovation, and expanding business domains. TACHI-S says it will strengthen its customer portfolio as an independent seat manufacturer by adding Mazda and Suzuki, clients of the TOYO H&I Group. The materials show FY2025 net sales of 269.0 billion yen for TACHI-S on a current-state basis and 360.0 billion yen on an image-chart basis after the transaction, noting that the latter figures are derived by simply adding the consolidated net sales of the TOYO H&I Group to TACHI-S’s consolidated net sales for FY2025 and that the TOYO H&I Group figures are simplified figures that have not been audited. The materials also note that TOYO SEAT and Nanjo Auto Interior add door trim to the product lineup and that there is no overlap in geographic footprint between the companies.
This article is an analysis based on publicly available information and is not a recommendation to buy or sell any specific securities. Investment decisions are your own responsibility.
![[Obayashi] Investors’ Guide 2026 — The Complete 24-Article Breakdown](https://japan-equity.com/wp-content/uploads/2026/07/hub_cover-1024x1024.png)
![[Obayashi] IR & SR Policy — Feeding Dialogue Back into Management](https://japan-equity.com/wp-content/uploads/2026/07/p32_sq-1024x1024.jpg)
![[Obayashi] Real Estate Development — 18.7% Margin, ¥287.7bn Unrealized Gains](https://japan-equity.com/wp-content/uploads/2026/07/p20_sq-1024x1024.jpg)
![[Obayashi] Domestic Civil Engineering — Resilience Spending Supports 9.6% Margin](https://japan-equity.com/wp-content/uploads/2026/07/p11_sq-1024x1024.jpg)
![[Obayashi] Share Price & External Ratings — vs TOPIX, ESG Index Inclusion](https://japan-equity.com/wp-content/uploads/2026/07/p40_sq-1024x1024.jpg)
![[Construction] ¥75.5tn Investment, Shrinking Workforce — Big-5 Market Share](https://japan-equity.com/wp-content/uploads/2026/07/p12_sq-1024x1024.jpg)



![[Obayashi] Capital Policy & Shareholder Returns — ROE 10%+, DOE ~5%, ¥100bn Buyback](https://japan-equity.com/wp-content/uploads/2026/07/p27_sq-1024x1024.jpg)
![[Obayashi] Reducing Cross-Shareholdings — ¥285.2bn Sold in Five Years](https://japan-equity.com/wp-content/uploads/2026/07/p29_sq-1024x1024.jpg)
![[Obayashi] ¥750bn Investment Plan — ¥300bn to Development, ¥190bn to Tech/DX](https://japan-equity.com/wp-content/uploads/2026/07/p30_sq-1024x1024.jpg)
![[Obayashi] MTP2022 KPIs — Operating Profit ~2x Target, ROE 14.4%](https://japan-equity.com/wp-content/uploads/2026/07/p25_sq-1024x1024.jpg)
![[Obayashi] Cash Allocation — ¥420bn Investment CF Over Five Years](https://japan-equity.com/wp-content/uploads/2026/07/p26_sq-1024x1024.jpg)
![[Obayashi] Green Energy — 44 Plants, 344MW, and the Green Hydrogen Challenge](https://japan-equity.com/wp-content/uploads/2026/07/p21_sq-1024x1024.jpg)
![[Obayashi] Tackling the Labor Shortage — Robotics Construction®](https://japan-equity.com/wp-content/uploads/2026/07/p14_sq-1024x1024.jpg)
