
This article is based on publicly available IR materials and is not a recommendation to buy or sell any specific securities.
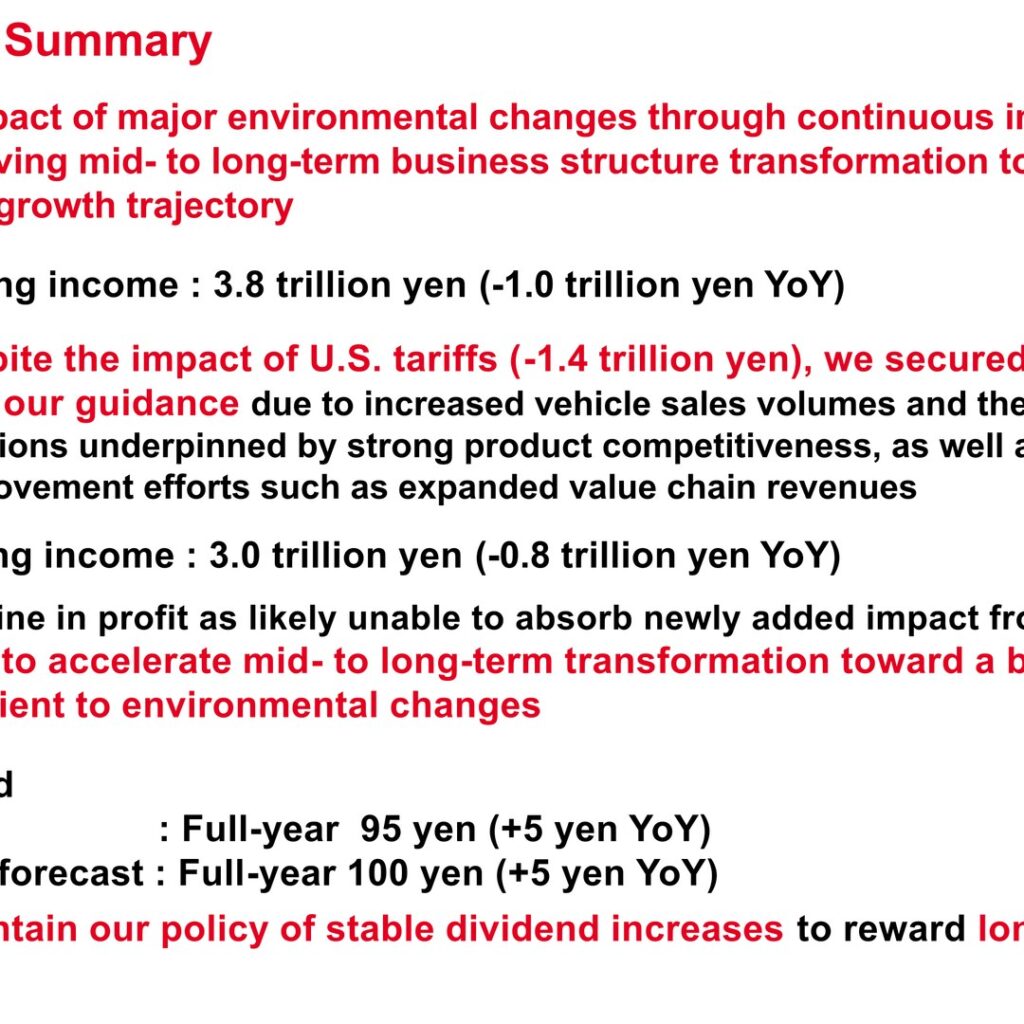
Toyota Motor Corporation reported FY2026 (April 2025 – March 2026) consolidated operating income of 3,766.2 billion yen, down 1,029.3 billion yen year on year, as an estimated -1,380.0 billion yen tariff impact and higher expenses weighed on results. Despite this, the company said it secured profits consistent with its guidance, supported by higher vehicle sales volumes, price revisions underpinned by strong product competitiveness, and steadily accumulated value chain revenue growth. For FY2027 (April 2026 – March 2027), Toyota forecasts a further decline in operating income to 3,000.0 billion yen, citing an inability to fully absorb a newly added Middle East impact. The full-year dividend was raised to 95 yen per share for FY2026 (+5 yen year on year), with a forecast of 100 yen for FY2027 (+5 yen year on year).
Consolidated Results (Full-Year Actual)
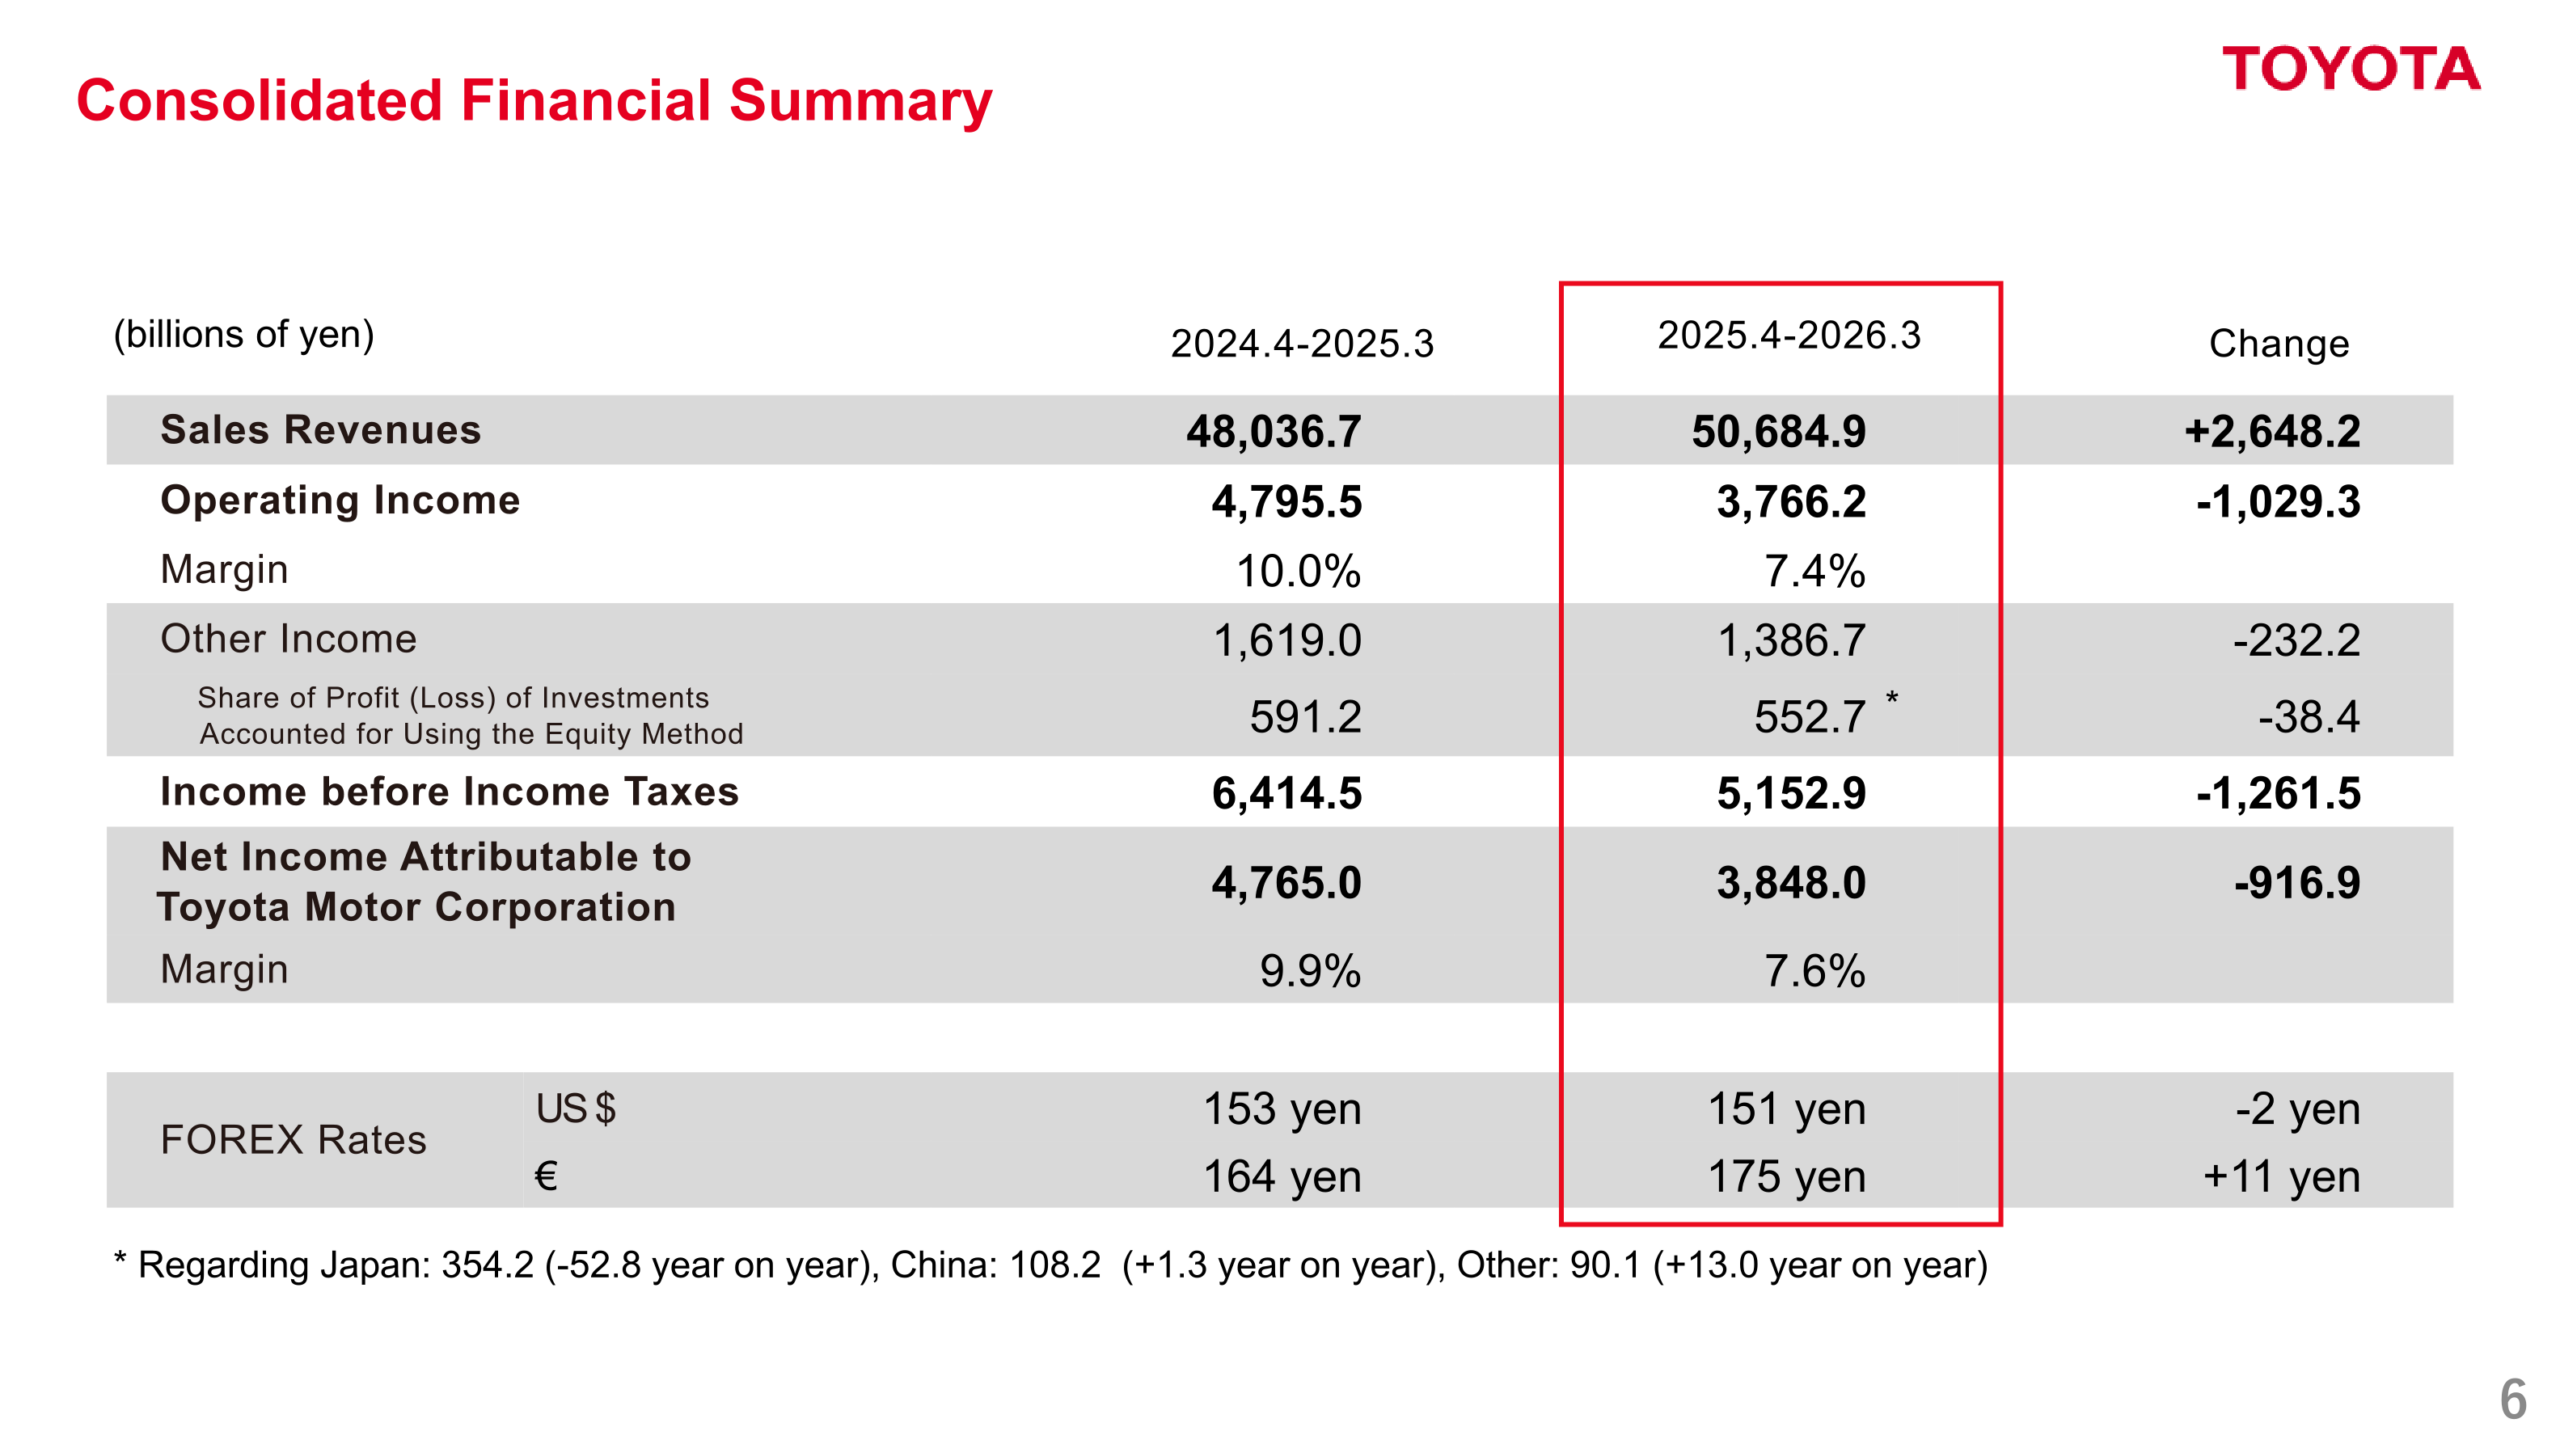
FY2026 sales revenues rose to 50,684.9 billion yen (+2,648.2 billion yen year on year), while operating income fell to 3,766.2 billion yen (-1,029.3 billion yen), with operating margin declining to 7.4% from 10.0%. Net income attributable to Toyota Motor Corporation was 3,848.0 billion yen (-916.9 billion yen year on year), with net margin at 7.6% versus 9.9% in FY2025. The average FOREX rate was 151 yen/US$ (-2 yen year on year) and 175 yen/euro (+11 yen year on year).
| Item | FY2026 (2025.4-2026.3) | FY2025 (2024.4-2025.3) | Change |
|---|---|---|---|
| Sales Revenues (billions of yen) | 50,684.9 | 48,036.7 | +2,648.2 |
| Operating Income (billions of yen) | 3,766.2 | 4,795.5 | -1,029.3 |
| Operating Margin | 7.4% | 10.0% | -2.6pt |
| Income before Income Taxes (billions of yen) | 5,152.9 | 6,414.5 | -1,261.5 |
| Net Income Attributable to Toyota Motor Corporation (billions of yen) | 3,848.0 | 4,765.0 | -916.9 |
| Net Margin | 7.6% | 9.9% | -2.3pt |
Segment Results
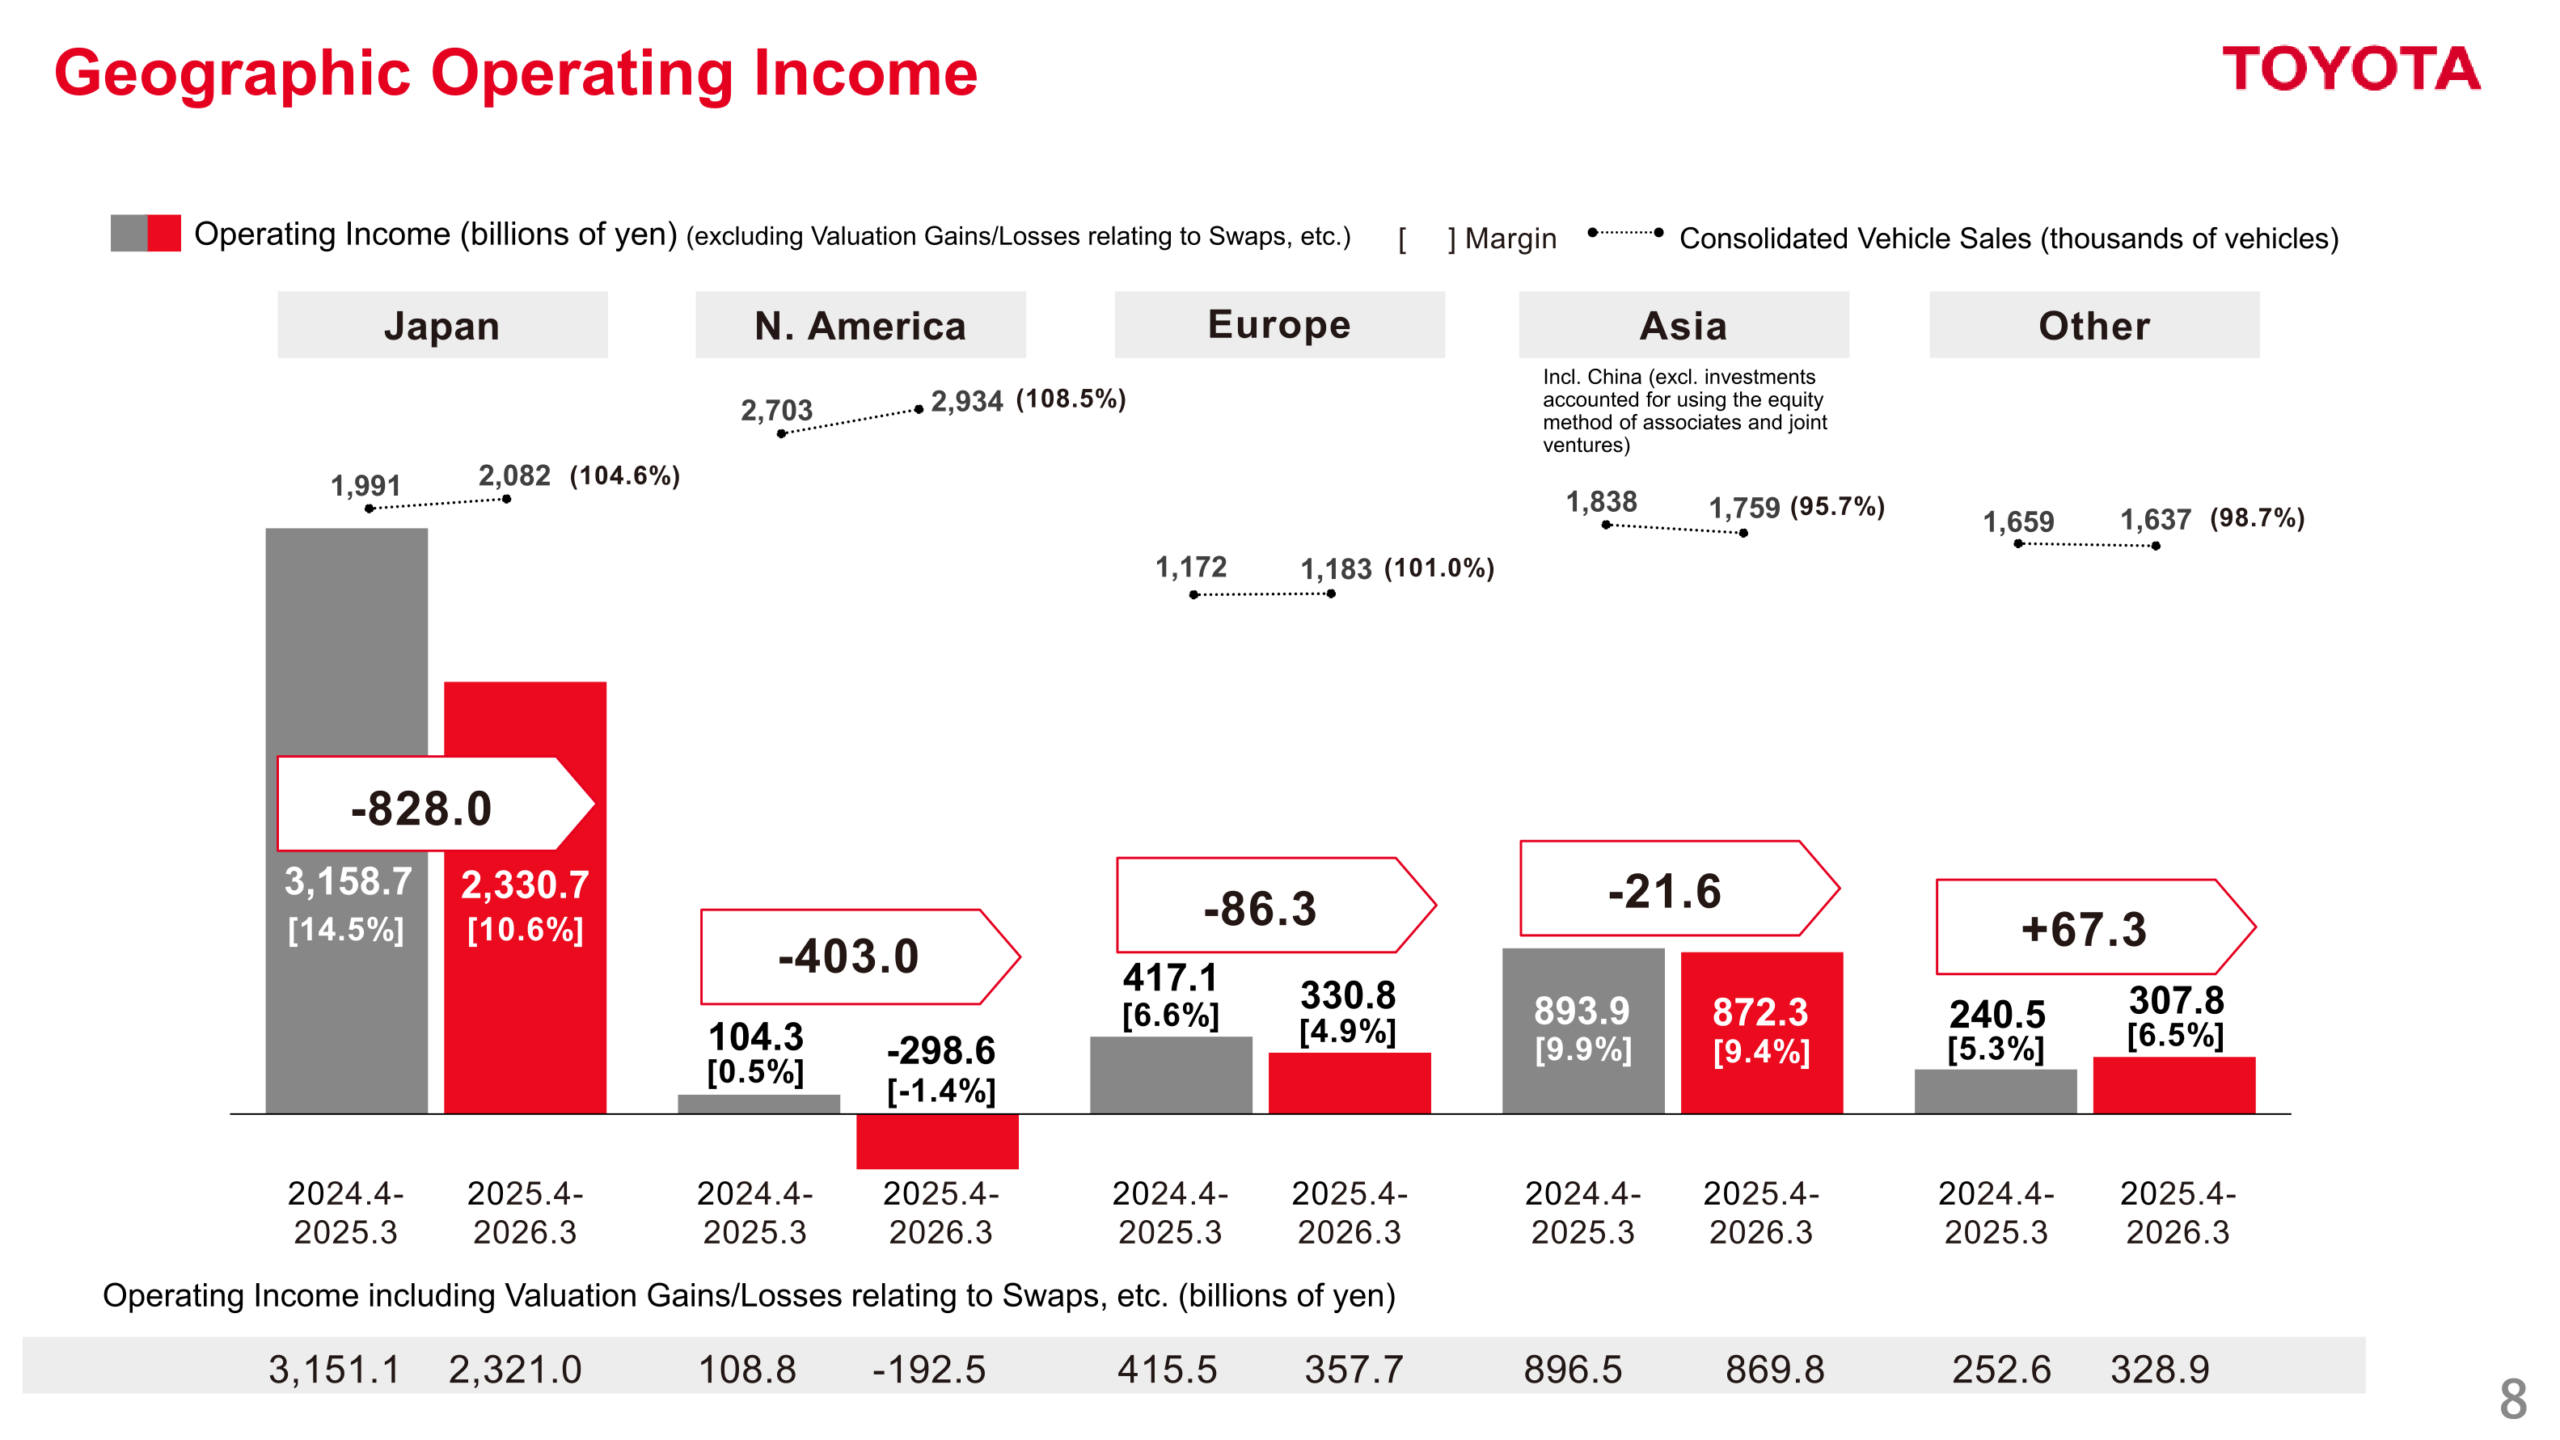
By region, operating income (excluding valuation gains/losses relating to swaps) declined in Japan to 2,321.0 billion yen (from 3,151.1 billion yen) and turned negative in North America at -192.5 billion yen (from 108.8 billion yen), reflecting the tariff impact. Europe and Asia also declined, while Other regions increased. Consolidated vehicle sales for FY2026 totaled 9,595 thousand units, led by growth in Asia (+8.5% year on year) and Other regions (+4.6%), while Japan (-1.3%) and North America (-4.3%) declined. In China, operating income of consolidated subsidiaries rose to 108.2 billion yen (from 106.9 billion yen) and the share of profit of equity-method investments rose to 197.5 billion yen (from 182.7 billion yen), even as Toyota and Lexus vehicle sales in China declined to 1,764 thousand units (98.6% year on year). Financial Services operating income (excluding valuation gains/losses relating to swaps) rose to 709.8 billion yen (+36.1 billion yen year on year).
| Region | Operating Income FY2026 (bn yen, excl. swap valuation) | Operating Income FY2025 (bn yen, excl. swap valuation) | Consolidated Vehicle Sales FY2026 YoY |
|---|---|---|---|
| Japan | 2,321.0 | 3,151.1 | 98.7% |
| North America | -192.5 | 108.8 | 95.7% |
| Europe | 357.7 | 415.5 | 101.0% |
| Asia | 869.8 | 896.5 | 108.5% |
| Other | 328.9 | 252.6 | 104.6% |
FY2027 Forecast
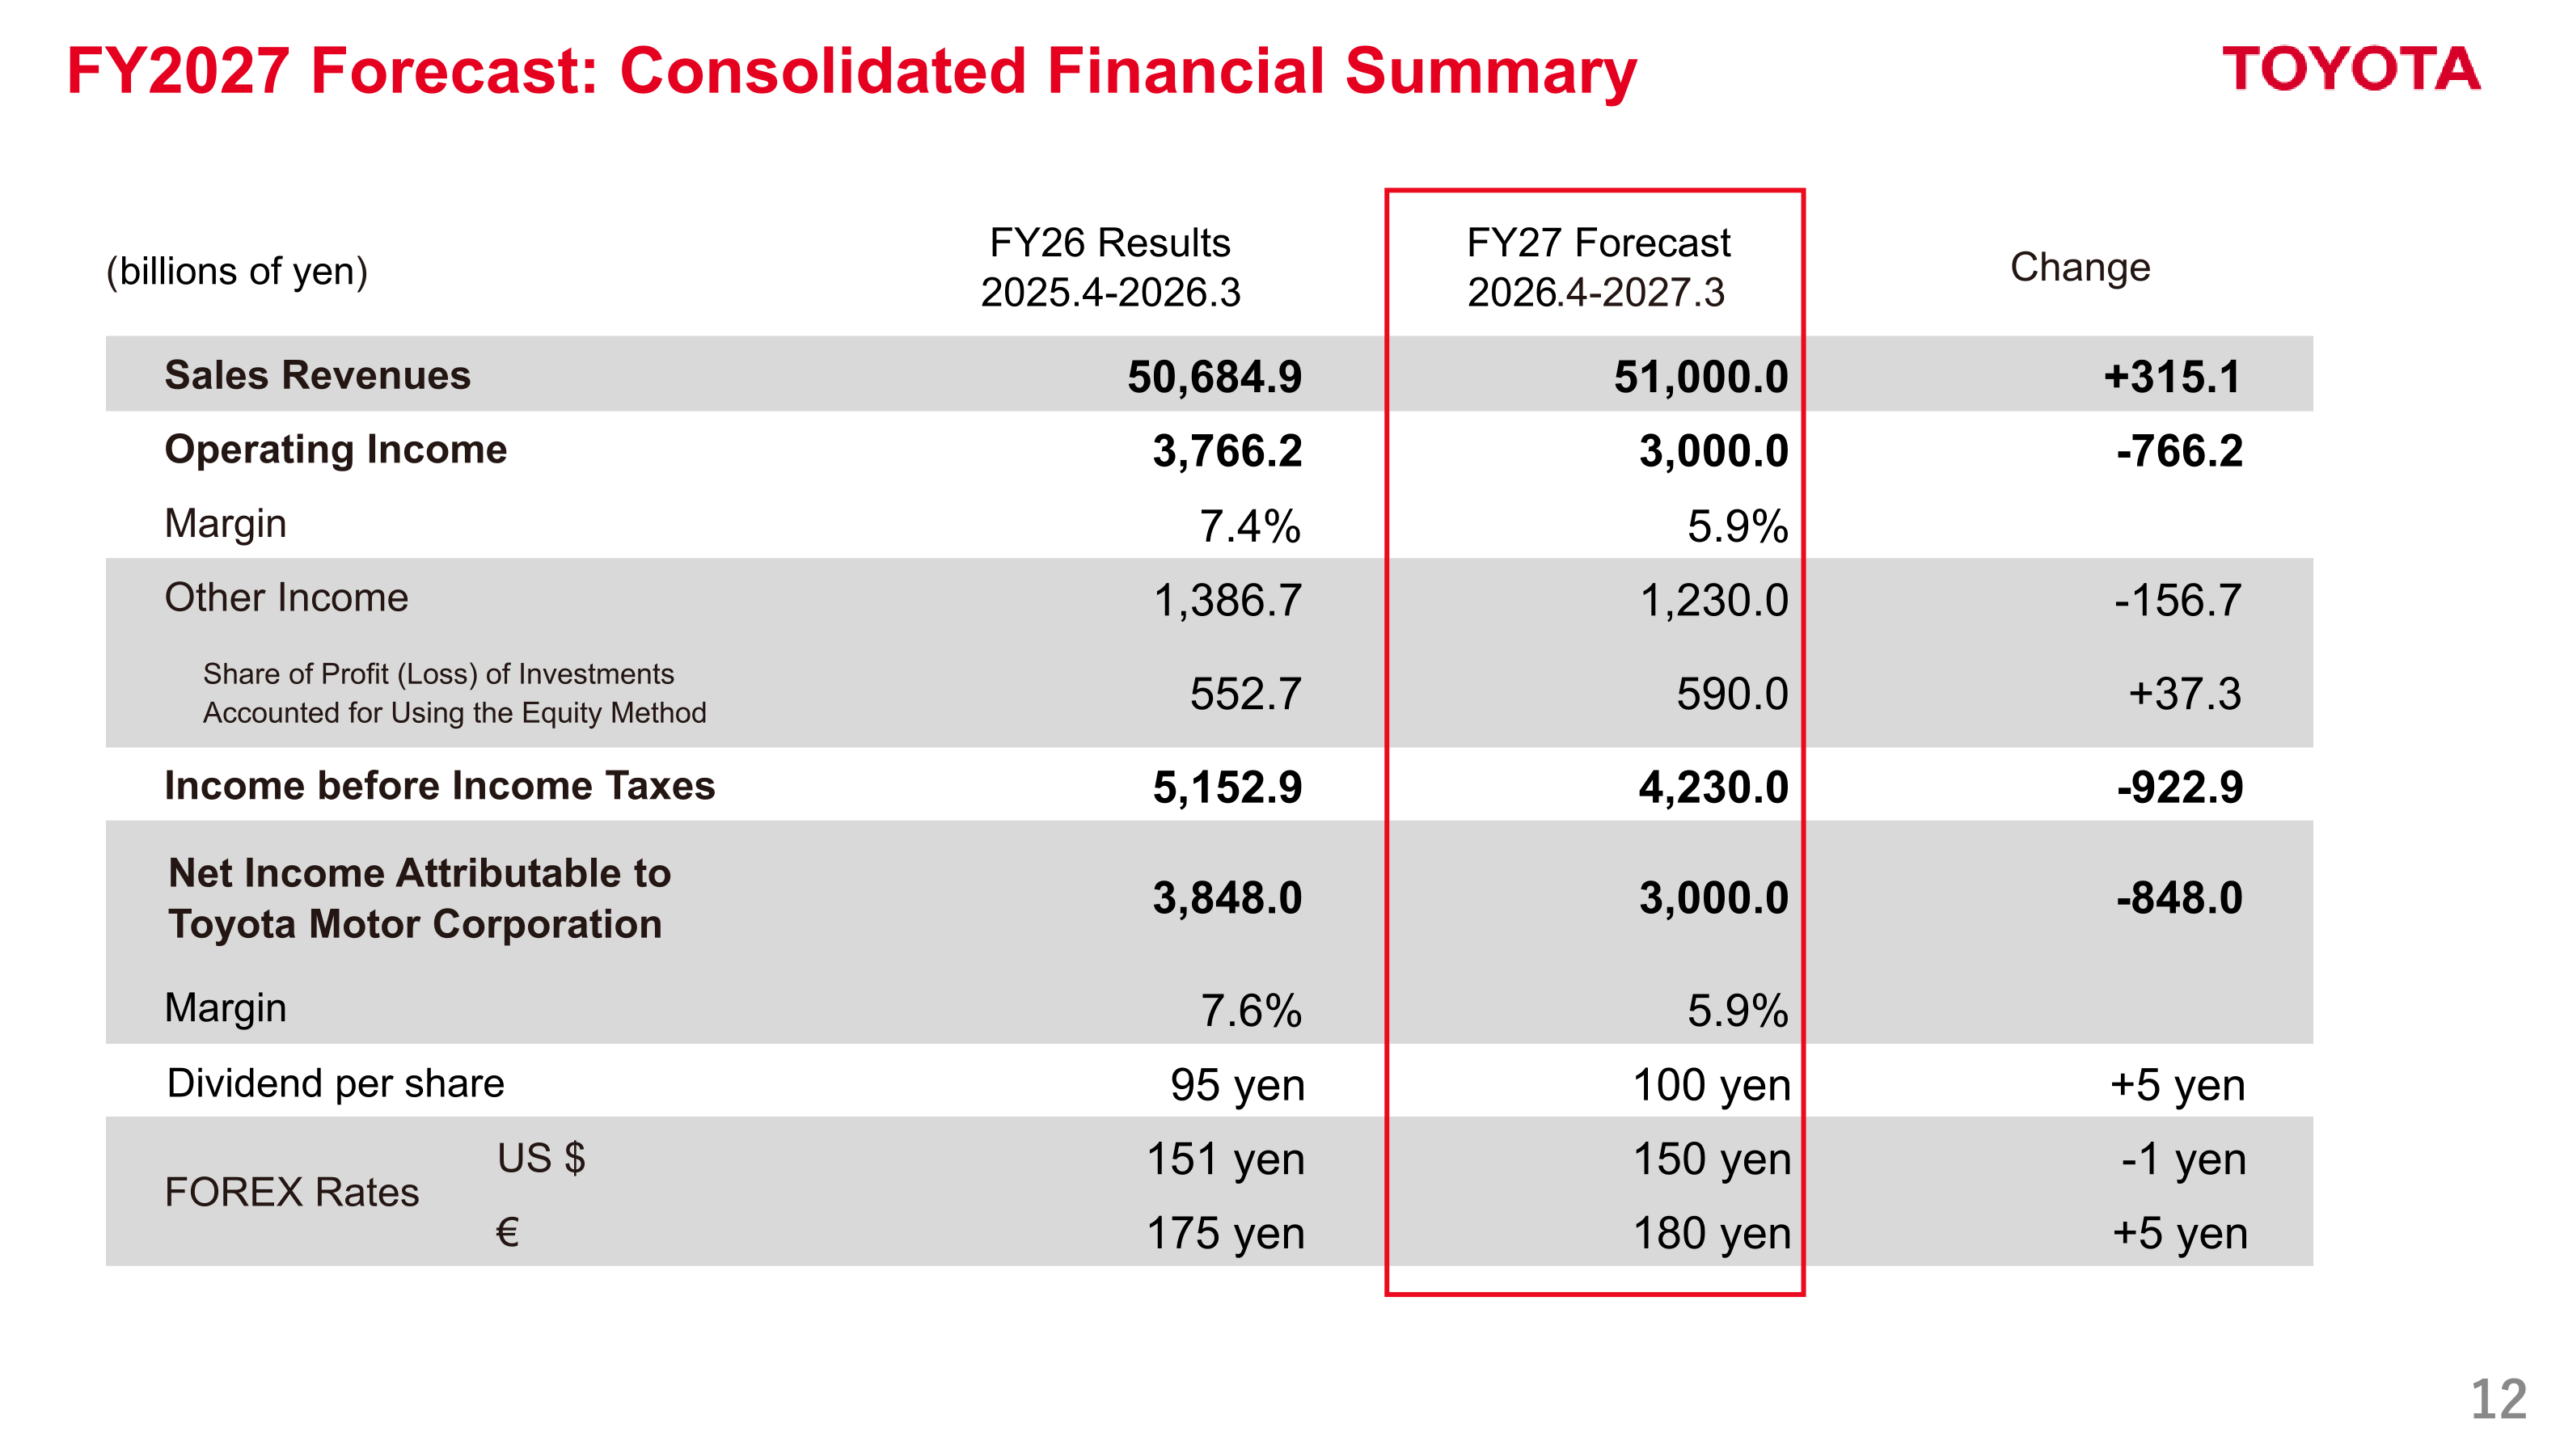
Toyota forecasts FY2027 sales revenues of 51,000.0 billion yen (+315.1 billion yen year on year) but operating income of 3,000.0 billion yen (-766.2 billion yen year on year), with operating margin declining further to 5.9%. The forecast reflects a newly added Middle East impact of -270.0 billion yen (within a total Middle East-related impact of -400.0 billion yen on strengthening the foundation of suppliers/materials prices) and a -40.0 billion yen impact from the deconsolidation of Hino Motors, partly offset by cost reduction efforts of +205.0 billion yen. Net income attributable to Toyota Motor Corporation is forecast at 3,000.0 billion yen (-848.0 billion yen year on year), with net margin of 5.9%. The forecast assumes FOREX rates of 150 yen/US$ and 180 yen/euro.
| Item | FY2027 Forecast | FY2026 (Actual) |
|---|---|---|
| Sales Revenues (billions of yen) | 51,000.0 | 50,684.9 |
| Operating Income (billions of yen) | 3,000.0 | 3,766.2 |
| Operating Margin | 5.9% | 7.4% |
| Net Income Attributable to Toyota Motor Corporation (billions of yen) | 3,000.0 | 3,848.0 |
| Net Margin | 5.9% | 7.6% |
| Dividend per Share | 100 yen | 95 yen |
| FOREX US$ | 150 yen | 151 yen |
| FOREX Euro | 180 yen | 175 yen |
Shareholder Returns
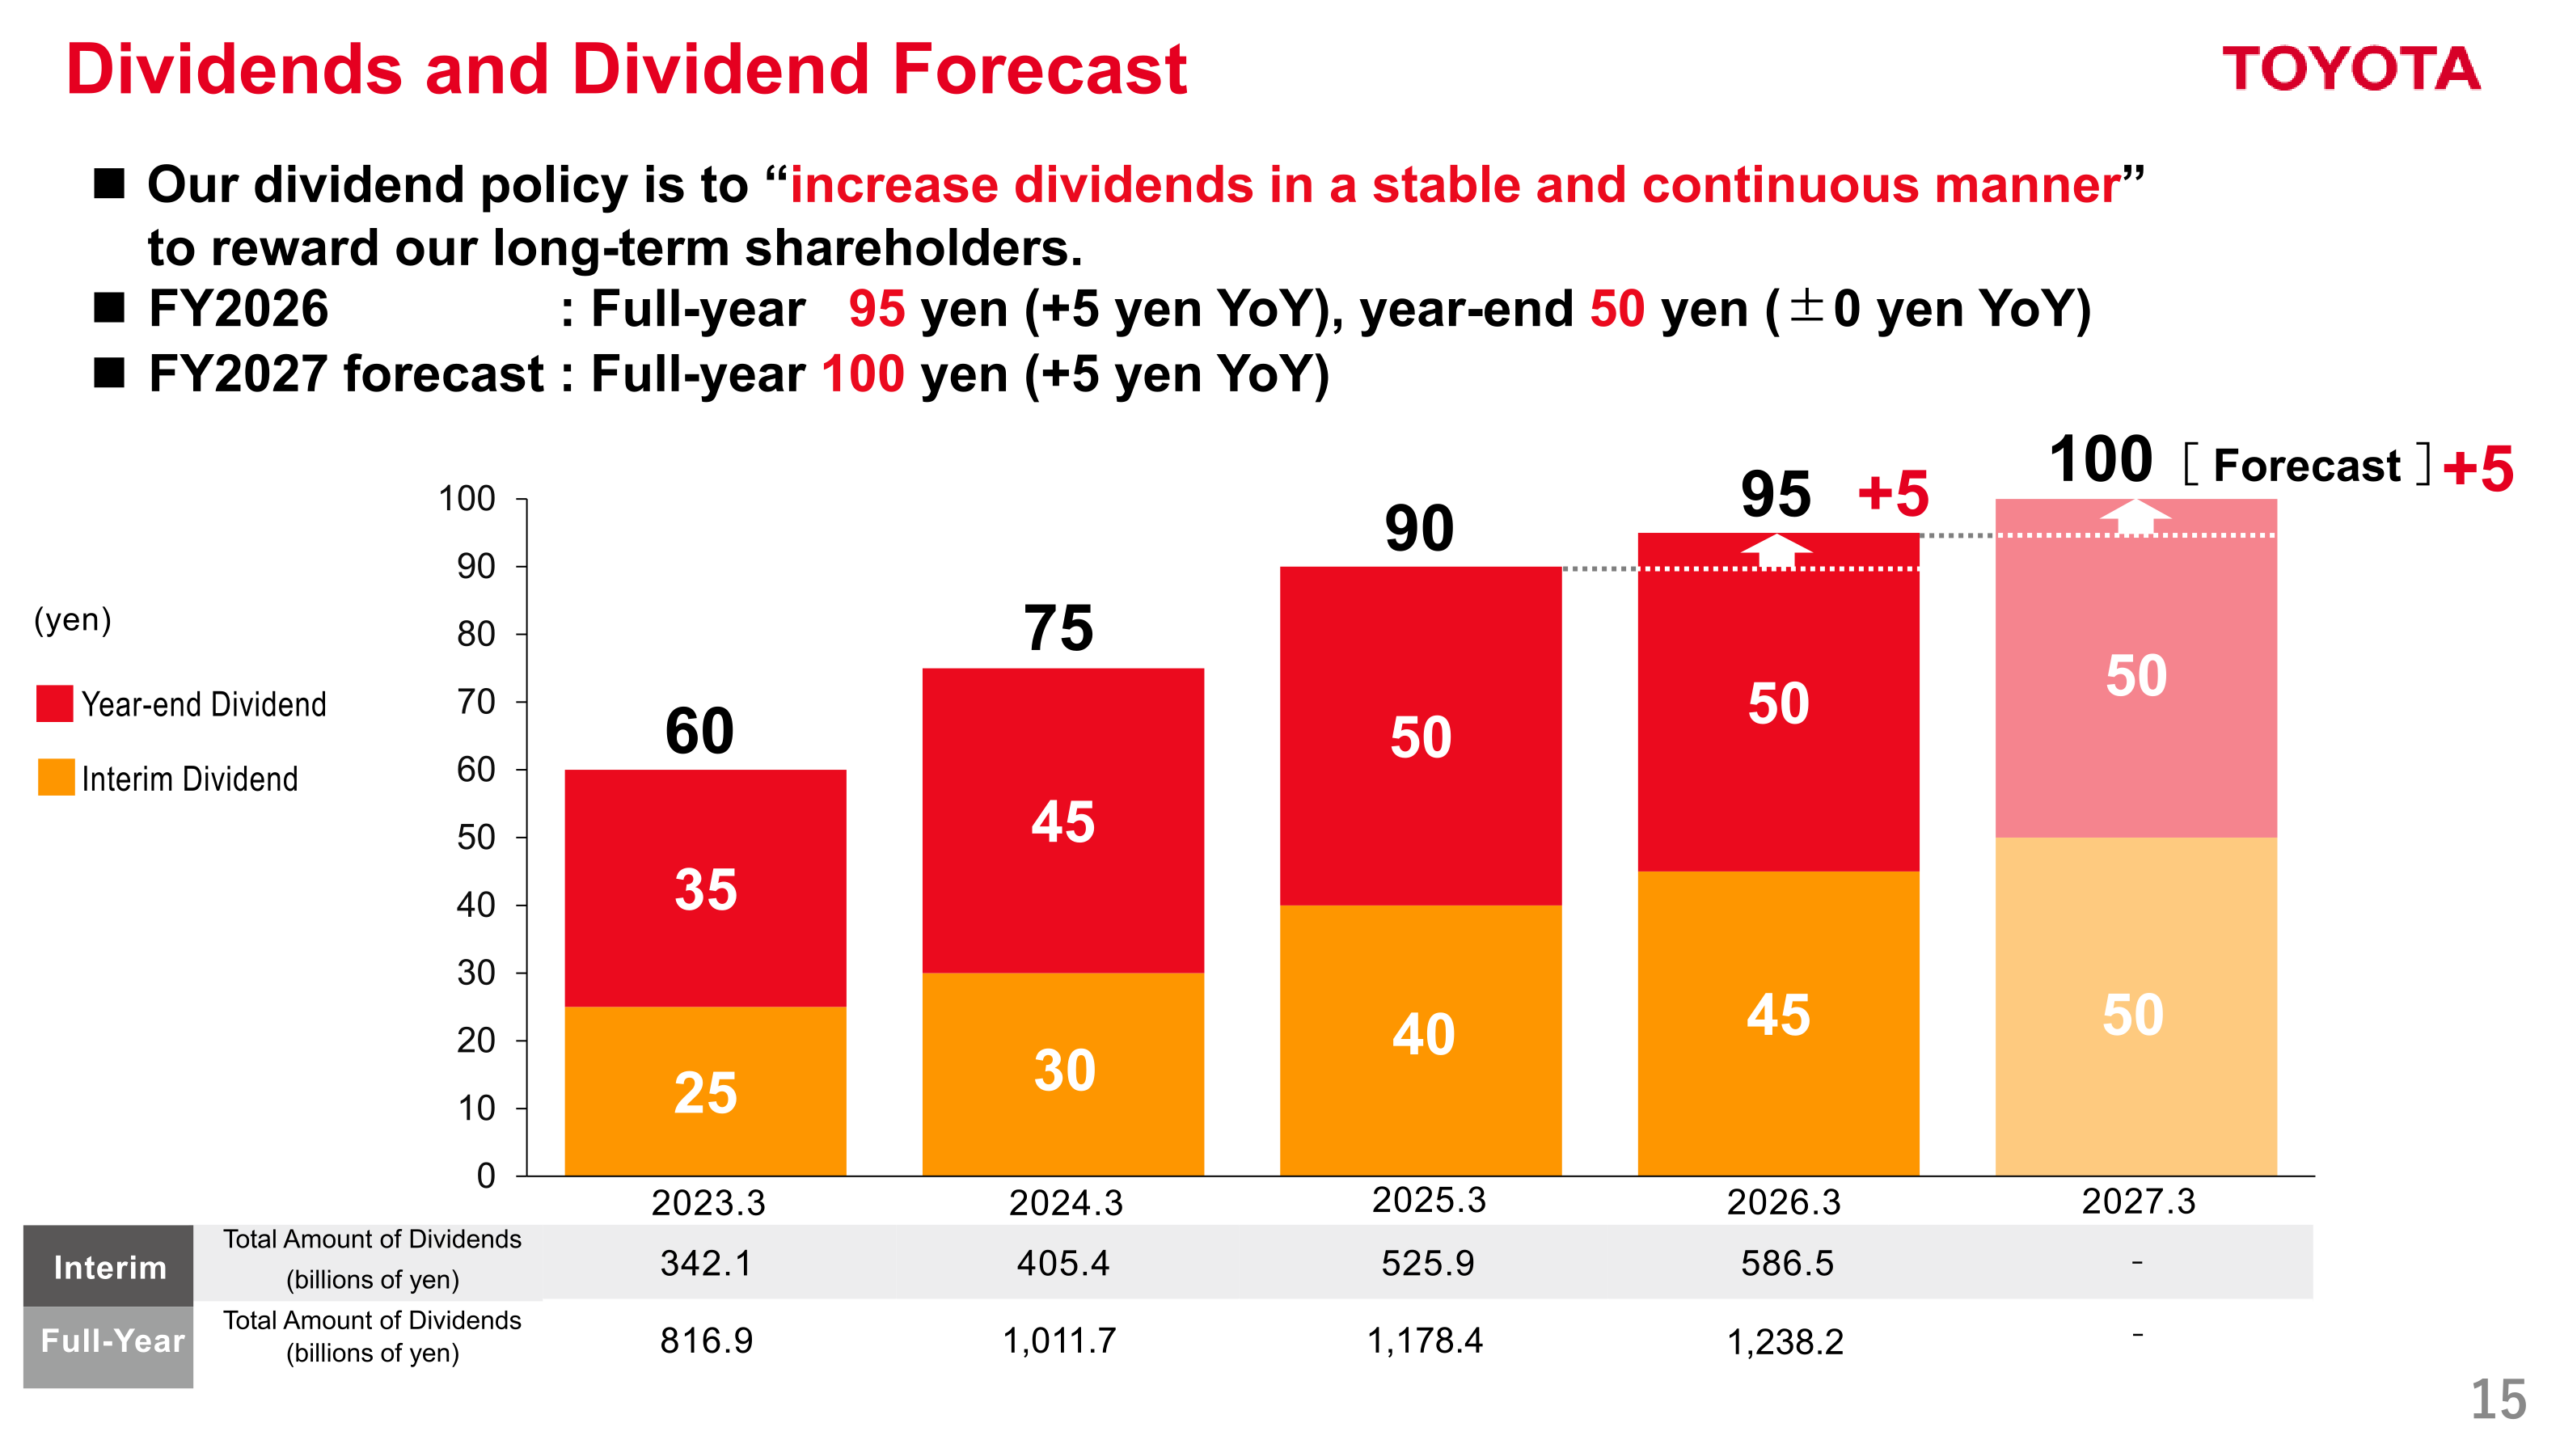
Toyota’s dividend policy is to increase dividends in a stable and continuous manner to reward long-term shareholders. The FY2026 full-year dividend was 95 yen per share (interim 45 yen, year-end 50 yen), up 5 yen year on year, for a total dividend amount of 1,238.2 billion yen. The FY2027 dividend forecast is a full-year 100 yen per share (interim 50 yen, year-end 50 yen, unchanged year on year), up 5 yen year on year. For FY2026, total shareholder return (dividends plus share repurchases) was 4,895.1 billion yen, including share repurchases of 3,656.8 billion yen; the repurchase figure includes the value of shares planned to be acquired through a tender offer as part of the process of taking Toyota Industries Corporation private, which are scheduled to be cancelled. For FY2026 year-end, no share repurchase limit was set; Toyota states it will flexibly implement share repurchases taking into account the stock price level and other factors, including requests to sell company shares.
| Fiscal Year | Full-Year Dividend per Share | Interim | Year-end | Total Dividend Amount (billions of yen) |
|---|---|---|---|---|
| FY2023 (2023.3) | 60 yen | 25 yen | 35 yen | 816.9 |
| FY2024 (2024.3) | 75 yen | 30 yen | 45 yen | 1,011.7 |
| FY2025 (2025.3) | 90 yen | 40 yen | 50 yen | 1,178.4 |
| FY2026 (2026.3) | 95 yen | 45 yen | 50 yen | 1,238.2 |
| FY2027 (2027.3) Forecast | 100 yen | 50 yen | 50 yen | This cannot be confirmed from the materials. |
Medium-Term Plan / Business Structure Reform
Toyota is pursuing mid- to long-term business structure transformation to return to a sustainable growth trajectory, centered on two initiatives: (1) “Making ever-better cars” through a five-brand strategy (Toyota, Lexus, etc.) covering a wide range of customers with a diverse vehicle lineup led by Century, full utilization of production capacity, and maximizing margin per unit; and (2) transforming into a mobility company through new mobility such as SDV (Software Defined Vehicle) and robotics, expanding diverse mobility across land, sea and air, and further expansion of existing value chain earnings. On enhancing earning power, initiatives include reorganization of production models, further procurement localization, HEV production capacity enhancement, and cost reductions beginning at the source, alongside effective utilization of existing space and capacity (AREA35 and related initiatives) and expansion of production capacity. Toyota disclosed a value chain operating income trend (management accounting basis) of 1.4 trillion yen in 2021 growing to 2.1 trillion yen in 2025, and targets approximately +150 billion yen per year in additional value chain profit by 2030 through new initiatives (mobility across land/sea/air, SDV, robotics) on top of existing measures. Toyota reiterated a target of 20% ROE as it transforms into a mobility company that expands and stabilizes profits across new vehicles, value chain, and new business areas (SDV, connected services, etc.), against an estimated cost of equity of approximately 6-10% based on the Capital Asset Pricing Model.
This article is an analysis based on publicly available information and is not a recommendation to buy or sell any specific securities. Investment decisions are your own responsibility.
![[Obayashi] Investors’ Guide 2026 — The Complete 24-Article Breakdown](https://japan-equity.com/wp-content/uploads/2026/07/hub_cover-1024x1024.png)
![[Obayashi] IR & SR Policy — Feeding Dialogue Back into Management](https://japan-equity.com/wp-content/uploads/2026/07/p32_sq-1024x1024.jpg)
![[Obayashi] Real Estate Development — 18.7% Margin, ¥287.7bn Unrealized Gains](https://japan-equity.com/wp-content/uploads/2026/07/p20_sq-1024x1024.jpg)
![[Obayashi] Domestic Civil Engineering — Resilience Spending Supports 9.6% Margin](https://japan-equity.com/wp-content/uploads/2026/07/p11_sq-1024x1024.jpg)
![[Obayashi] Share Price & External Ratings — vs TOPIX, ESG Index Inclusion](https://japan-equity.com/wp-content/uploads/2026/07/p40_sq-1024x1024.jpg)
![[Construction] ¥75.5tn Investment, Shrinking Workforce — Big-5 Market Share](https://japan-equity.com/wp-content/uploads/2026/07/p12_sq-1024x1024.jpg)



![[Obayashi] Capital Policy & Shareholder Returns — ROE 10%+, DOE ~5%, ¥100bn Buyback](https://japan-equity.com/wp-content/uploads/2026/07/p27_sq-1024x1024.jpg)
![[Obayashi] Reducing Cross-Shareholdings — ¥285.2bn Sold in Five Years](https://japan-equity.com/wp-content/uploads/2026/07/p29_sq-1024x1024.jpg)
![[Obayashi] ¥750bn Investment Plan — ¥300bn to Development, ¥190bn to Tech/DX](https://japan-equity.com/wp-content/uploads/2026/07/p30_sq-1024x1024.jpg)
![[Obayashi] MTP2022 KPIs — Operating Profit ~2x Target, ROE 14.4%](https://japan-equity.com/wp-content/uploads/2026/07/p25_sq-1024x1024.jpg)
![[Obayashi] Cash Allocation — ¥420bn Investment CF Over Five Years](https://japan-equity.com/wp-content/uploads/2026/07/p26_sq-1024x1024.jpg)
![[Obayashi] Green Energy — 44 Plants, 344MW, and the Green Hydrogen Challenge](https://japan-equity.com/wp-content/uploads/2026/07/p21_sq-1024x1024.jpg)
![[Obayashi] Tackling the Labor Shortage — Robotics Construction®](https://japan-equity.com/wp-content/uploads/2026/07/p14_sq-1024x1024.jpg)
