
This article is based on publicly available IR materials and is not a recommendation to buy or sell any specific securities.
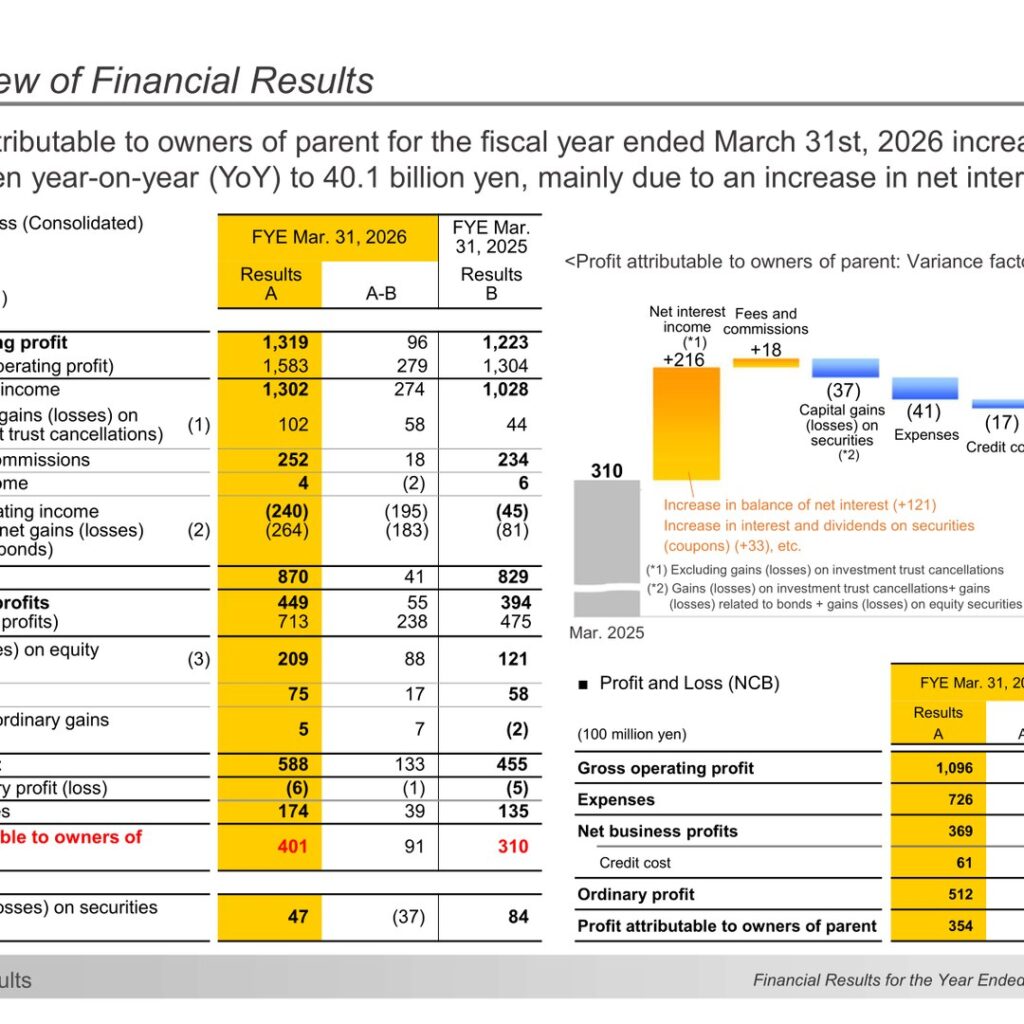
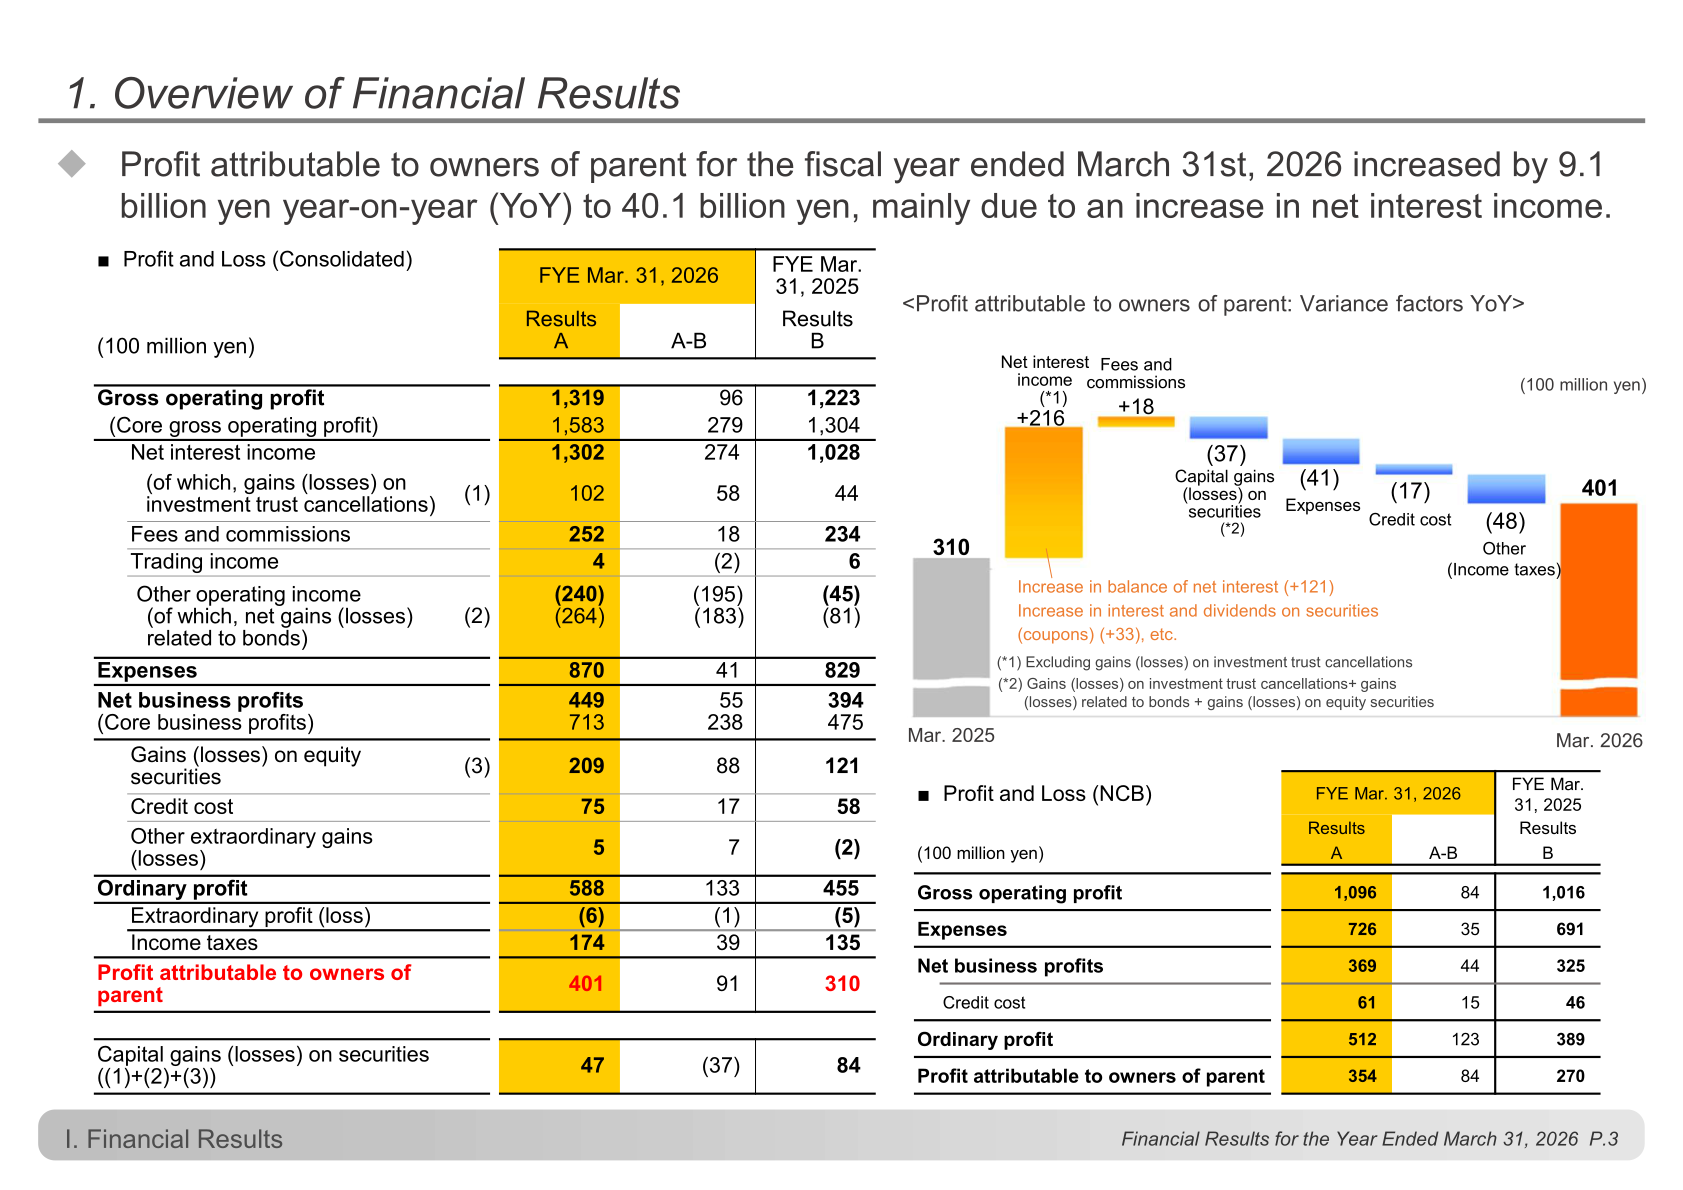
Nishi-Nippon Financial Holdings, Inc. (NNFH), the Fukuoka-based holding company of The Nishi-Nippon City Bank (NCB), reported profit attributable to owners of parent of 40.1 billion yen for the fiscal year ended March 31, 2026, an increase of 9.1 billion yen year-on-year, mainly due to an increase in net interest income. Consolidated net interest income rose 27.4 billion yen YoY to 130.2 billion yen, while expenses and credit cost also increased. For the fiscal year ending March 31, 2027, the Group forecasts profit attributable to owners of parent of 48.0 billion yen, up 7.9 billion yen YoY, and plans to raise the annual dividend per share from 118 yen to 140 yen. The company labels the fiscal year ended March 31, 2026 as FY2025.
Consolidated Results (Full-Year Actual)
On a consolidated basis, gross operating profit was 1,319 (100 million yen), up 96 YoY, and core gross operating profit was 1,583, up 279. Net interest income was 1,302, up 274, including 102 of gains (losses) on investment trust cancellations (44 in the previous year). Fees and commissions were 252, up 18. Other operating income was (240) against (45) a year earlier, reflecting net gains (losses) related to bonds of (264). Expenses rose 41 to 870, net business profits rose 55 to 449 and core business profits rose 238 to 713. Credit cost was 75, up 17, ordinary profit was 588, up 133, and profit attributable to owners of parent was 401, up 91. On a non-consolidated basis, NCB posted gross operating profit of 1,096 (up 84), expenses of 726 (up 35), net business profits of 369 (up 44), credit cost of 61 (up 15), ordinary profit of 512 (up 123) and profit attributable to owners of parent of 354 (up 84).
| Item (100 million yen) | FYE Mar. 31, 2026 (A) | FYE Mar. 31, 2025 (B) | A-B |
|---|---|---|---|
| Gross operating profit | 1,319 | 1,223 | 96 |
| (Core gross operating profit) | 1,583 | 1,304 | 279 |
| Net interest income | 1,302 | 1,028 | 274 |
| (of which, gains (losses) on investment trust cancellations) | 102 | 44 | 58 |
| Fees and commissions | 252 | 234 | 18 |
| Trading income | 4 | 6 | (2) |
| Other operating income | (240) | (45) | (195) |
| (of which, net gains (losses) related to bonds) | (264) | (81) | (183) |
| Expenses | 870 | 829 | 41 |
| Net business profits | 449 | 394 | 55 |
| (Core business profits) | 713 | 475 | 238 |
| Gains (losses) on equity securities | 209 | 121 | 88 |
| Credit cost | 75 | 58 | 17 |
| Ordinary profit | 588 | 455 | 133 |
| Extraordinary profit (loss) | (6) | (5) | (1) |
| Income taxes | 174 | 135 | 39 |
| Profit attributable to owners of parent | 401 | 310 | 91 |
Earnings Drivers: Net Interest Income, Fees and Expenses
Interest on loans and discounts at NCB increased by 28.1 billion yen YoY to 117.8 billion yen on the back of the rise in yield and solid growth of business loans and personal loans, while interest on deposits and negotiable certificates of deposit increased by 16.1 billion yen YoY to 23.3 billion yen. Interest and dividends on securities increased by 9.0 billion yen YoY to 38.3 billion yen, mainly due to an increase in gains on investment trust cancellations. Consolidated fees and commissions increased by 1.8 billion yen YoY to 25.2 billion yen, mainly due to higher corporate customer-related fees, settlement-related fees, and client assets-related fees at the securities subsidiary. Expenses increased by 4.1 billion yen YoY to 87.0 billion yen, mainly due to an increase in personnel expenses resulting from pay raises and an increase in non-personnel expenses associated with strategic investments. Credit cost increased by 1.7 billion yen YoY to 7.5 billion yen, with the credit cost rate at NCB at 0.063% and the ratio of non-performing claims at 1.49% with a coverage ratio of 81.2% as of the end of March 2026.
| Fees and commissions by group company (100 million yen) | FYE Mar. 31, 2026 | FYE Mar. 31, 2025 | FYE Mar. 31, 2027 (Forecast) |
|---|---|---|---|
| NCB | 114 | 108 | 127 |
| Kyushu Card | 62 | 59 | 63 |
| NCTT Securities | 36 | 31 | 31 |
| NCB R&C | 5 | 4 | 5 |
| Other subsidiaries | 35 | 32 | 39 |
| Total (Consolidated) | 252 | 234 | 265 |
Forecast for the Fiscal Year Ending March 31, 2027
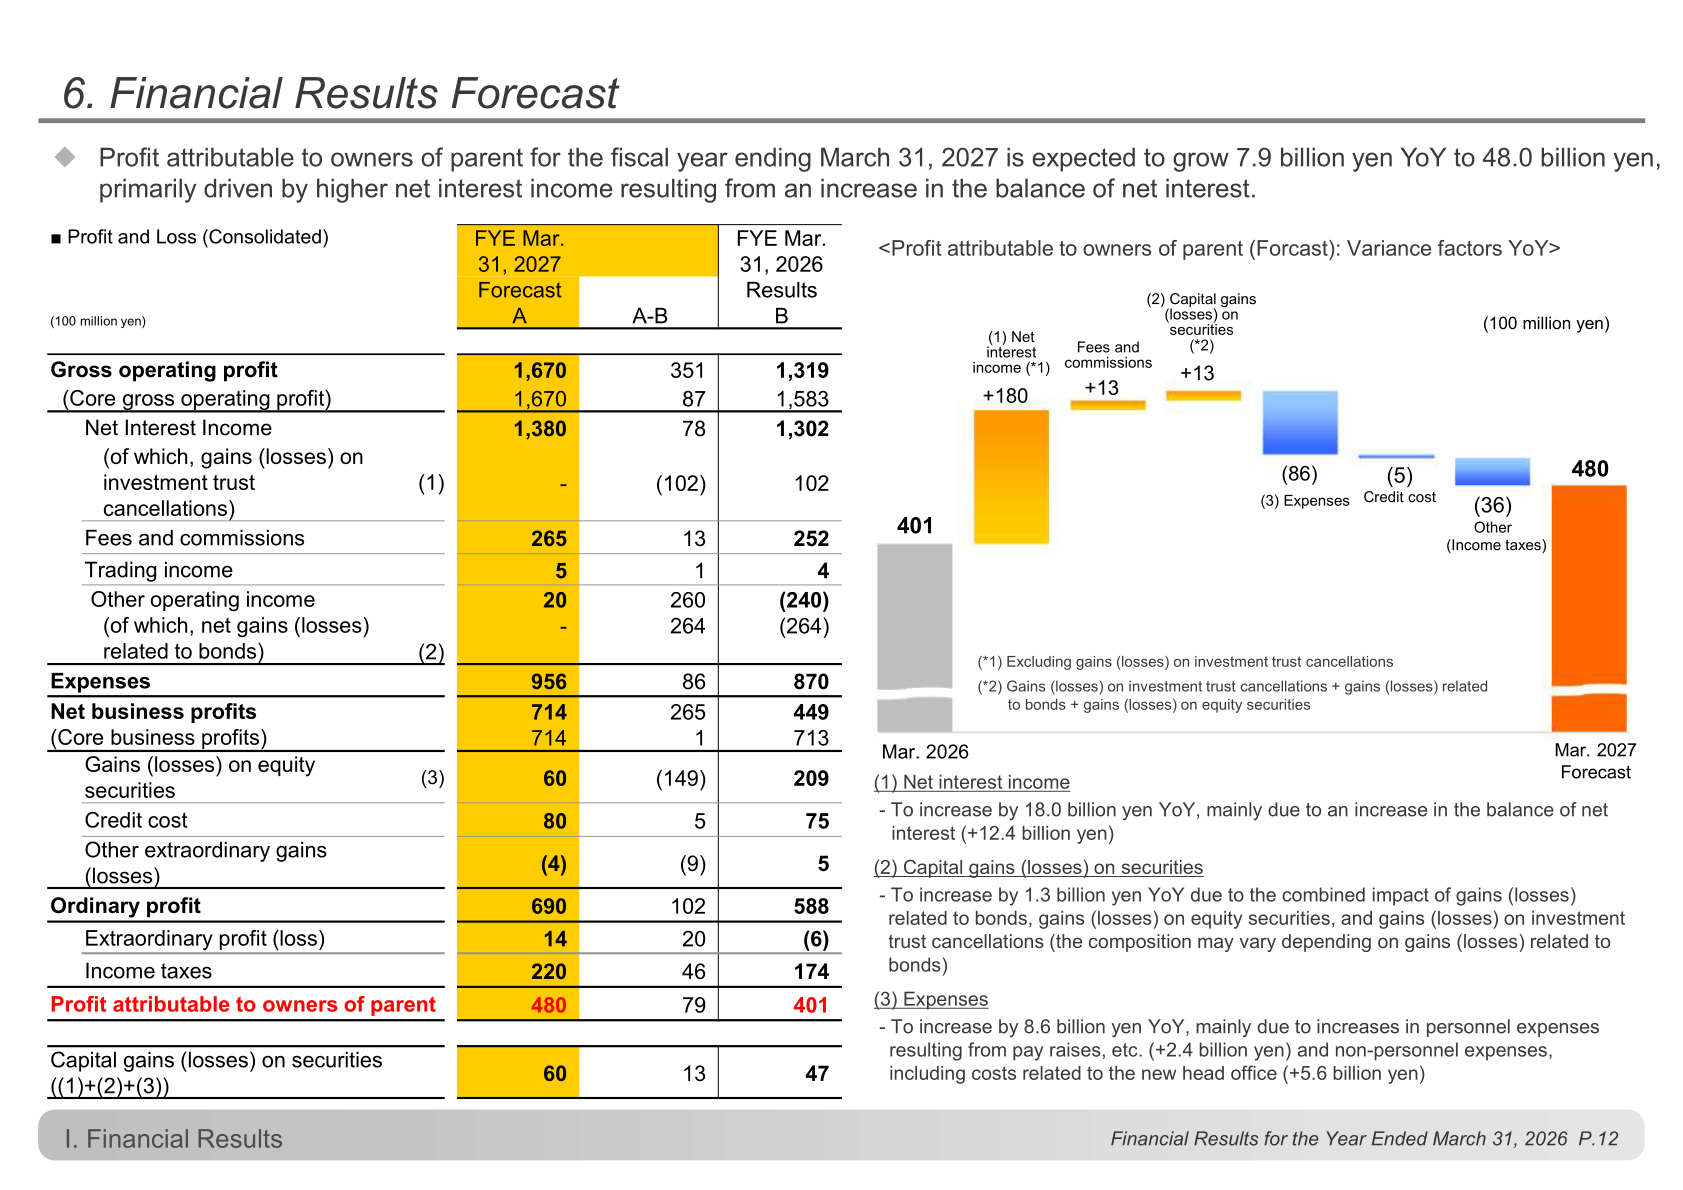
Profit attributable to owners of parent for the fiscal year ending March 31, 2027 is expected to grow 7.9 billion yen YoY to 48.0 billion yen, primarily driven by higher net interest income resulting from an increase in the balance of net interest. The Group expects net interest income to increase by 18.0 billion yen YoY, mainly due to an increase in the balance of net interest (+12.4 billion yen); capital gains (losses) on securities to increase by 1.3 billion yen YoY; and expenses to increase by 8.6 billion yen YoY, mainly due to increases in personnel expenses resulting from pay raises, etc. (+2.4 billion yen) and non-personnel expenses, including costs related to the new head office (+5.6 billion yen). The forecast assumes an additional policy rate hike in October 2026 (0.75% to 1.0%).
| Item (100 million yen) | FYE Mar. 31, 2027 (Forecast, A) | FYE Mar. 31, 2026 (Results, B) | A-B |
|---|---|---|---|
| Gross operating profit | 1,670 | 1,319 | 351 |
| (Core gross operating profit) | 1,670 | 1,583 | 87 |
| Net interest income | 1,380 | 1,302 | 78 |
| Fees and commissions | 265 | 252 | 13 |
| Trading income | 5 | 4 | 1 |
| Other operating income | 20 | (240) | 260 |
| Expenses | 956 | 870 | 86 |
| Net business profits | 714 | 449 | 265 |
| (Core business profits) | 714 | 713 | 1 |
| Gains (losses) on equity securities | 60 | 209 | (149) |
| Credit cost | 80 | 75 | 5 |
| Ordinary profit | 690 | 588 | 102 |
| Profit attributable to owners of parent | 480 | 401 | 79 |
Shareholder Returns
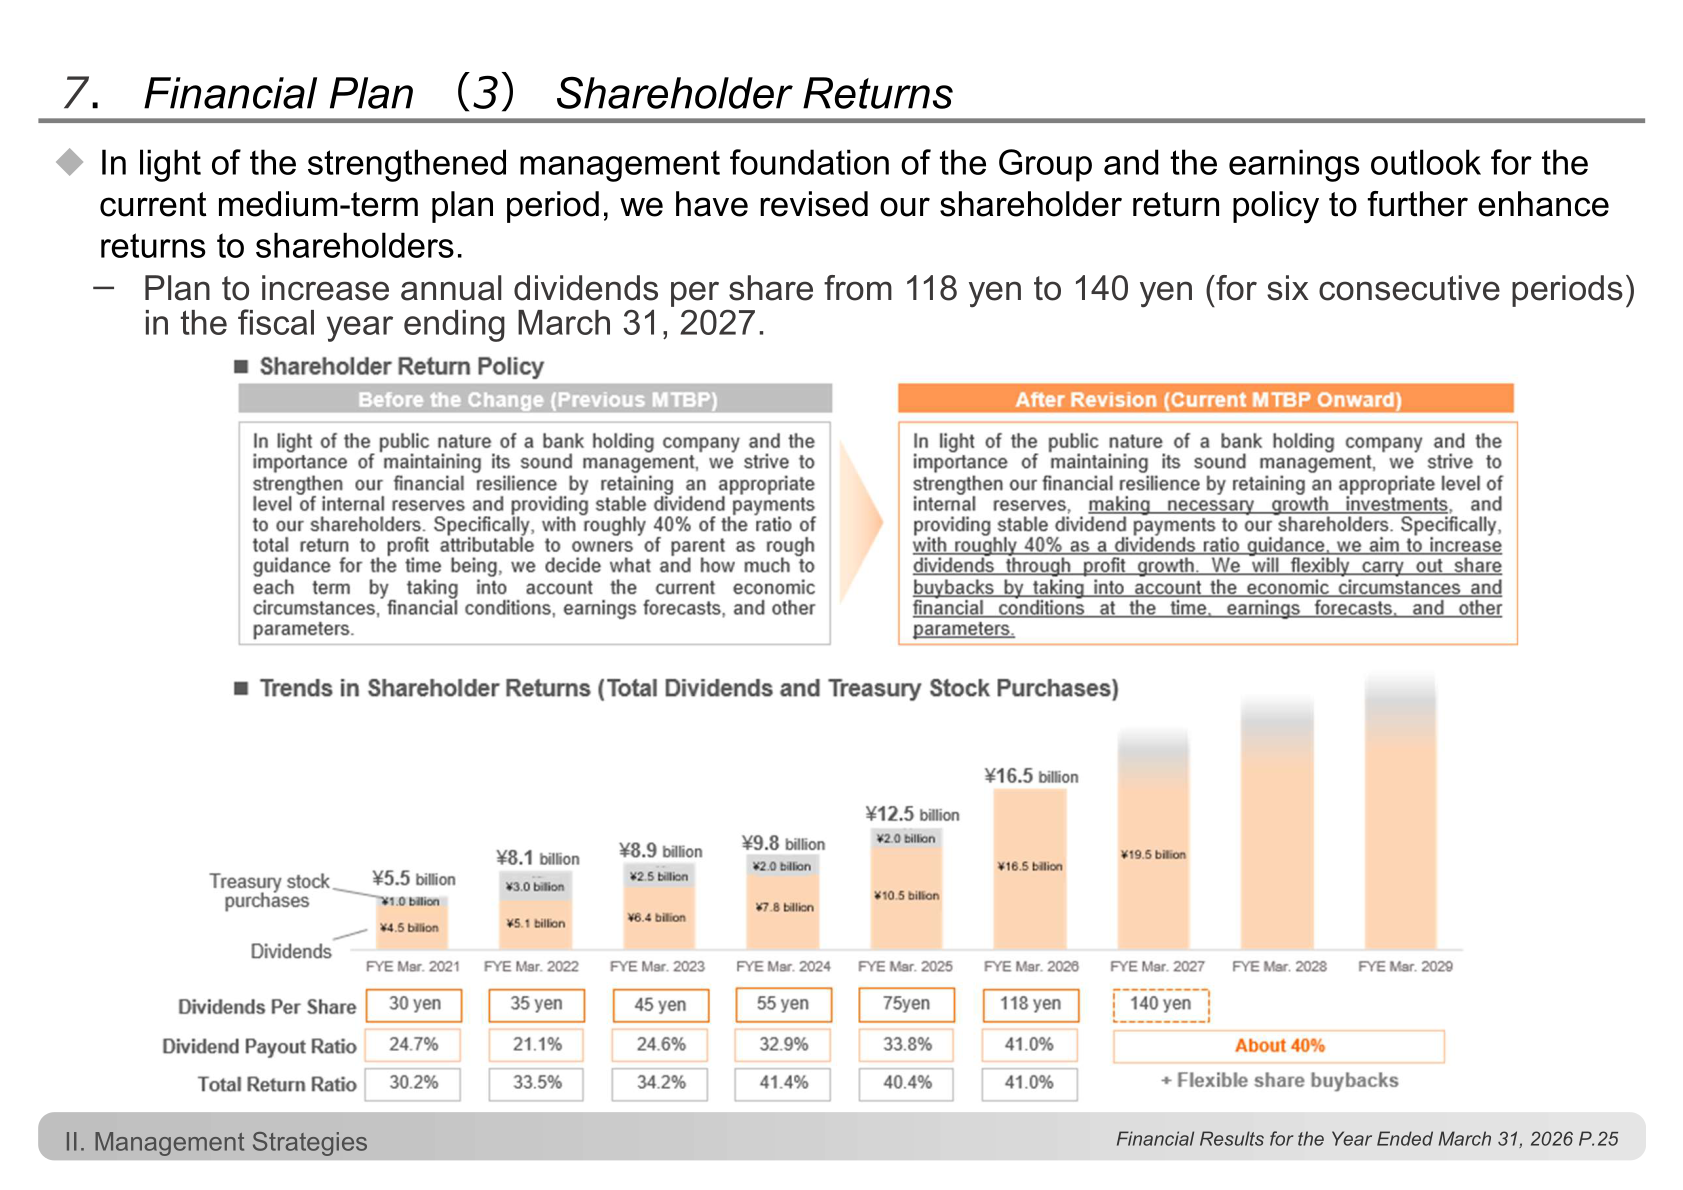
In light of the strengthened management foundation of the Group and the earnings outlook for the current medium-term plan period, NNFH has revised its shareholder return policy to further enhance returns to shareholders. Under the revised policy, the Group aims to increase dividends through profit growth with roughly 40% as a dividends ratio guidance, and will flexibly carry out share buybacks by taking into account the economic circumstances and financial conditions at the time, earnings forecasts, and other parameters. The annual dividend per share for the fiscal year ended March 31, 2026 was 118 yen, with a dividend payout ratio of 41.0% and a total return ratio of 41.0%. The Group plans to increase annual dividends per share from 118 yen to 140 yen (for six consecutive periods) in the fiscal year ending March 31, 2027.
| Item | FYE Mar. 2026 | FYE Mar. 2027 (Plan) |
|---|---|---|
| Dividends per share | 118 yen | 140 yen |
| Dividend payout ratio | 41.0% | About 40% |
| Total return ratio | 41.0% | About 40% + flexible share buybacks |
| Total shareholder returns (dividends and treasury stock purchases) | ¥16.5 billion | ¥19.5 billion |
Medium-Term Business Plan “Co-Creating the Future 2029”
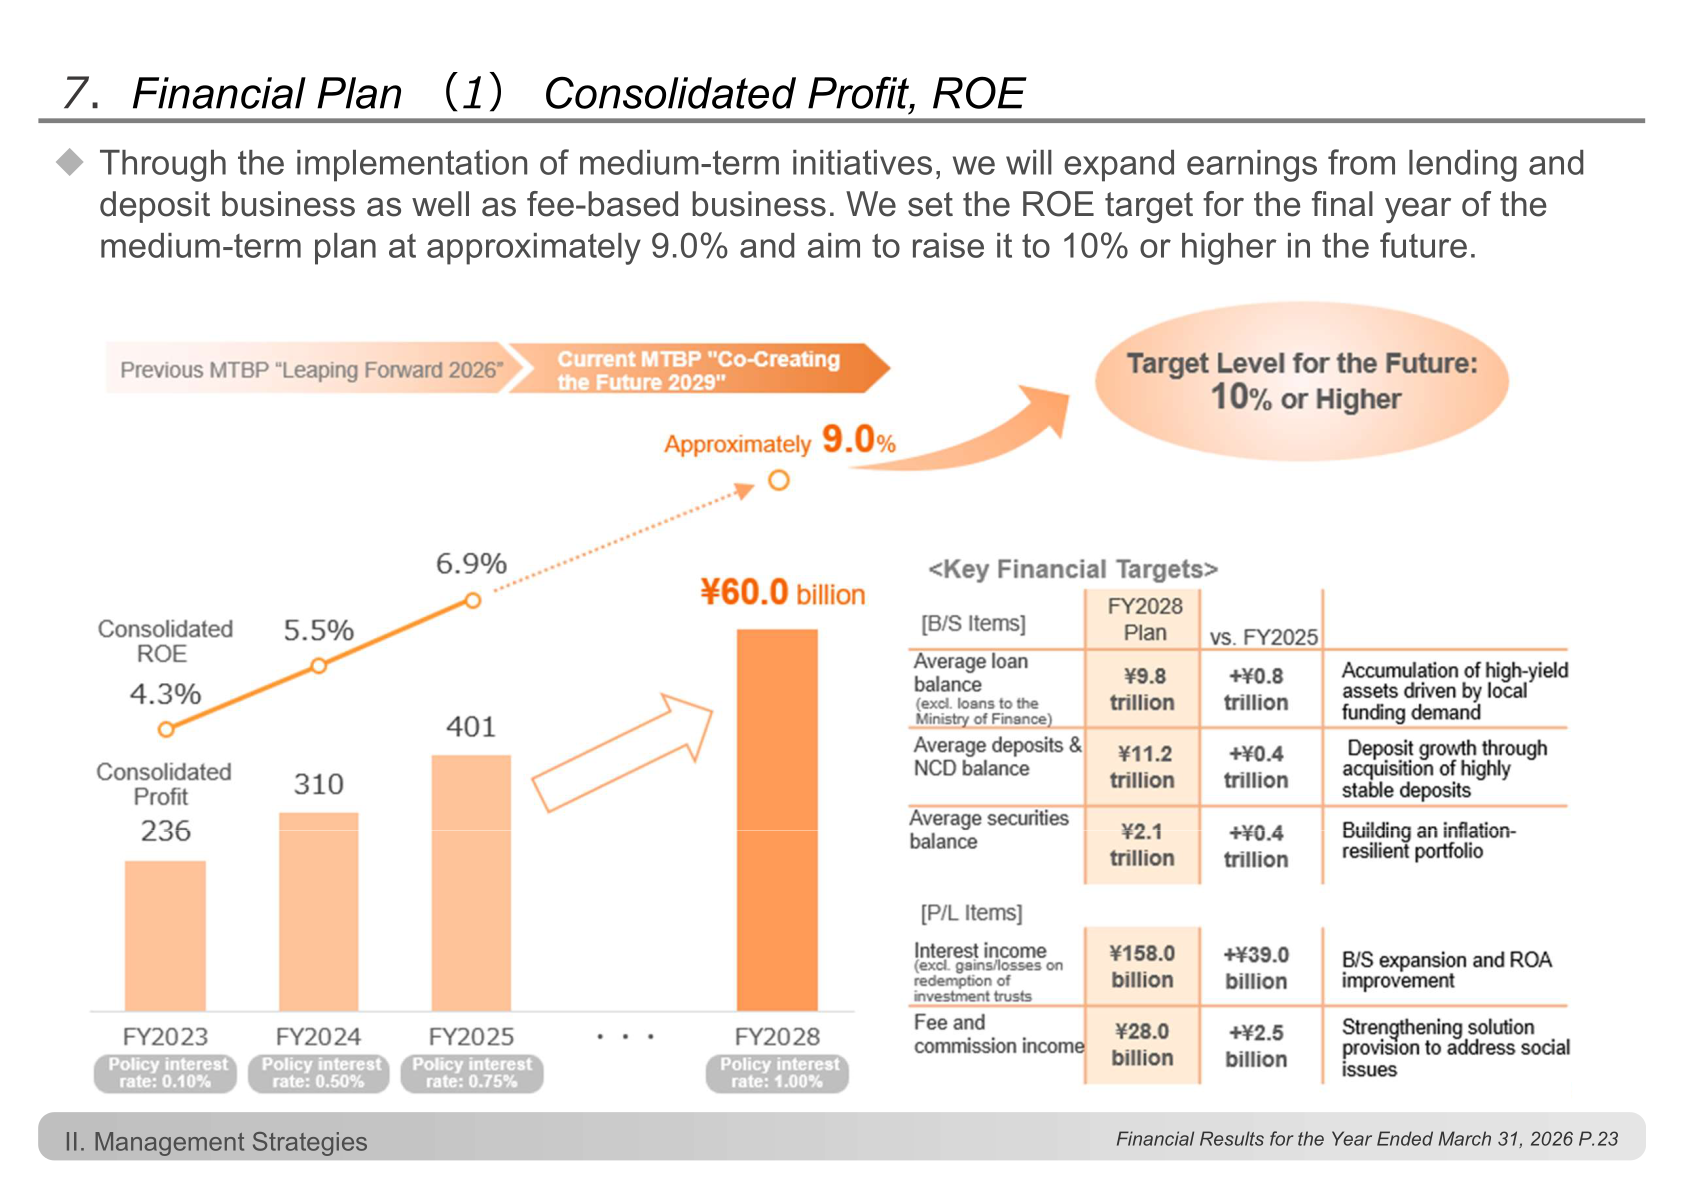
Under the previous medium-term business plan “Leaping Forward 2026,” all four key KPIs achieved their targets: consolidated profit of ¥40.1 billion (of which ¥4.8 billion contributed by Group companies other than NCB) against a target of ¥32.0 billion, consolidated ROE of 6.89% against approximately 6%, consolidated core OHR of 54.9% against approximately 60%, and a consolidated capital adequacy ratio of 12.59% at the end of March 2025 moving to 11.44% (10.24% based on full implementation of Basel III) against a mid-11% range target. Under the new medium-term business plan “Co-Creating the Future 2029,” the Group targets consolidated profit of ¥60.0 billion (of which ¥5.5 billion from Group companies other than NCB) and consolidated ROE of approximately 9% in the fiscal year ending March 31, 2029, with a consolidated OHR in the lower 50% range and a consolidated capital adequacy ratio in the lower 10% range, assuming a policy interest rate of 1.0%. Key financial targets for FY2028 include an average loan balance (excluding loans to the Ministry of Finance) of ¥9.8 trillion (+¥0.8 trillion vs. FY2025), average deposits and NCD balance of ¥11.2 trillion (+¥0.4 trillion), average securities balance of ¥2.1 trillion (+¥0.4 trillion), interest income of ¥158.0 billion (+¥39.0 billion) and fee and commission income of ¥28.0 billion (+¥2.5 billion). The ratio of strategic shares to consolidated net assets stood at 18.2% as of March 31, 2026, below the target of “less than 20%” announced in November 2024.
This article is an analysis based on publicly available information and is not a recommendation to buy or sell any specific securities. Investment decisions are your own responsibility.
![[Obayashi] Investors’ Guide 2026 — The Complete 24-Article Breakdown](https://japan-equity.com/wp-content/uploads/2026/07/hub_cover-1024x1024.png)
![[Obayashi] IR & SR Policy — Feeding Dialogue Back into Management](https://japan-equity.com/wp-content/uploads/2026/07/p32_sq-1024x1024.jpg)
![[Obayashi] Real Estate Development — 18.7% Margin, ¥287.7bn Unrealized Gains](https://japan-equity.com/wp-content/uploads/2026/07/p20_sq-1024x1024.jpg)
![[Obayashi] Domestic Civil Engineering — Resilience Spending Supports 9.6% Margin](https://japan-equity.com/wp-content/uploads/2026/07/p11_sq-1024x1024.jpg)
![[Obayashi] Share Price & External Ratings — vs TOPIX, ESG Index Inclusion](https://japan-equity.com/wp-content/uploads/2026/07/p40_sq-1024x1024.jpg)
![[Construction] ¥75.5tn Investment, Shrinking Workforce — Big-5 Market Share](https://japan-equity.com/wp-content/uploads/2026/07/p12_sq-1024x1024.jpg)



![[Obayashi] Capital Policy & Shareholder Returns — ROE 10%+, DOE ~5%, ¥100bn Buyback](https://japan-equity.com/wp-content/uploads/2026/07/p27_sq-1024x1024.jpg)
![[Obayashi] Reducing Cross-Shareholdings — ¥285.2bn Sold in Five Years](https://japan-equity.com/wp-content/uploads/2026/07/p29_sq-1024x1024.jpg)
![[Obayashi] ¥750bn Investment Plan — ¥300bn to Development, ¥190bn to Tech/DX](https://japan-equity.com/wp-content/uploads/2026/07/p30_sq-1024x1024.jpg)
![[Obayashi] MTP2022 KPIs — Operating Profit ~2x Target, ROE 14.4%](https://japan-equity.com/wp-content/uploads/2026/07/p25_sq-1024x1024.jpg)
![[Obayashi] Cash Allocation — ¥420bn Investment CF Over Five Years](https://japan-equity.com/wp-content/uploads/2026/07/p26_sq-1024x1024.jpg)
![[Obayashi] Green Energy — 44 Plants, 344MW, and the Green Hydrogen Challenge](https://japan-equity.com/wp-content/uploads/2026/07/p21_sq-1024x1024.jpg)
![[Obayashi] Tackling the Labor Shortage — Robotics Construction®](https://japan-equity.com/wp-content/uploads/2026/07/p14_sq-1024x1024.jpg)
