
This article is based on publicly available IR materials and is not a recommendation to buy or sell any specific securities.
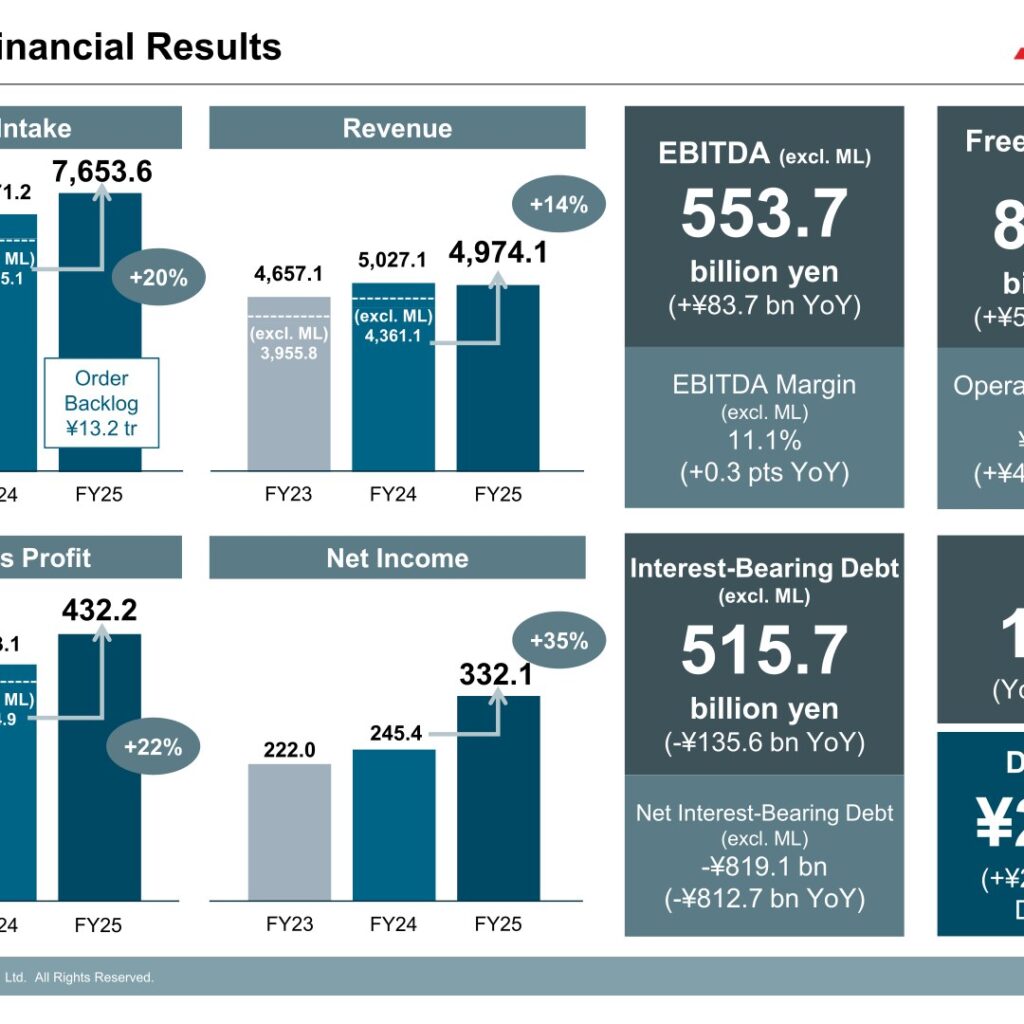
Mitsubishi Heavy Industries, Ltd. (MHI) reported record-high order intake, business profit, net income, and free cash flow for FY2025. Order intake rose 20% year-on-year to ¥7,653.6 billion, led by growth in Energy Systems, with main contributions from Gas Turbine Combined Cycle (GTCC), Nuclear Power, and Engineering. Revenue increased 14% to ¥4,974.1 billion, and business profit grew 22% to ¥432.2 billion, with profit increasing in all segments despite losses in some thermal power projects and a goodwill impairment in Industrial Power Solutions. Net income rose 35% to ¥332.1 billion, and MHI raised its planned full-year dividend to ¥25 per share, ¥1 higher than previous guidance of ¥24 per share.
Note: Under IFRS as adopted by MHI, businesses related to the former Mitsubishi Logisnext Co., Ltd. (renamed Logisnext Co., Ltd. on April 30, 2026, and removed from the MHI consolidated base on May 1, 2026, referred to as “ML”) are classified as discontinued operations. Unless otherwise stated, order intake, revenue, and business profit figures for FY2024 and FY2025 represent continuing operations excluding ML.
Consolidated Results (Full-Year Actual)
Order intake, revenue, business profit, net income, EBITDA, and free cash flow all reached record highs in FY2025. EBITDA (excl. ML) rose to ¥553.7 billion (+¥83.7 billion YoY), with EBITDA margin improving to 11.1% (+0.3 pts YoY). Free cash flow (incl. ML) increased by ¥550.6 billion YoY to ¥893.4 billion, supported by operating cash flow of ¥942.6 billion (+¥412.1 billion YoY) driven by advances received primarily in GTCC. Interest-bearing debt (excl. ML) decreased by ¥135.6 billion YoY to ¥515.7 billion, and net interest-bearing debt (excl. ML) was -¥819.1 billion, a decrease of ¥812.7 billion YoY. ROE was 12.2% (+1.5 pts YoY), and order backlog stood at ¥13.2 trillion.
| Item | FY2025 | FY2024 (Excl. ML) | YoY Change |
|---|---|---|---|
| Order Intake | 7,653.6 | 6,405.1 | +1,248.4 (+19.5%) |
| Revenue | 4,974.1 | 4,361.1 | +613.0 (+14.1%) |
| Profit from Business Activities (Margin) | 432.2 (8.7%) | 354.9 (8.1%) | +77.2 (+21.8%) (+0.6 pts) |
| Profit Attributable to Owners of Parent (Margin) | 332.1 (6.7%) | 245.4 (5.6%) | +86.6 (+35.3%) (+1.1 pts) |
| EBITDA (Margin) | 553.7 (11.1%) | 469.9 (10.8%) | +83.7 (+17.8%) (+0.3 pts) |
| Free Cash Flow | 893.4 | 342.7 | +550.6 |
| Operating Cash Flow | 942.6 | 530.4 | +412.1 |
| Investing Cash Flow | -49.1 | -187.7 | +138.5 |
Segment Results
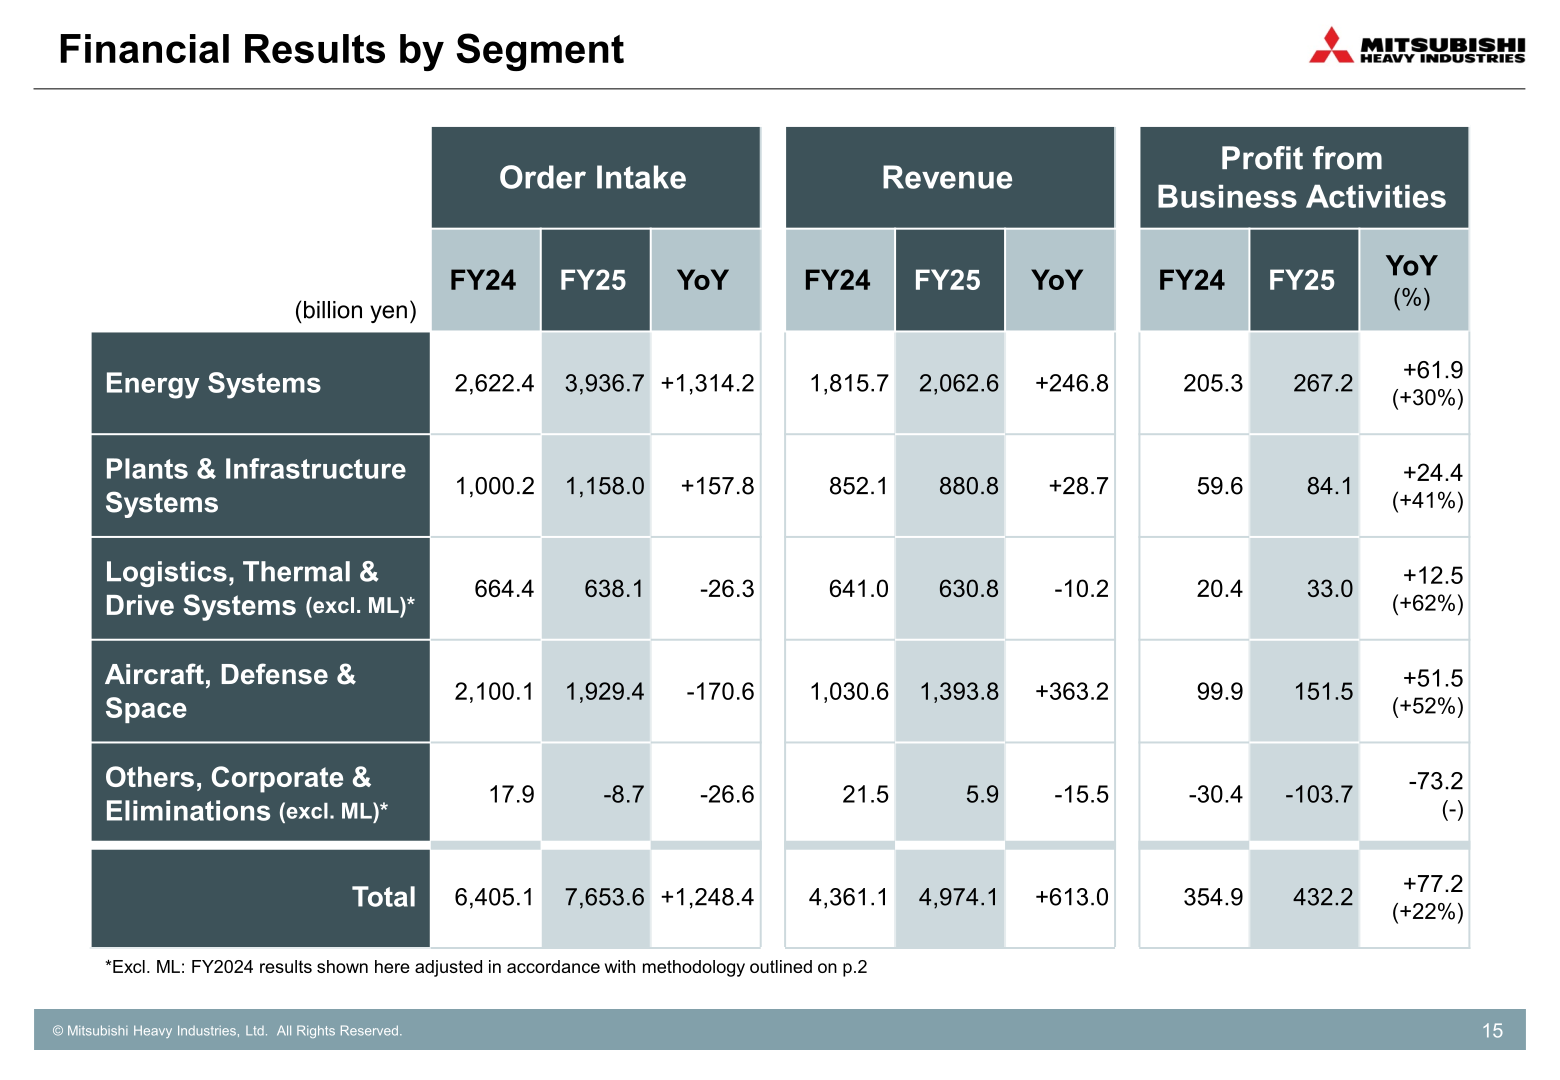
Business profit increased year-on-year in all segments. Energy Systems profit grew 30% to ¥267.2 billion, driven by strong performance in GTCC and Nuclear Power, partly offset by losses in some Steam Power projects. Plants & Infrastructure Systems profit rose 41% to ¥84.1 billion on strong results in Metals Machinery and Machinery Systems. Logistics, Thermal & Drive Systems (excl. ML) profit increased 62% to ¥33.0 billion. Aircraft, Defense & Space profit rose 52% to ¥151.5 billion, with revenue up 40% YoY driven by strong order intake from FY2023 onward, including the Australian frigate program. Others, Corporate & Eliminations recorded a loss of ¥103.7 billion, widening from a loss of ¥30.4 billion in FY2024, reflecting the goodwill impairment in Industrial Power Solutions.
| Segment | Metric | FY2025 | FY2024 |
|---|---|---|---|
| Energy Systems | Order Intake | 3,936.7 | 2,622.4 |
| Energy Systems | Revenue | 2,062.6 | 1,815.7 |
| Energy Systems | Profit from Business Activities | 267.2 | 205.3 |
| Plants & Infrastructure Systems | Order Intake | 1,158.0 | 1,000.2 |
| Plants & Infrastructure Systems | Revenue | 880.8 | 852.1 |
| Plants & Infrastructure Systems | Profit from Business Activities | 84.1 | 59.6 |
| Logistics, Thermal & Drive Systems (Excl. ML) | Order Intake | 638.1 | 664.4 |
| Logistics, Thermal & Drive Systems (Excl. ML) | Revenue | 630.8 | 641.0 |
| Logistics, Thermal & Drive Systems (Excl. ML) | Profit from Business Activities | 33.0 | 20.4 |
| Aircraft, Defense & Space | Order Intake | 1,929.4 | 2,100.1 |
| Aircraft, Defense & Space | Revenue | 1,393.8 | 1,030.6 |
| Aircraft, Defense & Space | Profit from Business Activities | 151.5 | 99.9 |
| Others, Corporate & Eliminations (Excl. ML) | Order Intake | -8.7 | 17.9 |
| Others, Corporate & Eliminations (Excl. ML) | Revenue | 5.9 | 21.5 |
| Others, Corporate & Eliminations (Excl. ML) | Profit from Business Activities | -103.7 | -30.4 |
| Total | Order Intake | 7,653.6 | 6,405.1 |
| Total | Revenue | 4,974.1 | 4,361.1 |
| Total | Profit from Business Activities | 432.2 | 354.9 |
FY2026 Forecast
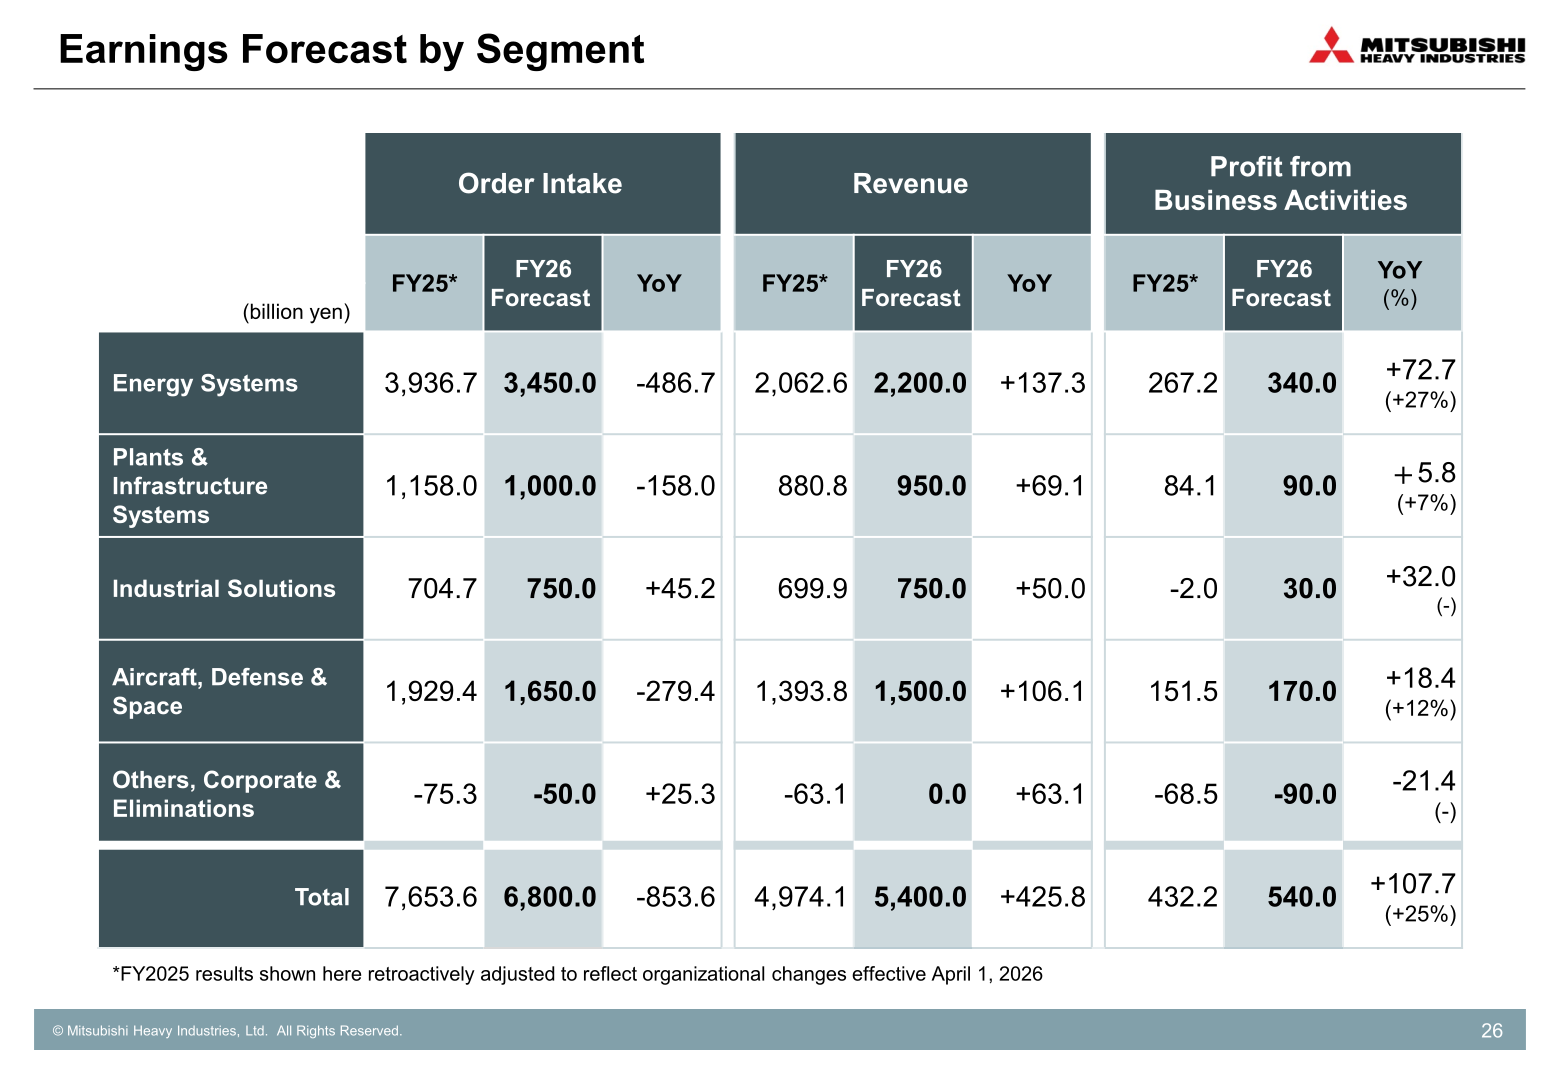
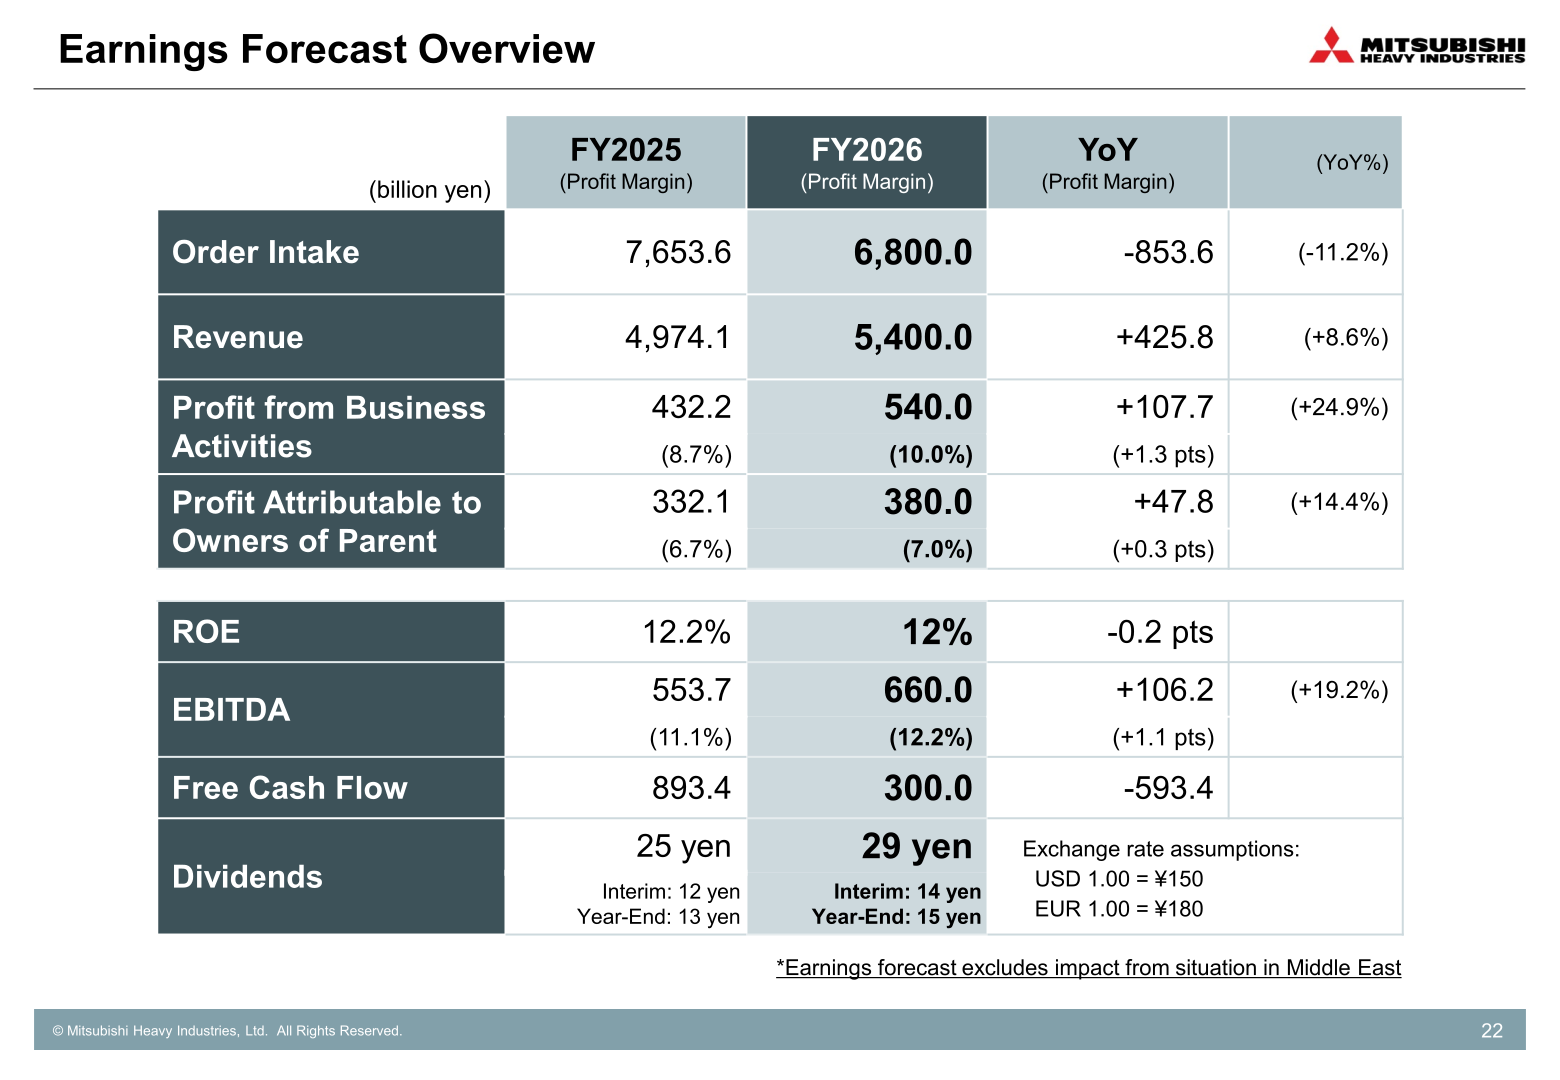
For FY2026, MHI forecasts order intake of ¥6,800.0 billion (-11.2% YoY), revenue of ¥5,400.0 billion (+8.6%), business profit of ¥540.0 billion (+24.9%, margin 10.0%), and net income of ¥380.0 billion (+14.4%, margin 7.0%). ROE is forecast at 12% (-0.2 pts YoY), EBITDA at ¥660.0 billion (+19.2%, margin 12.2%), and free cash flow at ¥300.0 billion, down from ¥893.4 billion in FY2025. Business profit is expected to grow driven by higher revenue and improved margins, primarily in Energy Systems and Aircraft, Defense & Space, as well as a rebound from the FY2025 Industrial Power Solutions goodwill impairment. By segment, Energy Systems is forecast at ¥3.45 trillion order intake, ¥2.2 trillion revenue, and ¥340.0 billion business profit, driven primarily by GTCC and Nuclear Power. Plants & Infrastructure Systems is forecast at ¥1.0 trillion / ¥0.95 trillion / ¥90.0 billion. Industrial Solutions (formerly part of Logistics, Thermal & Drive Systems) is forecast at ¥0.75 trillion / ¥0.75 trillion / ¥30.0 billion, on an expected increase in Engines and HVAC units sold. Aircraft, Defense & Space is forecast at ¥1.65 trillion / ¥1.5 trillion / ¥170.0 billion, with Defense & Space revenue expected to grow 10% YoY. The forecast excludes impact from the situation in the Middle East and assumes exchange rates of USD 1.00 = ¥150 and EUR 1.00 = ¥180.
| Item | FY2026 Forecast | FY2025 (Actual) |
|---|---|---|
| Order Intake | 6,800.0 | 7,653.6 |
| Revenue | 5,400.0 | 4,974.1 |
| Profit from Business Activities (Margin) | 540.0 (10.0%) | 432.2 (8.7%) |
| Profit Attributable to Owners of Parent (Margin) | 380.0 (7.0%) | 332.1 (6.7%) |
| ROE | 12% | 12.2% |
| EBITDA (Margin) | 660.0 (12.2%) | 553.7 (11.1%) |
| Free Cash Flow | 300.0 | 893.4 |
| Dividends per Share | 29 yen (Interim 14, Year-End 15) | 25 yen (Interim 12, Year-End 13) |
| Segment | Metric | FY2026 Forecast | FY2025* |
|---|---|---|---|
| Energy Systems | Order Intake | 3,450.0 | 3,936.7 |
| Energy Systems | Revenue | 2,200.0 | 2,062.6 |
| Energy Systems | Profit from Business Activities | 340.0 | 267.2 |
| Plants & Infrastructure Systems | Order Intake | 1,000.0 | 1,158.0 |
| Plants & Infrastructure Systems | Revenue | 950.0 | 880.8 |
| Plants & Infrastructure Systems | Profit from Business Activities | 90.0 | 84.1 |
| Industrial Solutions | Order Intake | 750.0 | 704.7 |
| Industrial Solutions | Revenue | 750.0 | 699.9 |
| Industrial Solutions | Profit from Business Activities | 30.0 | -2.0 |
| Aircraft, Defense & Space | Order Intake | 1,650.0 | 1,929.4 |
| Aircraft, Defense & Space | Revenue | 1,500.0 | 1,393.8 |
| Aircraft, Defense & Space | Profit from Business Activities | 170.0 | 151.5 |
| Others, Corporate & Eliminations | Order Intake | -50.0 | -75.3 |
| Others, Corporate & Eliminations | Revenue | 0.0 | -63.1 |
| Others, Corporate & Eliminations | Profit from Business Activities | -90.0 | -68.5 |
| Total | Order Intake | 6,800.0 | 7,653.6 |
| Total | Revenue | 5,400.0 | 4,974.1 |
| Total | Profit from Business Activities | 540.0 | 432.2 |
*FY2025 results shown here are retroactively adjusted to reflect organizational changes effective April 1, 2026, including the renaming of the Logistics, Thermal & Drive Systems segment to Industrial Solutions.
Shareholder Returns
MHI is planning to increase the full-year dividend to ¥25 per share for FY2025, ¥2 higher than the FY2024 dividend and ¥1 higher than previous guidance of ¥24 per share, with DOE of 4.1%. For FY2026, MHI plans a full-year dividend of ¥29 per share (interim ¥14, year-end ¥15), ¥4 higher than the FY2025 dividend of ¥25 per share (interim ¥12, year-end ¥13).
Medium-Term Plan / Topics
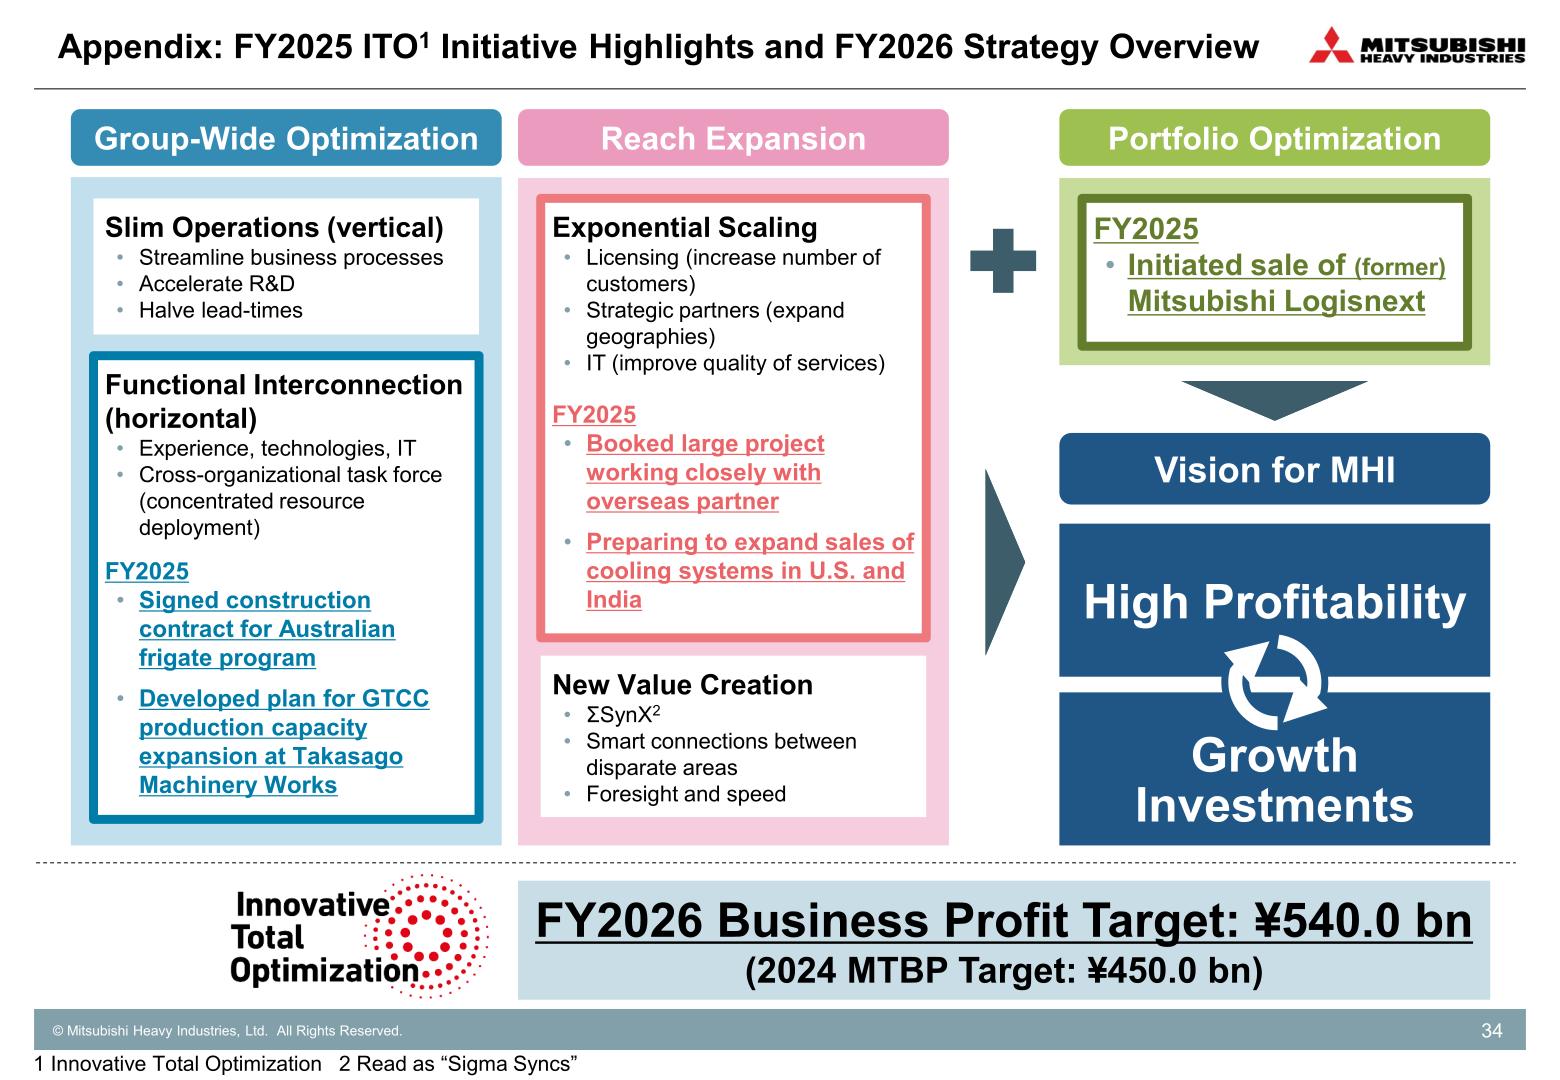
MHI’s FY2026 business profit target of ¥540.0 billion compares to the original 2024 Medium-Term Business Plan (MTBP) target of ¥450.0 billion. Under the 2024 MTBP initiatives, FY2025 topics included signing the construction contract for the Australian frigate program, developing a plan for GTCC production capacity expansion at Takasago Machinery Works, booking a large project with an overseas partner, and initiating the sale of the former Mitsubishi Logisnext business as part of portfolio optimization. MHI stated that cash inflows — primarily from growing core businesses — have been realized ahead of the initial 2024 MTBP expectations, with cash receipts expected to significantly exceed the plan; excess cash inflows are expected to be allocated from FY27 onward to working capital requirements and capacity expansion efforts, including GTCC.
This article is an analysis based on publicly available information and is not a recommendation to buy or sell any specific securities. Investment decisions are your own responsibility.
![[Obayashi] Investors’ Guide 2026 — The Complete 24-Article Breakdown](https://japan-equity.com/wp-content/uploads/2026/07/hub_cover-1024x1024.png)
![[Obayashi] IR & SR Policy — Feeding Dialogue Back into Management](https://japan-equity.com/wp-content/uploads/2026/07/p32_sq-1024x1024.jpg)
![[Obayashi] Real Estate Development — 18.7% Margin, ¥287.7bn Unrealized Gains](https://japan-equity.com/wp-content/uploads/2026/07/p20_sq-1024x1024.jpg)
![[Obayashi] Domestic Civil Engineering — Resilience Spending Supports 9.6% Margin](https://japan-equity.com/wp-content/uploads/2026/07/p11_sq-1024x1024.jpg)
![[Obayashi] Share Price & External Ratings — vs TOPIX, ESG Index Inclusion](https://japan-equity.com/wp-content/uploads/2026/07/p40_sq-1024x1024.jpg)
![[Construction] ¥75.5tn Investment, Shrinking Workforce — Big-5 Market Share](https://japan-equity.com/wp-content/uploads/2026/07/p12_sq-1024x1024.jpg)



![[Obayashi] Capital Policy & Shareholder Returns — ROE 10%+, DOE ~5%, ¥100bn Buyback](https://japan-equity.com/wp-content/uploads/2026/07/p27_sq-1024x1024.jpg)
![[Obayashi] Reducing Cross-Shareholdings — ¥285.2bn Sold in Five Years](https://japan-equity.com/wp-content/uploads/2026/07/p29_sq-1024x1024.jpg)
![[Obayashi] ¥750bn Investment Plan — ¥300bn to Development, ¥190bn to Tech/DX](https://japan-equity.com/wp-content/uploads/2026/07/p30_sq-1024x1024.jpg)
![[Obayashi] MTP2022 KPIs — Operating Profit ~2x Target, ROE 14.4%](https://japan-equity.com/wp-content/uploads/2026/07/p25_sq-1024x1024.jpg)
![[Obayashi] Cash Allocation — ¥420bn Investment CF Over Five Years](https://japan-equity.com/wp-content/uploads/2026/07/p26_sq-1024x1024.jpg)
![[Obayashi] Green Energy — 44 Plants, 344MW, and the Green Hydrogen Challenge](https://japan-equity.com/wp-content/uploads/2026/07/p21_sq-1024x1024.jpg)
![[Obayashi] Tackling the Labor Shortage — Robotics Construction®](https://japan-equity.com/wp-content/uploads/2026/07/p14_sq-1024x1024.jpg)
