
This article is based on publicly available IR materials and is not a recommendation to buy or sell any specific securities.
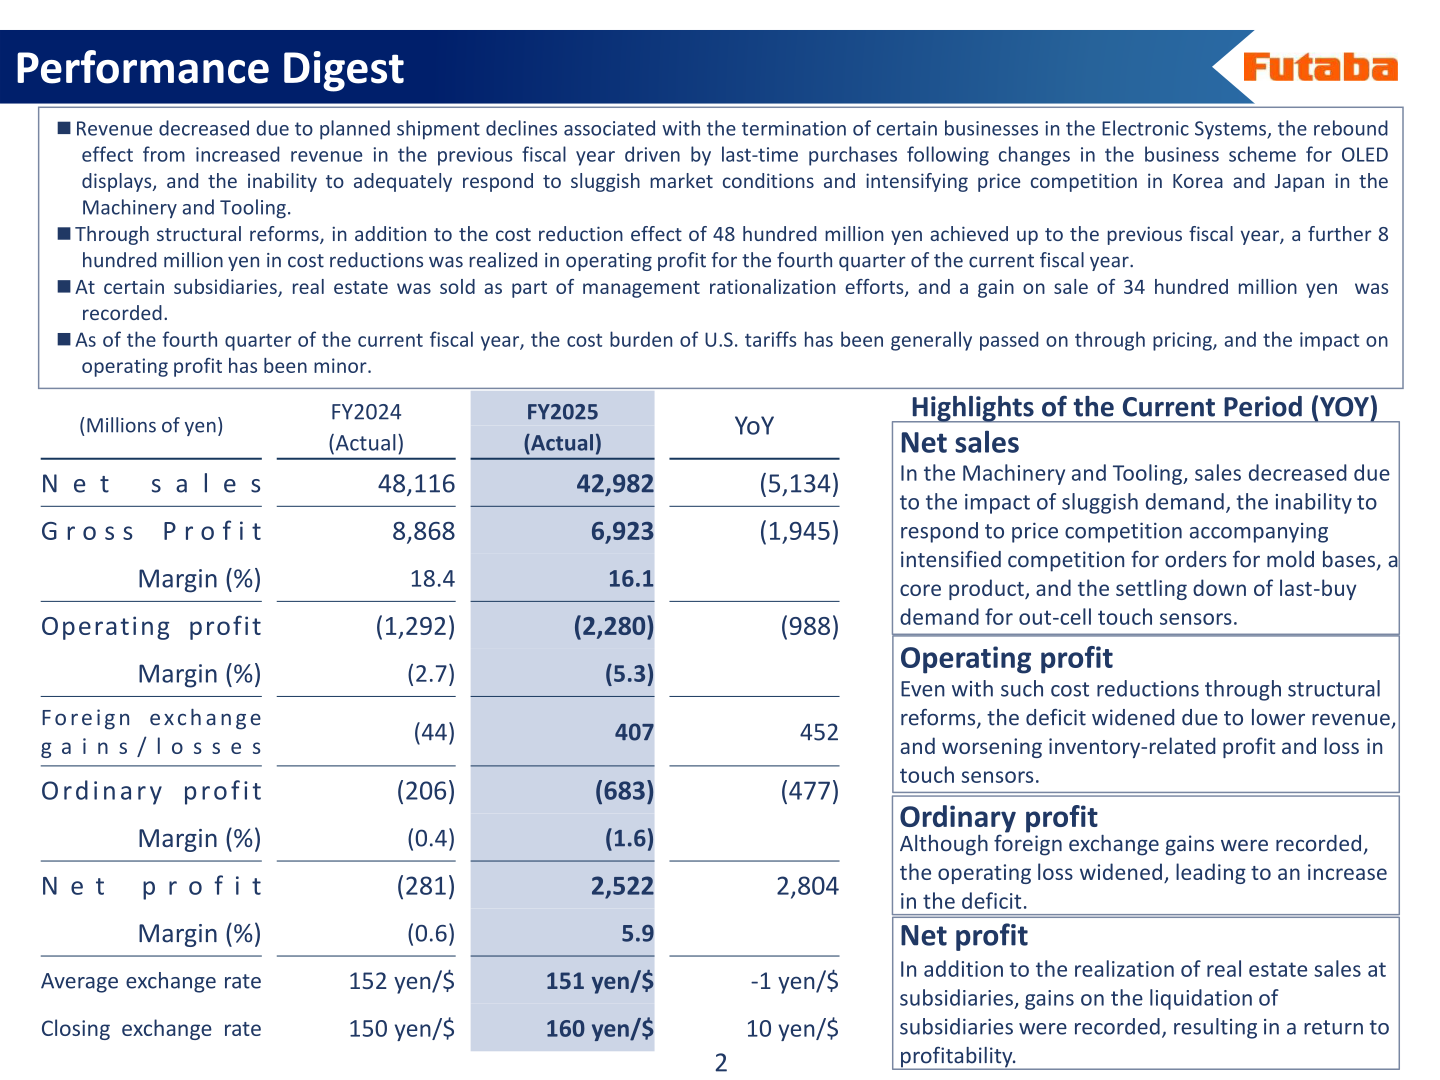
Futaba Corporation (6986) released its consolidated financial results presentation for the fiscal year ended March 31, 2026 (labeled FY2025 in the materials) on May 12, 2026. Net sales were 42,982 million yen, a decrease of 5,134 million yen year on year, and the operating loss widened to (2,280) million yen. The ordinary loss came to (683) million yen, while net profit was 2,522 million yen, a return to profitability driven by the realization of real estate sales at subsidiaries and gains on the liquidation of subsidiaries.
Consolidated Results (Full-Year Actual)
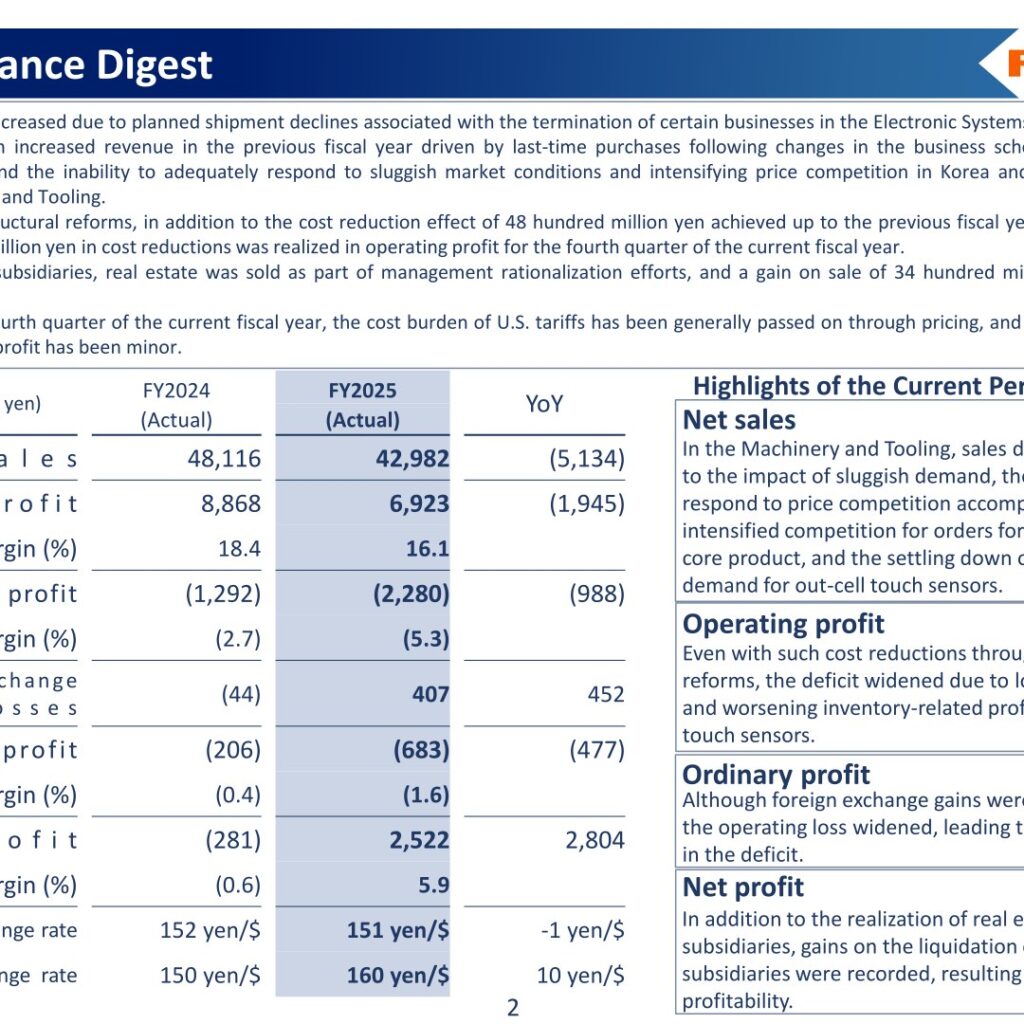
Revenue decreased due to planned shipment declines associated with the termination of certain businesses in the Electronic Systems, the rebound effect from increased revenue in the previous fiscal year driven by last-time purchases following changes in the business scheme for OLED displays, and the inability to adequately respond to sluggish market conditions and intensifying price competition in Korea and Japan in the Machinery and Tooling. Through structural reforms, in addition to the cost reduction effect of 48 hundred million yen achieved up to the previous fiscal year, a further 8 hundred million yen in cost reductions was realized in operating profit for the fourth quarter. At certain subsidiaries, real estate was sold as part of management rationalization efforts, and a gain on sale of 34 hundred million yen was recorded. The company also notes that, as of the fourth quarter, the cost burden of U.S. tariffs has been generally passed on through pricing, and the impact on operating profit has been minor.
| Item (Millions of yen) | FY2024 (Actual) | FY2025 (Actual) | YoY |
|---|---|---|---|
| Net sales | 48,116 | 42,982 | (5,134) |
| Gross profit | 8,868 | 6,923 | (1,945) |
| Operating profit | (1,292) | (2,280) | (988) |
| Foreign exchange gains/losses | (44) | 407 | 452 |
| Ordinary profit | (206) | (683) | (477) |
| Net profit | (281) | 2,522 | 2,804 |
The average exchange rate was 151 yen/$ (FY2024: 152 yen/$) and the closing exchange rate was 160 yen/$ (FY2024: 150 yen/$).
Segment Results
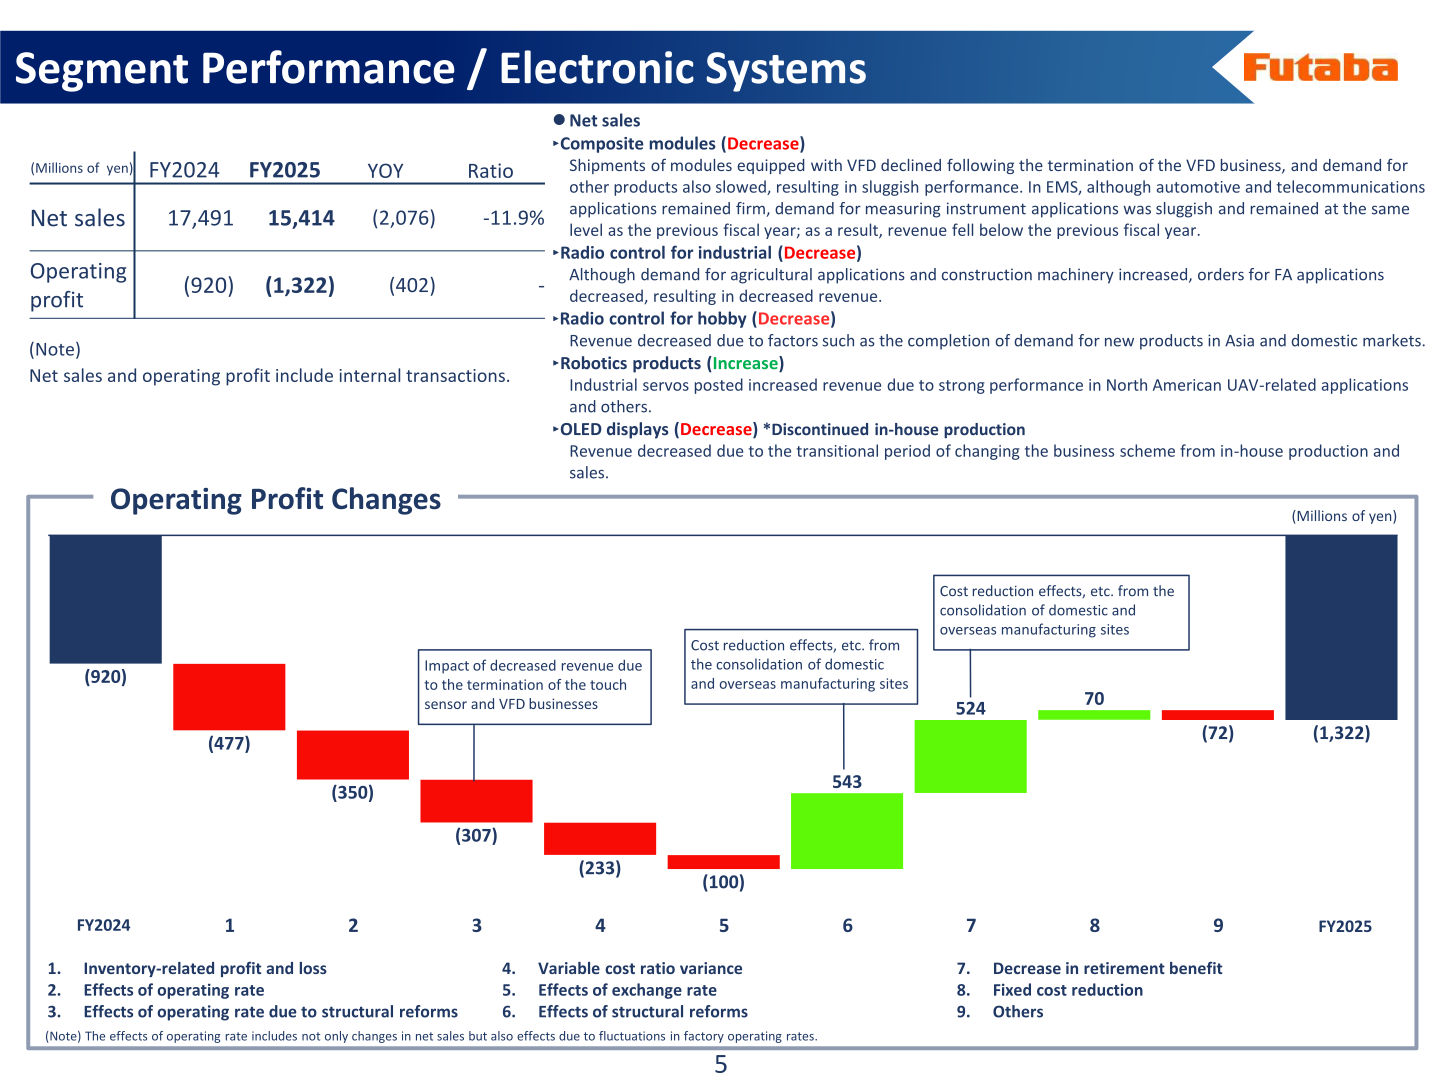
In the Electronic Systems segment, net sales were 15,414 million yen, down 2,076 million yen (-11.9%) year on year, and the operating loss widened to (1,322) million yen from (920) million yen. Composite modules, radio control for hobby, and OLED displays (for which in-house production was discontinued) posted lower revenue, while robotics products increased on strong performance in North American UAV-related applications. By market region (on a basis excluding internal transactions), Electronic Systems sales declined in Japan on the stabilization of last-buy orders for out-cell touch sensors and decreased customer demand for EMS, whereas the Americas and Europe increased due to higher EMS orders in the Americas; the segment’s overseas sales ratio rose by +6.3 points from 52.3% to 58.6%.
| Segment (Millions of yen) | Item | FY2024 | FY2025 | YoY |
|---|---|---|---|---|
| Electronic Systems | Net sales | 17,491 | 15,414 | (2,076) |
| Electronic Systems | Operating profit | (920) | (1,322) | (402) |
| Machinery and Tooling | Net sales | 30,645 | 27,596 | (3,049) |
| Machinery and Tooling | Operating profit | (371) | (959) | (587) |
Note: Segment net sales and operating profit include internal transactions. In the Machinery and Tooling segment, net sales were 27,596 million yen, down 3,049 million yen (-10.0%), with an operating loss of (959) million yen. Domestic revenue decreased because sales of mold-related equipment and plate products remained sluggish, mainly due to the delayed recovery of automotive-related market conditions and the impact of price competition, although molding and production rationalization equipment, including in-mold measuring systems, grew. Overseas, revenue decreased due to sluggish demand for automobiles and home appliances in the main Korean market, increased imports of low-priced Chinese products, price competition, and planned sales declines resulting from the reorganization of production bases in China; the segment’s overseas sales ratio decreased by 1.1 points to 55.7%.
On the balance sheet, total assets stood at 108,884 million yen, up 7,793 million yen from FY2024. Cash and deposits increased by 4,903 million yen to 36,189 million yen due to the implementation of inventory optimization policies and the sale of real estates, while inventories decreased by (1,985) million yen to 11,981 million yen. The equity ratio was 77.0% (FY2024: 76.3%) and net assets per share were 1,975.55 yen (FY2024: 1,819.33 yen).
FY2026 Forecast
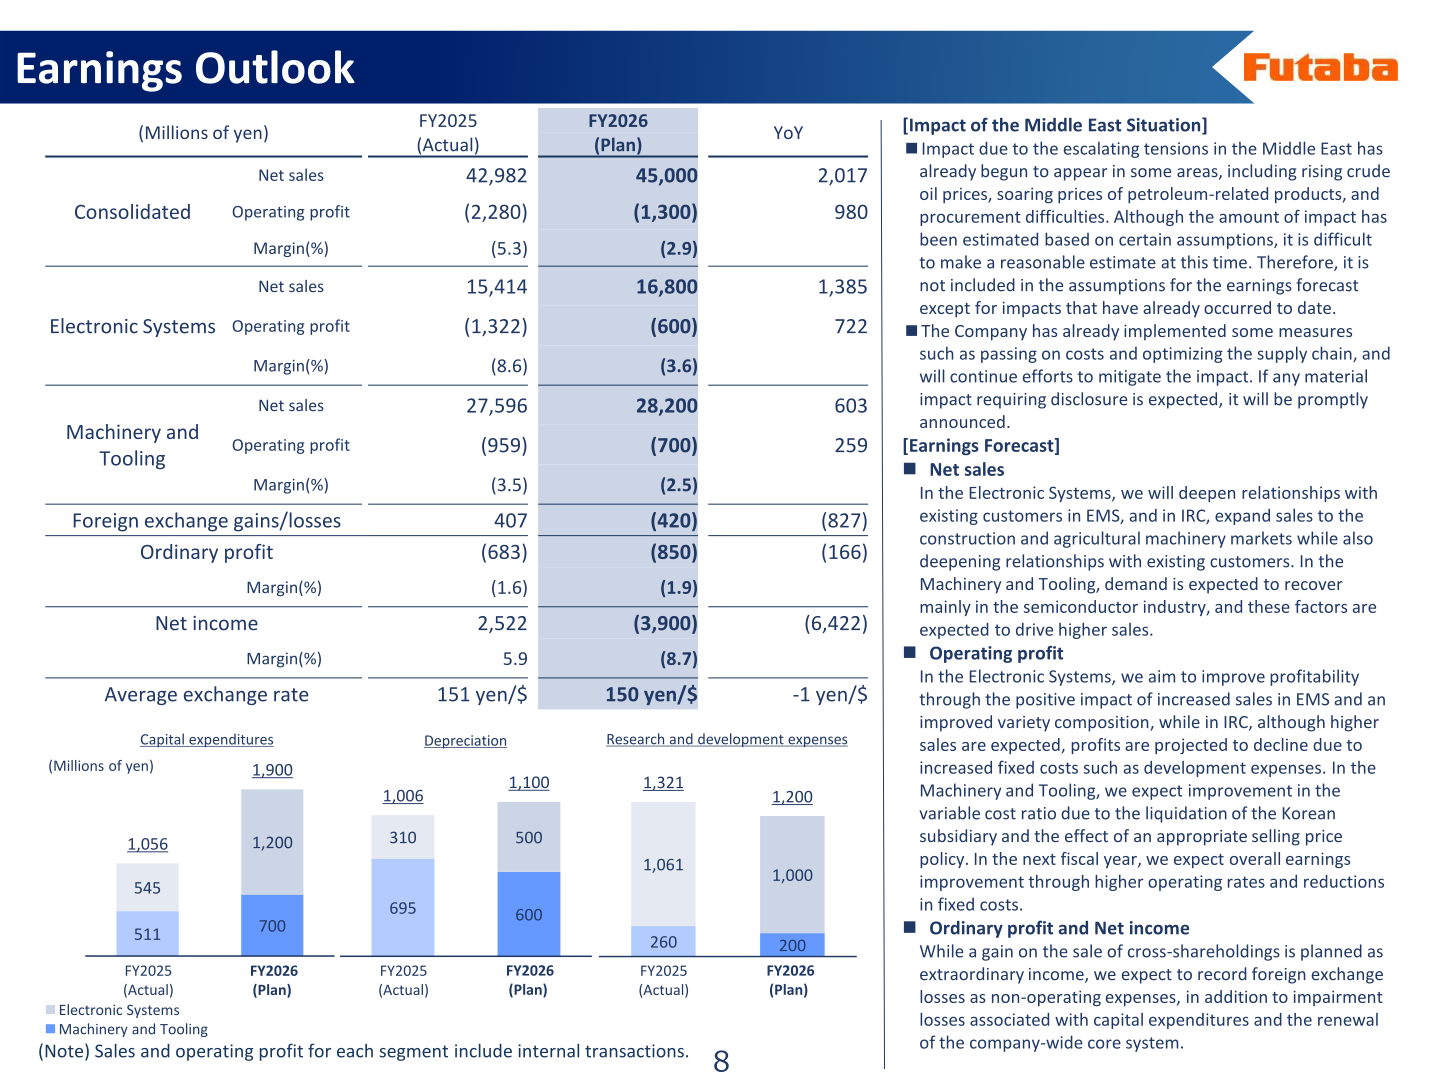
For FY2026, the company plans net sales of 45,000 million yen (up 2,017 million yen year on year) and an operating loss of (1,300) million yen (an improvement of 980 million yen). In the Electronic Systems, the company will deepen relationships with existing customers in EMS and expand industrial radio control sales to the construction and agricultural machinery markets; in the Machinery and Tooling, demand is expected to recover mainly in the semiconductor industry. At the bottom line, a net loss of (3,900) million yen is planned: while a gain on the sale of cross-shareholdings is planned as extraordinary income, the company expects to record foreign exchange losses as non-operating expenses, in addition to impairment losses associated with capital expenditures and the renewal of the company-wide core system. The impact of the escalating tensions in the Middle East is not included in the assumptions for the earnings forecast except for impacts that have already occurred to date. Capital expenditures are planned at 1,900 million yen (FY2025 actual: 1,056 million yen), depreciation at 1,100 million yen (1,006 million yen), and research and development expenses at 1,200 million yen (1,321 million yen).
| Item (Millions of yen) | FY2025 (Actual) | FY2026 (Plan) | YoY |
|---|---|---|---|
| Net sales | 42,982 | 45,000 | 2,017 |
| Operating profit | (2,280) | (1,300) | 980 |
| Foreign exchange gains/losses | 407 | (420) | (827) |
| Ordinary profit | (683) | (850) | (166) |
| Net income | 2,522 | (3,900) | (6,422) |
Shareholder Returns
The presentation does not include a dividend table, and specific dividend figures cannot be confirmed from the materials. On capital policy, the company states that it promoted the sale of idle real estate while also planning to reduce cross-shareholdings, using the obtained funds for growth investments and shareholder returns to improve capital efficiency. For FY2026, a gain on the sale of cross-shareholdings is planned as extraordinary income.
Medium-Term Plan / Topics
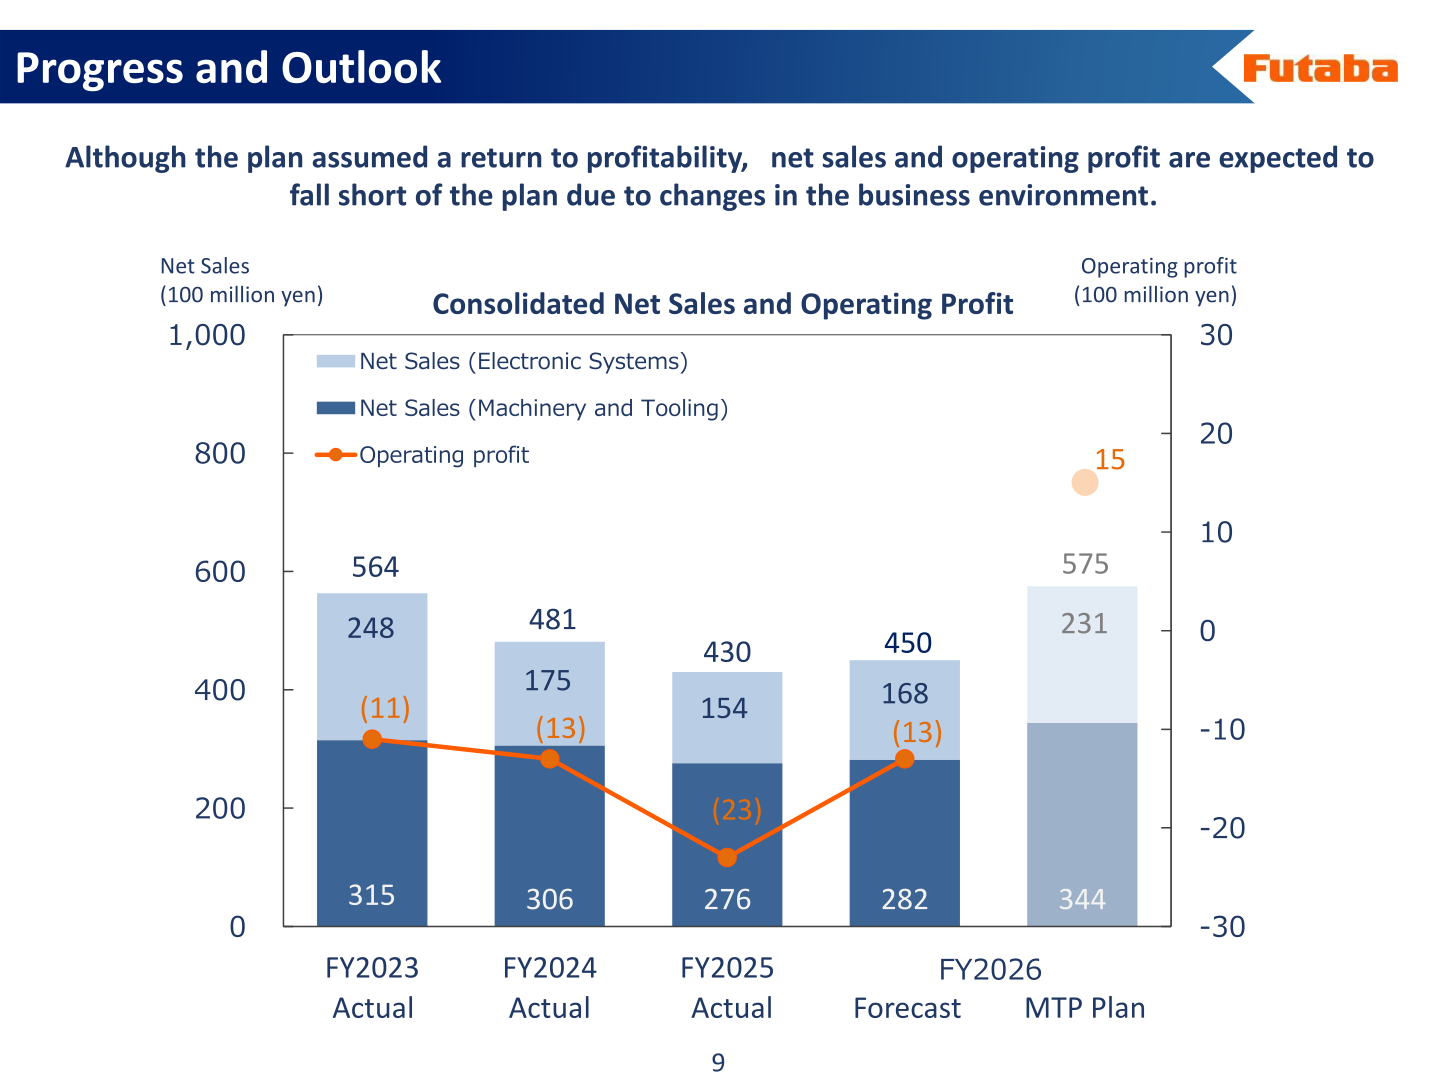
On the medium-term business policy, structural reforms were implemented as planned, achieving cost reductions of 56 hundred million yen compared to FY2023. Nevertheless, although the plan assumed a return to profitability, net sales and operating profit are expected to fall short of the plan due to changes in the business environment: against the medium-term plan of 575 hundred million yen in net sales and 15 hundred million yen in operating profit for FY2026, the company forecasts 450 hundred million yen in net sales and an operating loss of (13) hundred million yen. In Korea, operations at WONJIN PRECISION Co., LTD., a subsidiary manufacturing and selling mold bases, will be discontinued in January 2026 and consolidated into KISHIN Corporation and KISHIN MEGATEC Co., Ltd., while the liquidation of FUTABA ELECTRONICS COMPONENTS KOREA Co., Ltd. is scheduled for June 2026; this restructuring is expected to improve the medium-term operating profit margin and enhance cash flow generation. The company is also considering a renewal of the company-wide core system based on Fit-to-Standard, with a decision scheduled for the first quarter of FY2026. Industrial radio control, robotics, and molding/production rationalization equipment have been positioned as growth drivers, and the company describes FY2026 as a turning point, aiming for medium-to-long term profit growth and improved capital efficiency.
This article is an analysis based on publicly available information and is not a recommendation to buy or sell any specific securities. Investment decisions are your own responsibility.
![[Obayashi] Investors’ Guide 2026 — The Complete 24-Article Breakdown](https://japan-equity.com/wp-content/uploads/2026/07/hub_cover-1024x1024.png)
![[Obayashi] IR & SR Policy — Feeding Dialogue Back into Management](https://japan-equity.com/wp-content/uploads/2026/07/p32_sq-1024x1024.jpg)
![[Obayashi] Real Estate Development — 18.7% Margin, ¥287.7bn Unrealized Gains](https://japan-equity.com/wp-content/uploads/2026/07/p20_sq-1024x1024.jpg)
![[Obayashi] Domestic Civil Engineering — Resilience Spending Supports 9.6% Margin](https://japan-equity.com/wp-content/uploads/2026/07/p11_sq-1024x1024.jpg)
![[Obayashi] Share Price & External Ratings — vs TOPIX, ESG Index Inclusion](https://japan-equity.com/wp-content/uploads/2026/07/p40_sq-1024x1024.jpg)
![[Construction] ¥75.5tn Investment, Shrinking Workforce — Big-5 Market Share](https://japan-equity.com/wp-content/uploads/2026/07/p12_sq-1024x1024.jpg)



![[Obayashi] Capital Policy & Shareholder Returns — ROE 10%+, DOE ~5%, ¥100bn Buyback](https://japan-equity.com/wp-content/uploads/2026/07/p27_sq-1024x1024.jpg)
![[Obayashi] Reducing Cross-Shareholdings — ¥285.2bn Sold in Five Years](https://japan-equity.com/wp-content/uploads/2026/07/p29_sq-1024x1024.jpg)
![[Obayashi] ¥750bn Investment Plan — ¥300bn to Development, ¥190bn to Tech/DX](https://japan-equity.com/wp-content/uploads/2026/07/p30_sq-1024x1024.jpg)
![[Obayashi] MTP2022 KPIs — Operating Profit ~2x Target, ROE 14.4%](https://japan-equity.com/wp-content/uploads/2026/07/p25_sq-1024x1024.jpg)
![[Obayashi] Cash Allocation — ¥420bn Investment CF Over Five Years](https://japan-equity.com/wp-content/uploads/2026/07/p26_sq-1024x1024.jpg)
![[Obayashi] Green Energy — 44 Plants, 344MW, and the Green Hydrogen Challenge](https://japan-equity.com/wp-content/uploads/2026/07/p21_sq-1024x1024.jpg)
![[Obayashi] Tackling the Labor Shortage — Robotics Construction®](https://japan-equity.com/wp-content/uploads/2026/07/p14_sq-1024x1024.jpg)
