
This article is based on publicly available IR materials and is not a recommendation to buy or sell any specific securities.
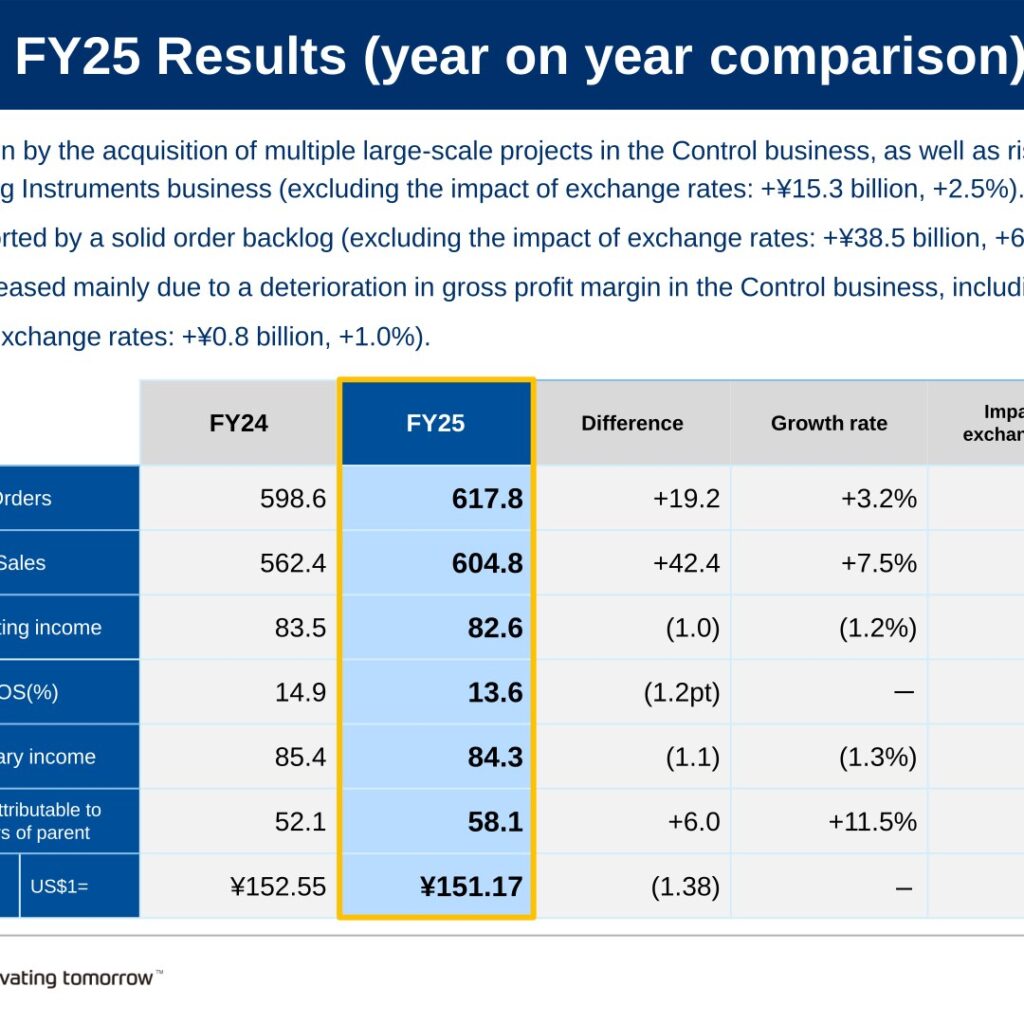
Yokogawa Electric Corporation’s fiscal year 2025 (FY25) covers April 1, 2025 to March 31, 2026. For FY25, the company reported consolidated orders of ¥617.8 billion (+3.2% year on year), sales of ¥604.8 billion (+7.5%), operating income of ¥82.6 billion (-1.2%) and profit attributable to owners of parent of ¥58.1 billion (+11.5%). Orders were driven by multiple large-scale projects in the Control business and rising AI data center-related demand in the Measuring Instruments business, sales were supported by a solid order backlog, and operating income decreased mainly due to a deterioration in gross profit margin in the Control business, including one-time factors. For FY26 the company forecasts orders of ¥645.0 billion, sales of ¥615.0 billion and operating income of ¥85.0 billion, and plans a fourth consecutive dividend increase (FY25 annual dividend ¥78; FY26 forecast ¥92) together with share repurchases of up to ¥30.0 billion.
Consolidated Results (Full-Year Actual)
Orders increased by ¥19.2 billion (+3.2%) to ¥617.8 billion, driven by the acquisition of multiple large-scale projects in the Control business as well as rising demand related to AI data centers in the Measuring Instruments business (excluding the impact of exchange rates: +¥15.3 billion, +2.5%). Sales increased by ¥42.4 billion (+7.5%) to ¥604.8 billion, supported by a solid order backlog (excluding the impact of exchange rates: +¥38.5 billion, +6.8%). Operating income decreased by ¥1.0 billion (-1.2%) to ¥82.6 billion, mainly due to a deterioration in gross profit margin in the Control business, including one-time factors (excluding the impact of exchange rates: +¥0.8 billion, +1.0%); ROS was 13.6%, down 1.2pt. Ordinary income was ¥84.3 billion (-1.3%) and profit attributable to owners of parent was ¥58.1 billion (+11.5%). The average exchange rate was US$1 = ¥151.17 (FY24: ¥152.55).
| Item (Billion ¥) | FY24 | FY25 | Difference | Growth rate | Impact of exchange rate |
|---|---|---|---|---|---|
| Orders | 598.6 | 617.8 | +19.2 | +3.2% | +4.0 |
| Sales | 562.4 | 604.8 | +42.4 | +7.5% | +3.9 |
| Operating income | 83.5 | 82.6 | (1.0) | (1.2%) | (1.8) |
| ROS (%) | 14.9 | 13.6 | (1.2pt) | - | - |
| Ordinary income | 85.4 | 84.3 | (1.1) | (1.3%) | (1.5) |
| Profit attributable to owners of parent | 52.1 | 58.1 | +6.0 | +11.5% | (1.5) |
| Exchange rate (US$1=) | ¥152.55 | ¥151.17 | (1.38) | - | - |
In the year-on-year analysis of operating income, the increase in gross profit from higher sales (excluding the impact of exchange rates) contributed +¥18.3 billion, while a lower gross margin reduced operating income by ¥9.5 billion, an increase in SG&A by ¥8.0 billion and exchange rates by ¥1.8 billion. The company cites, among the factors behind the lower gross margin, a provision for construction losses associated with the receipt of strategic projects, a change of sales distribution ratio (decrease of product ratio), deterioration of sales prices due to the slowdown in the Chinese economy, deterioration in profitability of specific projects and costs associated with the completion of the transfer of the Aviation Equipment Business; SG&A rose on higher labor costs and upfront investments, including the recruitment of consultants and subject matter experts. On a non-operating basis, non-operating income was ¥5.6 billion (FY24: ¥7.0 billion), non-operating expenses ¥3.9 billion (¥5.2 billion), extraordinary income ¥1.1 billion (¥3.6 billion) and extraordinary expenses ¥6.4 billion (¥10.4 billion); income before tax was ¥78.9 billion (¥78.5 billion) and the effective tax rate 22.8% (29.7%). Operating cash flow was ¥86.0 billion (FY24: ¥99.0 billion) and free cash flow ¥52.8 billion (¥70.4 billion). ROE was 11.8% (FY24: 11.5%) and the shareholders’ equity ratio 65.4% (65.1%).
Segment Results
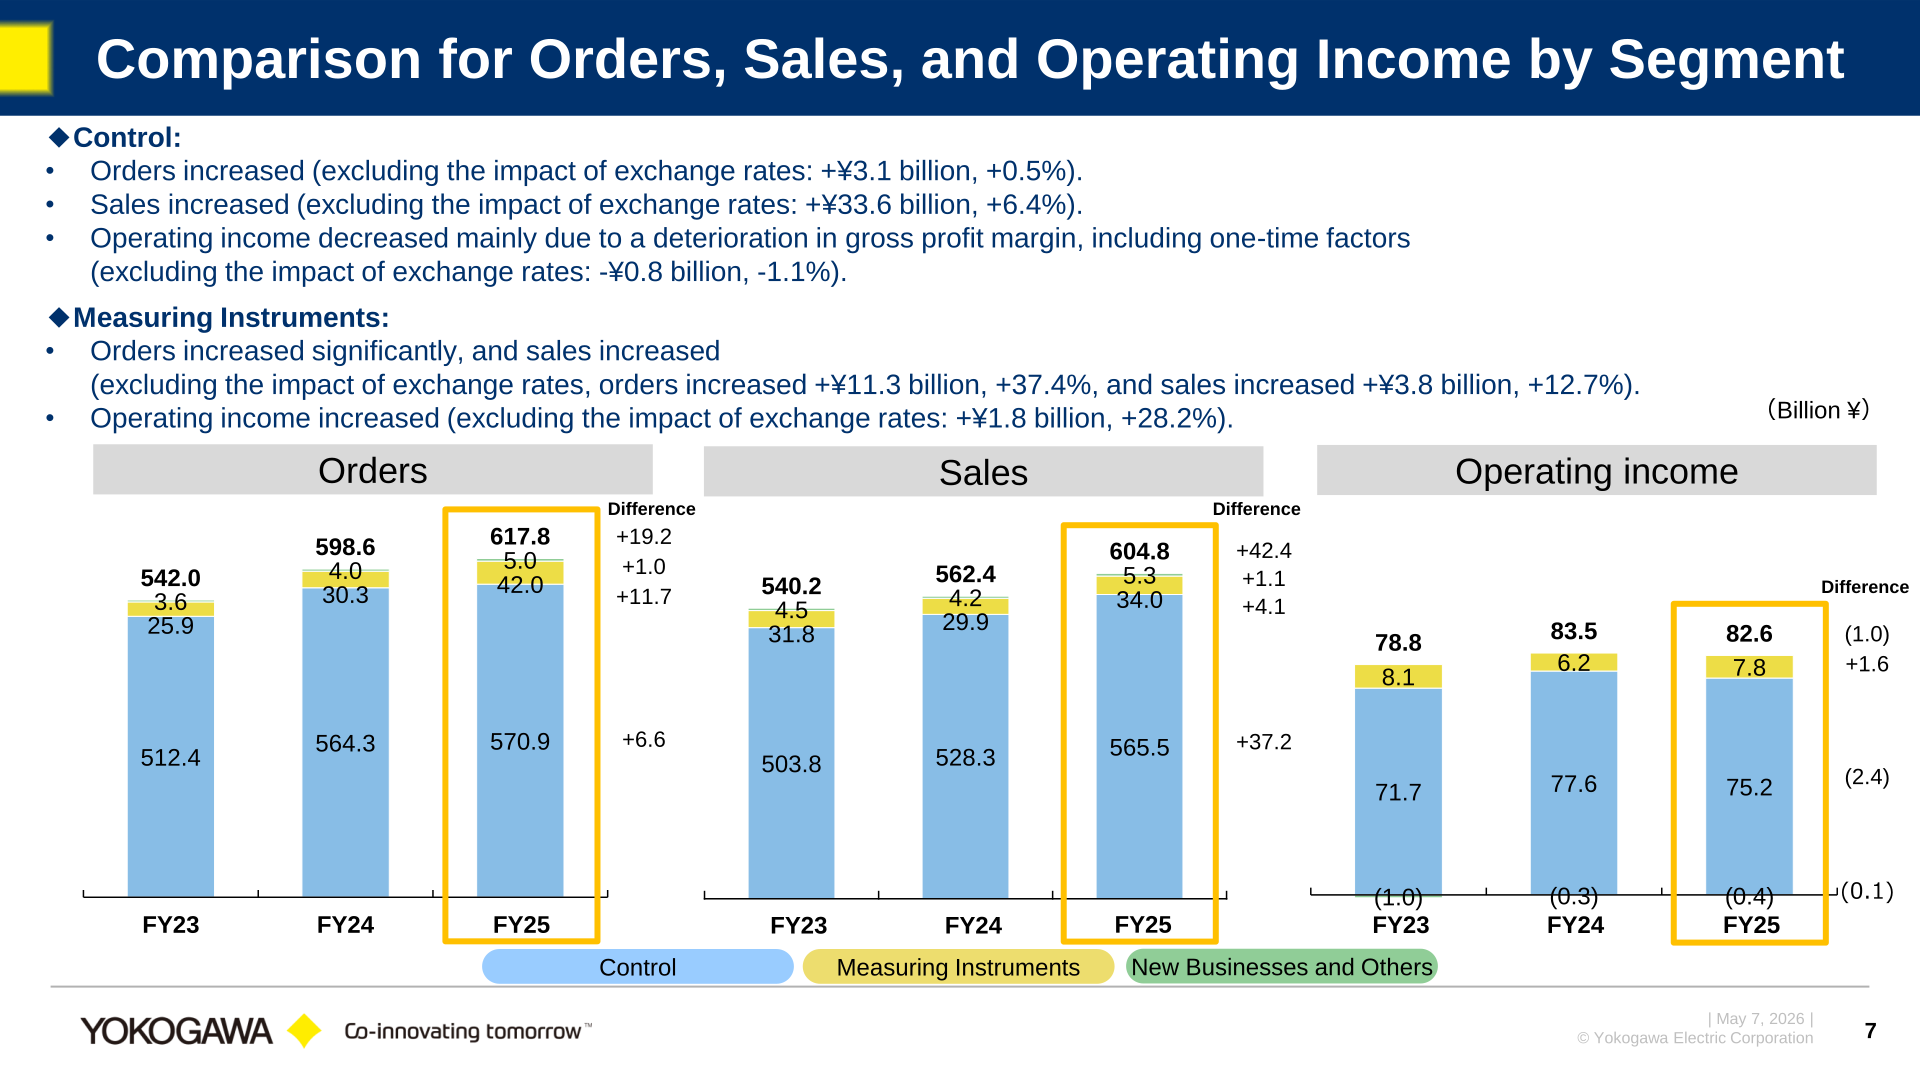
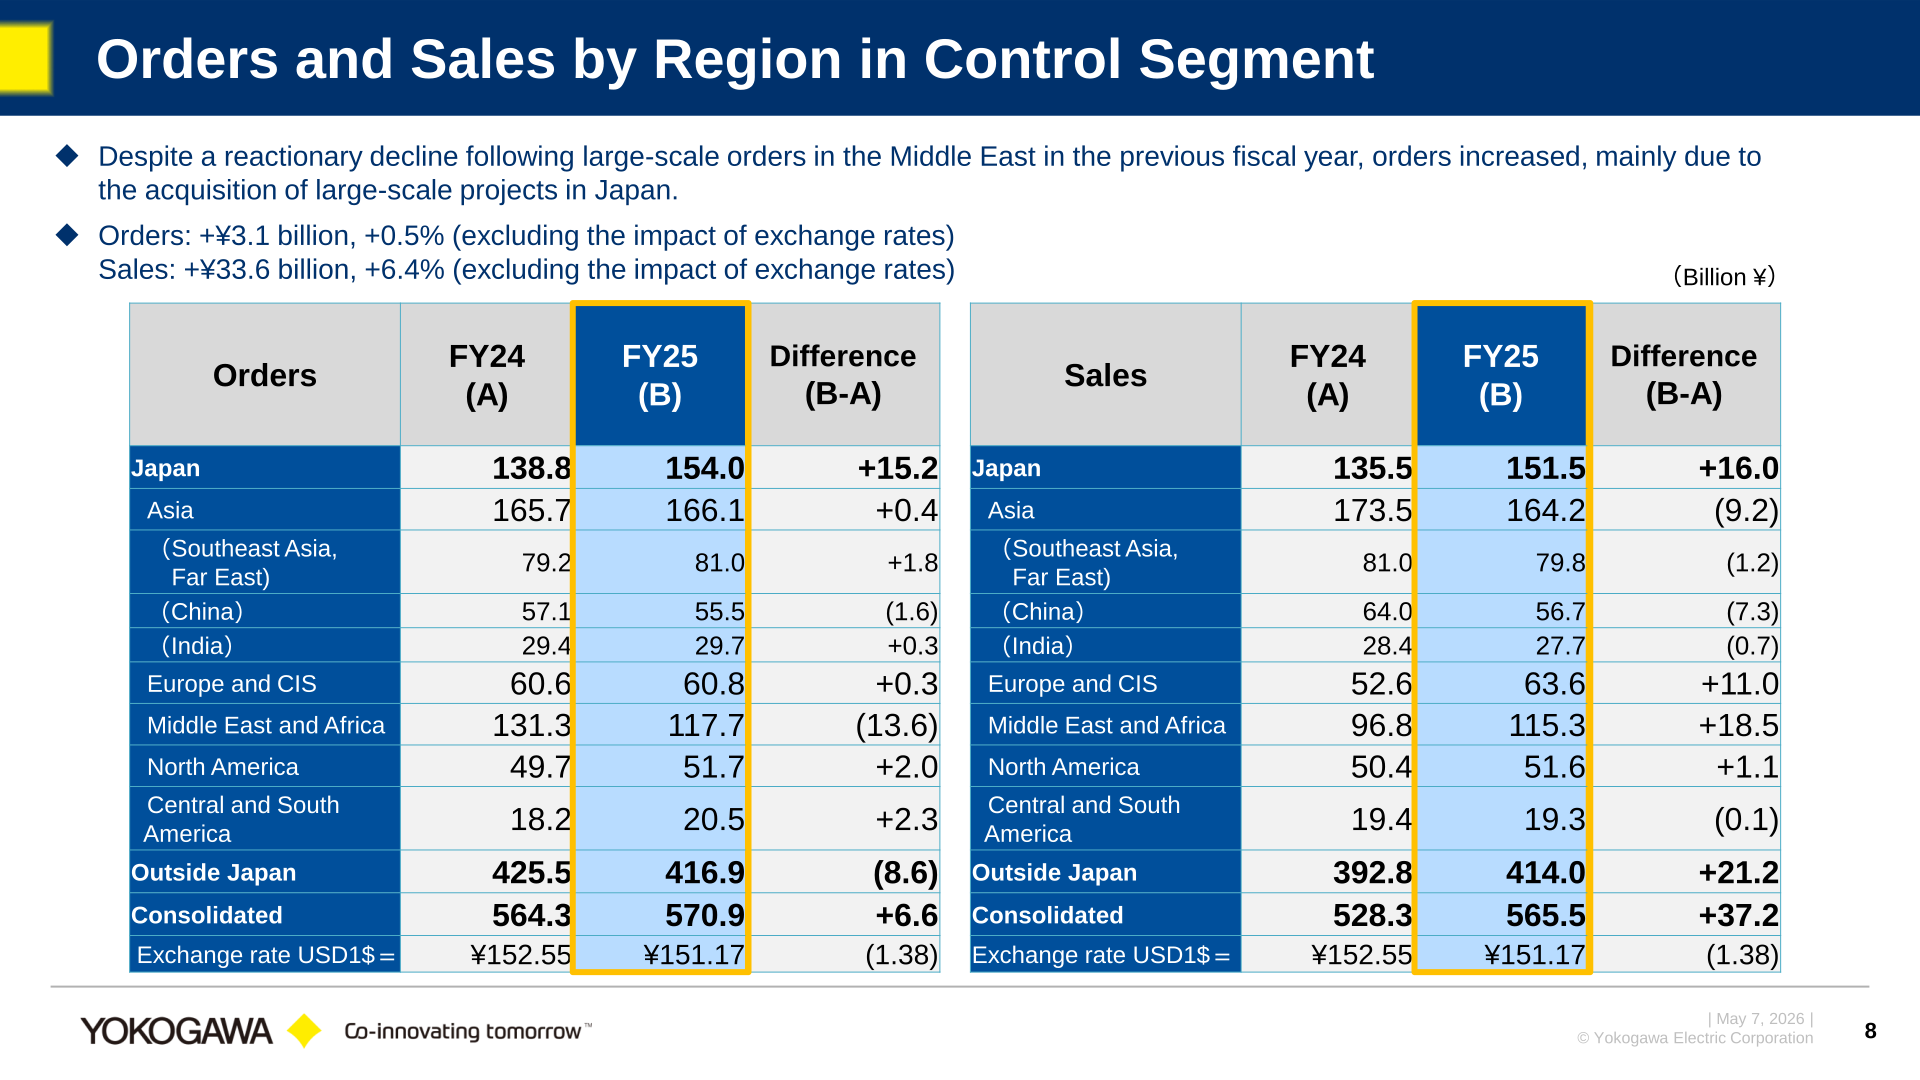
In the Control segment, orders increased ¥6.6 billion to ¥570.9 billion (excluding the impact of exchange rates: +¥3.1 billion, +0.5%), sales increased ¥37.2 billion to ¥565.5 billion (excluding the impact of exchange rates: +¥33.6 billion, +6.4%) and operating income decreased ¥2.4 billion to ¥75.2 billion, mainly due to a deterioration in gross profit margin, including one-time factors (excluding the impact of exchange rates: -¥0.8 billion, -1.1%). By region, Control orders rose in Japan (+¥15.2 billion to ¥154.0 billion), mainly due to the acquisition of large-scale projects, while the Middle East and Africa declined ¥13.6 billion to ¥117.7 billion, a reactionary decline following large-scale orders in the previous fiscal year; Control sales rose in the Middle East and Africa (+¥18.5 billion to ¥115.3 billion), Japan (+¥16.0 billion to ¥151.5 billion) and Europe and CIS (+¥11.0 billion to ¥63.6 billion), while Asia fell ¥9.2 billion to ¥164.2 billion. By Control subsegment, Energy & Sustainability orders were ¥325.8 billion (+¥7.8 billion, +2.5%), Materials ¥195.2 billion ((4.9), (2.5%)) and Life ¥49.9 billion (+¥3.7 billion, +8.1%); sales were Energy & Sustainability ¥314.8 billion (+¥34.9 billion, +12.4%), Materials ¥201.8 billion (+¥0.7 billion, +0.3%) and Life ¥48.9 billion (+¥1.7 billion, +3.6%). In the Measuring Instruments segment, orders increased significantly and sales increased (excluding the impact of exchange rates, orders +¥11.3 billion, +37.4%, and sales +¥3.8 billion, +12.7%), and operating income increased (excluding the impact of exchange rates: +¥1.8 billion, +28.2%). New Businesses and Others posted a steady year-on-year performance. The order backlog at the end of FY25 was ¥466.2 billion (FY24: ¥428.2 billion).
| Segment (Billion ¥) | Metric | FY24 | FY25 | Difference |
|---|---|---|---|---|
| Control | Orders | 564.3 | 570.9 | +6.6 |
| Control | Sales | 528.3 | 565.5 | +37.2 |
| Control | Operating income | 77.6 | 75.2 | (2.4) |
| Measuring Instruments | Orders | 30.3 | 42.0 | +11.7 |
| Measuring Instruments | Sales | 29.9 | 34.0 | +4.1 |
| Measuring Instruments | Operating income | 6.2 | 7.8 | +1.6 |
| New Businesses and Others | Orders | 4.0 | 5.0 | +1.0 |
| New Businesses and Others | Sales | 4.2 | 5.3 | +1.1 |
| New Businesses and Others | Operating income | (0.3) | (0.4) | (0.1) |
| Consolidated | Orders | 598.6 | 617.8 | +19.2 |
| Consolidated | Sales | 562.4 | 604.8 | +42.4 |
| Consolidated | Operating income | 83.5 | 82.6 | (1.0) |
FY26 Forecast
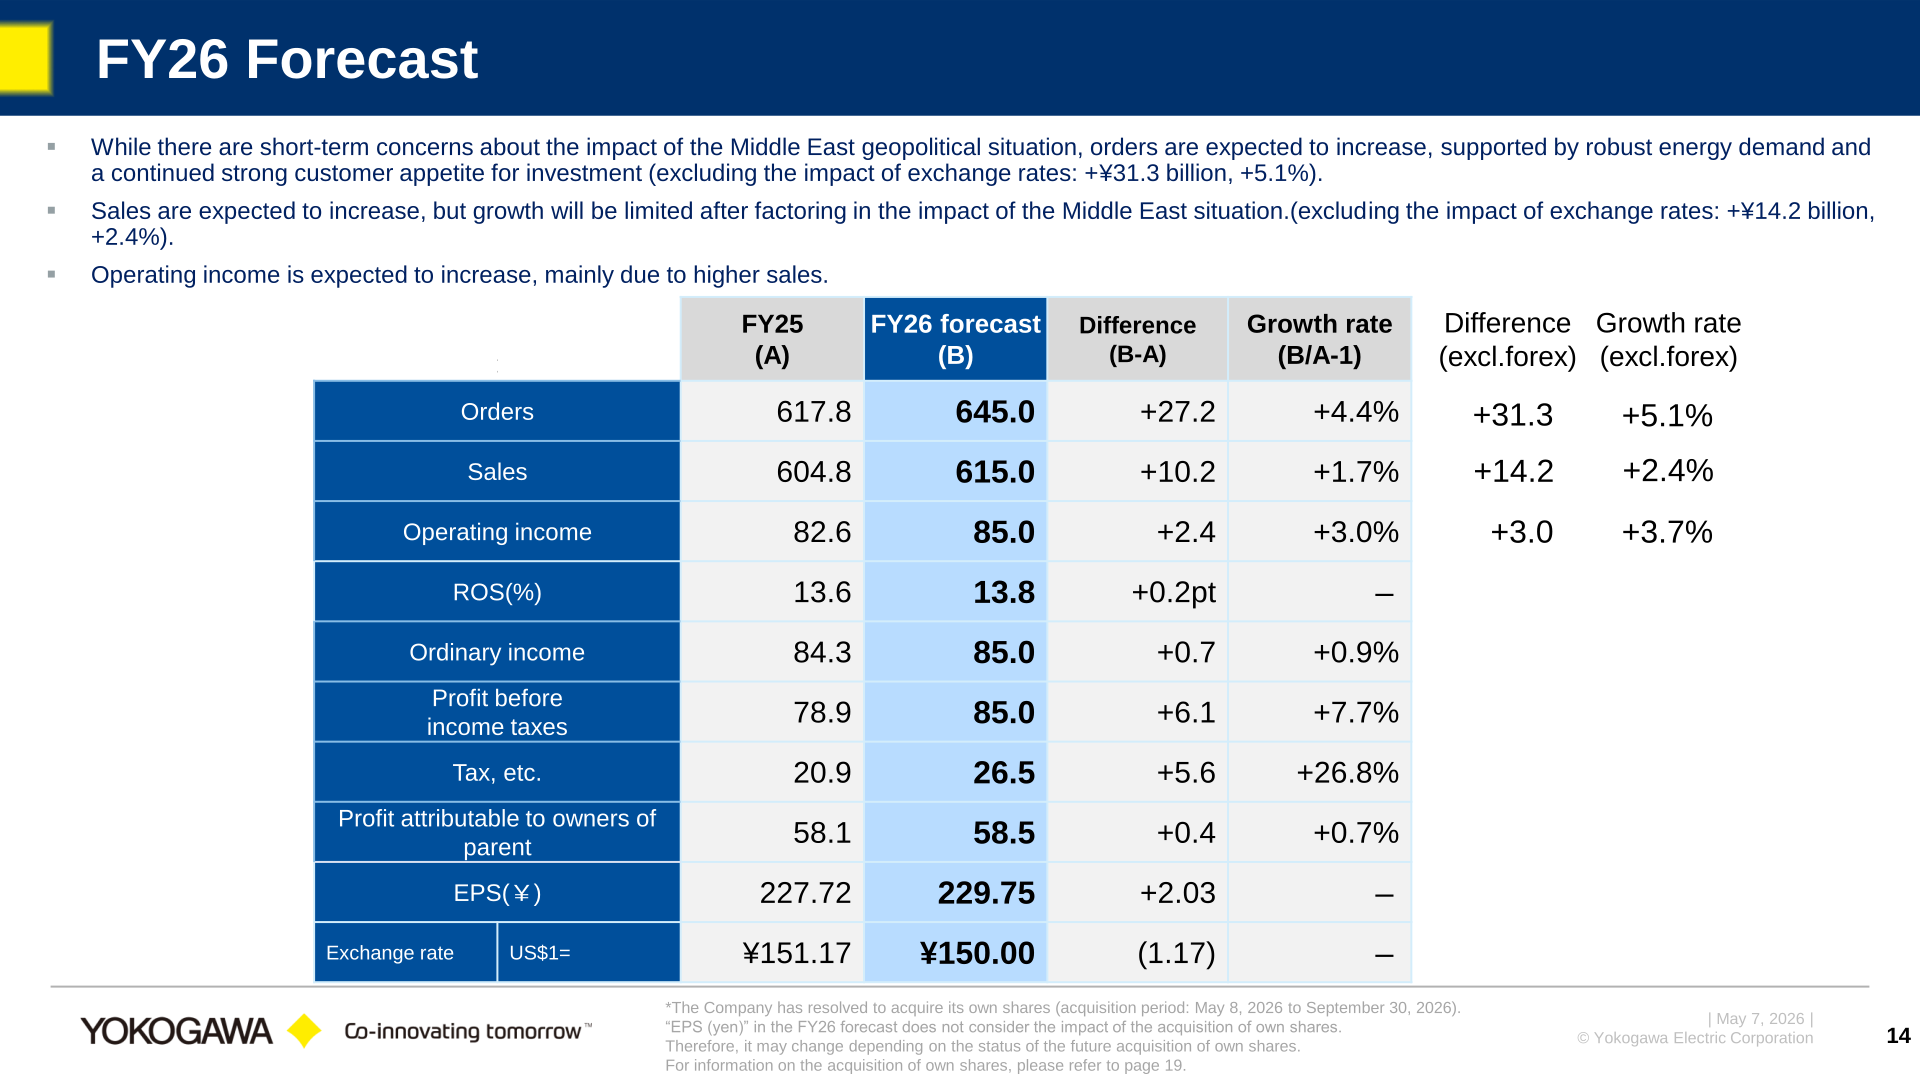
For FY26, the company forecasts orders of ¥645.0 billion (+¥27.2 billion, +4.4%), sales of ¥615.0 billion (+¥10.2 billion, +1.7%), operating income of ¥85.0 billion (+¥2.4 billion, +3.0%), ROS of 13.8% (+0.2pt), ordinary income of ¥85.0 billion (+¥0.7 billion, +0.9%) and profit attributable to owners of parent of ¥58.5 billion (+¥0.4 billion, +0.7%), on an assumed exchange rate of US$1 = ¥150.00. While there are short-term concerns about the impact of the Middle East geopolitical situation, orders are expected to increase, supported by robust energy demand and a continued strong customer appetite for investment (excluding the impact of exchange rates: +¥31.3 billion, +5.1%). Sales are expected to increase, but growth will be limited after factoring in the impact of the Middle East situation (excluding the impact of exchange rates: +¥14.2 billion, +2.4%). Operating income is expected to increase, mainly due to higher sales: the increase in gross profit from higher sales (excluding the impact of exchange rates) is expected to add +¥6.5 billion and gross margin improvement +¥5.0 billion, against an increase in SG&A of ¥8.5 billion and an exchange rate impact of ¥0.6 billion. By segment, Control orders are forecast at ¥603.0 billion (+¥32.1 billion), sales at ¥573.0 billion (+¥7.5 billion) and operating income at ¥76.5 billion (+¥1.3 billion); Measuring Instruments orders at ¥39.0 billion ((3.0)), sales at ¥39.0 billion (+¥5.0 billion) and operating income at ¥9.0 billion (+¥1.2 billion). The company notes that the FY26 EPS forecast of ¥229.75 does not consider the impact of the planned acquisition of own shares.
| Item (Billion ¥) | FY25 (A) | FY26 forecast (B) | Difference (B-A) | Growth rate (B/A-1) |
|---|---|---|---|---|
| Orders | 617.8 | 645.0 | +27.2 | +4.4% |
| Sales | 604.8 | 615.0 | +10.2 | +1.7% |
| Operating income | 82.6 | 85.0 | +2.4 | +3.0% |
| ROS (%) | 13.6 | 13.8 | +0.2pt | - |
| Ordinary income | 84.3 | 85.0 | +0.7 | +0.9% |
| Profit before income taxes | 78.9 | 85.0 | +6.1 | +7.7% |
| Tax, etc. | 20.9 | 26.5 | +5.6 | +26.8% |
| Profit attributable to owners of parent | 58.1 | 58.5 | +0.4 | +0.7% |
| EPS (¥) | 227.72 | 229.75 | +2.03 | - |
| Exchange rate (US$1=) | ¥151.17 | ¥150.00 | (1.17) | - |
Shareholder Returns
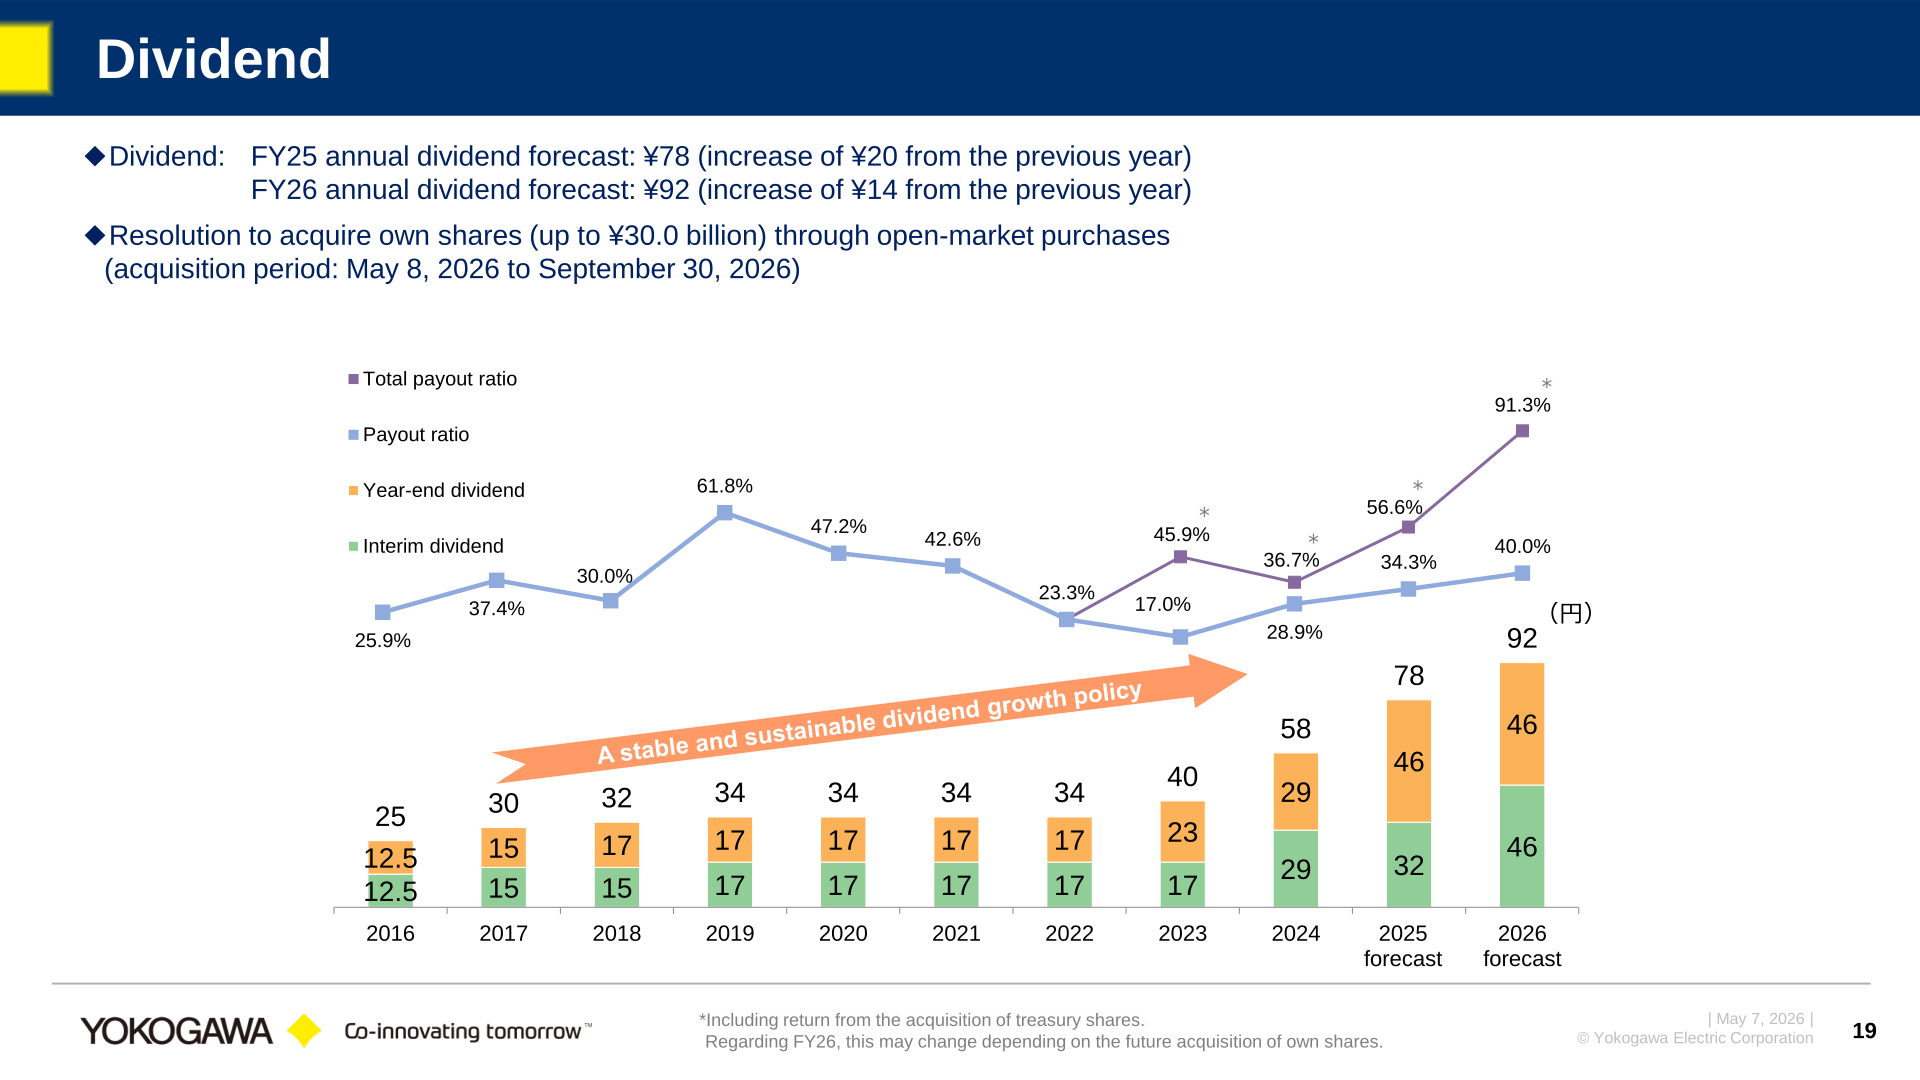
The FY25 annual dividend forecast is ¥78 (interim ¥32, year-end ¥46), an increase of ¥20 from the previous year’s ¥58, and the FY26 annual dividend forecast is ¥92 (interim ¥46, year-end ¥46), an increase of ¥14 from the previous year, marking a fourth consecutive dividend increase. The payout ratio for FY25 is 34.3% and the total payout ratio (including return from the acquisition of treasury shares) 56.6%; for FY26 the forecast payout ratio is 40.0% and the total payout ratio 91.3%, which may change depending on the future acquisition of own shares. The company has resolved to acquire its own shares of up to ¥30.0 billion through open-market purchases during the period from May 8, 2026 to September 30, 2026; share repurchases of ¥17.1 billion were completed between March 5 and December 31, 2025. The company states that its policy remains unchanged to prioritize investments aimed at enhancing and maximizing medium- to long-term corporate value, while improving shareholder returns through proactive dividends and other measures, and accelerating investments to execute growth strategies; growth investment in FY24-25 totaled approximately ¥17.8 billion, including the acquisitions of BaxEnergy, Web Synergies, Intellisync and WiSNAM.
| Item | FY24 | FY25 (forecast) | FY26 (forecast) |
|---|---|---|---|
| Interim dividend (¥) | 29 | 32 | 46 |
| Year-end dividend (¥) | 29 | 46 | 46 |
| Annual dividend (¥) | 58 | 78 | 92 |
| Payout ratio | 28.9% | 34.3% | 40.0% |
| Total payout ratio | 36.7% | 56.6% | 91.3% |
Medium-Term Plan (GS2028) and Topics
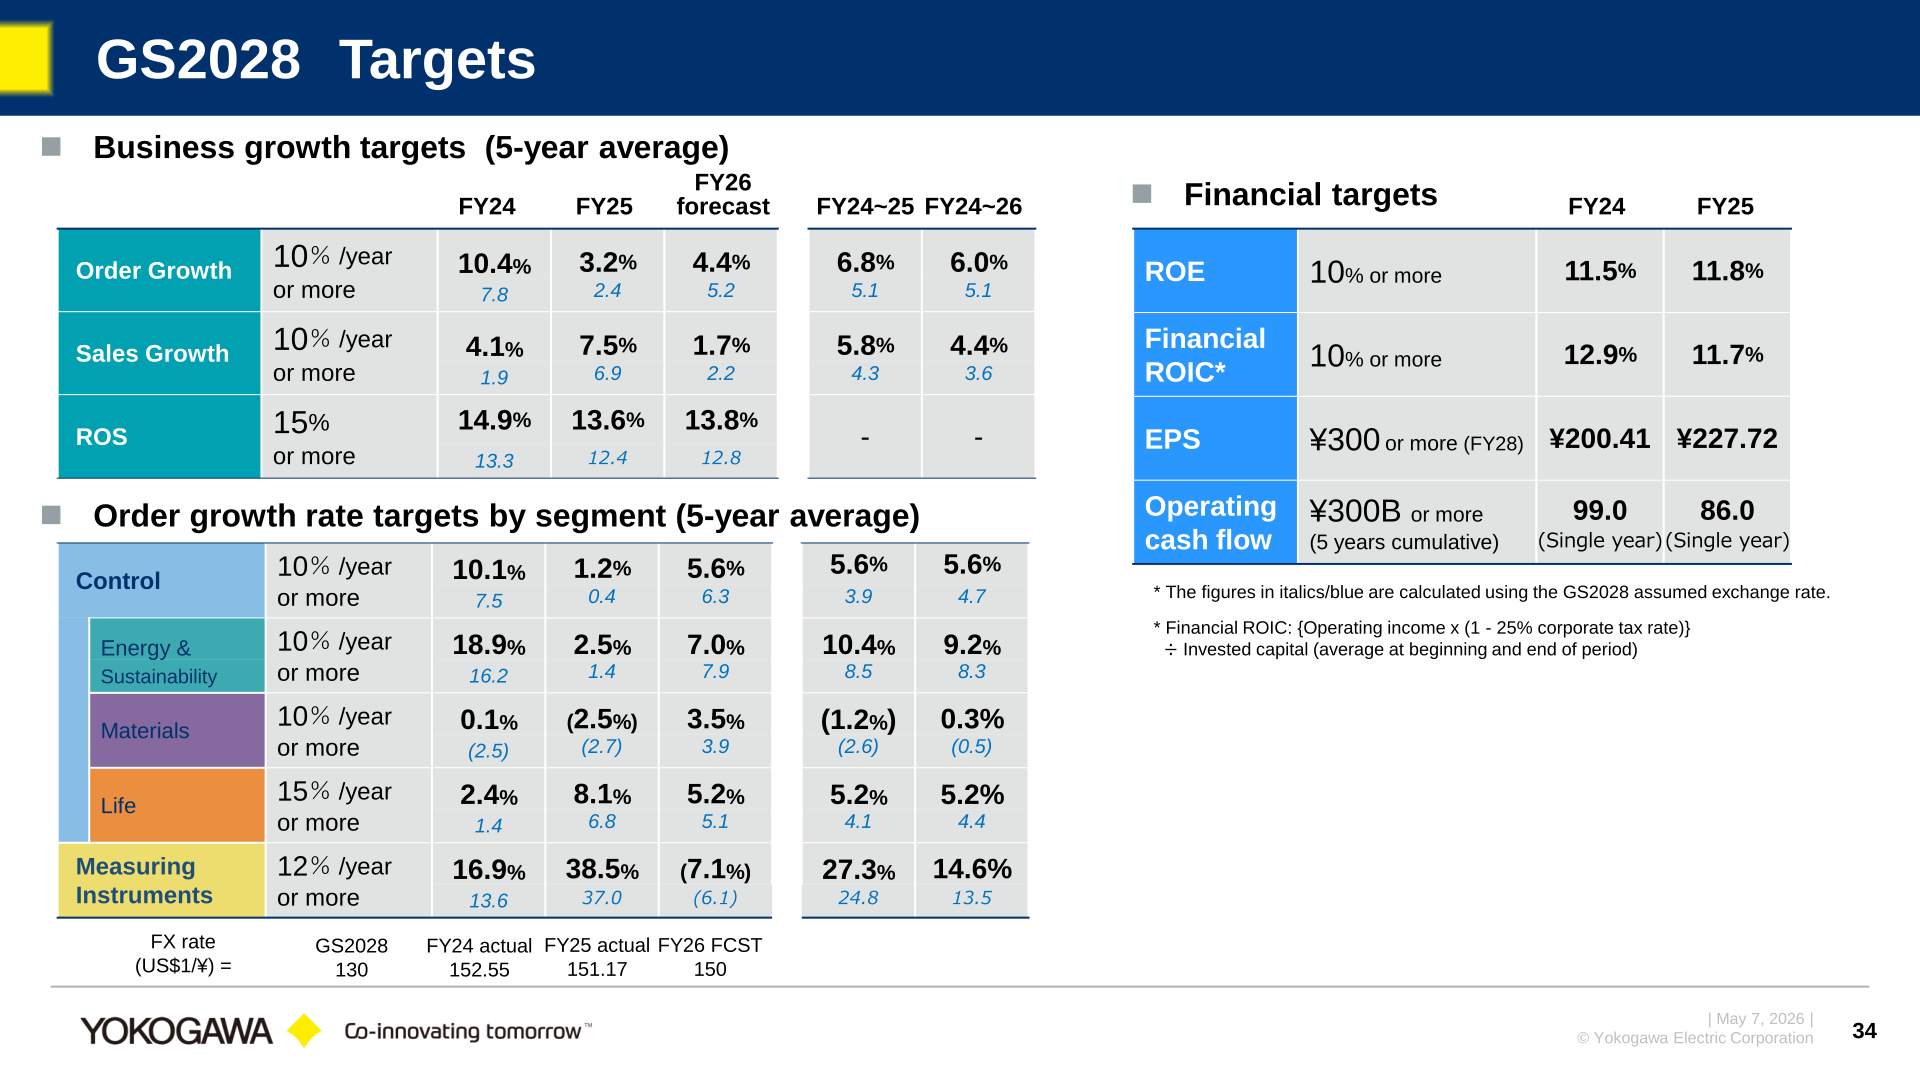
Against the GS2028 targets, FY25 results were ROE of 11.8% (target: 10% or more), financial ROIC of 11.7% (10% or more), EPS of ¥227.72 (¥300 or more in FY28) and operating cash flow of ¥86.0 billion (single year; target ¥300B or more cumulative over 5 years). Order growth in FY25 was 3.2% and sales growth 7.5% against five-year average targets of 10%/year or more, and ROS was 13.6% against a target of 15% or more. By segment, the FY25 order growth rate was 1.2% for Control (Energy & Sustainability 2.5%, Materials (2.5%), Life 8.1%) and 38.5% for Measuring Instruments. Overseas sales accounted for 73.3% of sales in FY25 (FY24: 74.4%). Regarding the Middle East situation, the company states that FY25 performance remains strong and the overall impact of the conflict has been limited, that some ongoing projects experienced temporary delays but have now begun to restart, and that at this stage no material impact has been observed on the project pipeline for FY26 onward. Priority target areas for FY26 are CAPEX x India, Measuring Instruments Business x Global, AI x OT, and OPEX x Europe & Southeast Asia. Case studies presented include growth in adoption of the autonomous control AI solution utilizing FKDPP (Saudi Aramco’s Fadhili Gas Plant, Braskem), an integrated solution adopted at Cosmo Eco Power’s Shimamaki-Kuromatsunai Wind Farm, a strategic collaboration agreement with Rolls-Royce SMR on data processing and control systems for small modular reactors, and the establishment of a Chief Technology Officer (CTO) position.
This article is an analysis based on publicly available information and is not a recommendation to buy or sell any specific securities. Investment decisions are your own responsibility.
![[Obayashi] Investors’ Guide 2026 — The Complete 24-Article Breakdown](https://japan-equity.com/wp-content/uploads/2026/07/hub_cover-1024x1024.png)
![[Obayashi] IR & SR Policy — Feeding Dialogue Back into Management](https://japan-equity.com/wp-content/uploads/2026/07/p32_sq-1024x1024.jpg)
![[Obayashi] Real Estate Development — 18.7% Margin, ¥287.7bn Unrealized Gains](https://japan-equity.com/wp-content/uploads/2026/07/p20_sq-1024x1024.jpg)
![[Obayashi] Domestic Civil Engineering — Resilience Spending Supports 9.6% Margin](https://japan-equity.com/wp-content/uploads/2026/07/p11_sq-1024x1024.jpg)
![[Obayashi] Share Price & External Ratings — vs TOPIX, ESG Index Inclusion](https://japan-equity.com/wp-content/uploads/2026/07/p40_sq-1024x1024.jpg)
![[Construction] ¥75.5tn Investment, Shrinking Workforce — Big-5 Market Share](https://japan-equity.com/wp-content/uploads/2026/07/p12_sq-1024x1024.jpg)



![[Obayashi] Capital Policy & Shareholder Returns — ROE 10%+, DOE ~5%, ¥100bn Buyback](https://japan-equity.com/wp-content/uploads/2026/07/p27_sq-1024x1024.jpg)
![[Obayashi] Reducing Cross-Shareholdings — ¥285.2bn Sold in Five Years](https://japan-equity.com/wp-content/uploads/2026/07/p29_sq-1024x1024.jpg)
![[Obayashi] ¥750bn Investment Plan — ¥300bn to Development, ¥190bn to Tech/DX](https://japan-equity.com/wp-content/uploads/2026/07/p30_sq-1024x1024.jpg)
![[Obayashi] MTP2022 KPIs — Operating Profit ~2x Target, ROE 14.4%](https://japan-equity.com/wp-content/uploads/2026/07/p25_sq-1024x1024.jpg)
![[Obayashi] Cash Allocation — ¥420bn Investment CF Over Five Years](https://japan-equity.com/wp-content/uploads/2026/07/p26_sq-1024x1024.jpg)
![[Obayashi] Green Energy — 44 Plants, 344MW, and the Green Hydrogen Challenge](https://japan-equity.com/wp-content/uploads/2026/07/p21_sq-1024x1024.jpg)
![[Obayashi] Tackling the Labor Shortage — Robotics Construction®](https://japan-equity.com/wp-content/uploads/2026/07/p14_sq-1024x1024.jpg)
