
This article is based on publicly available IR materials and is not a recommendation to buy or sell any specific securities.
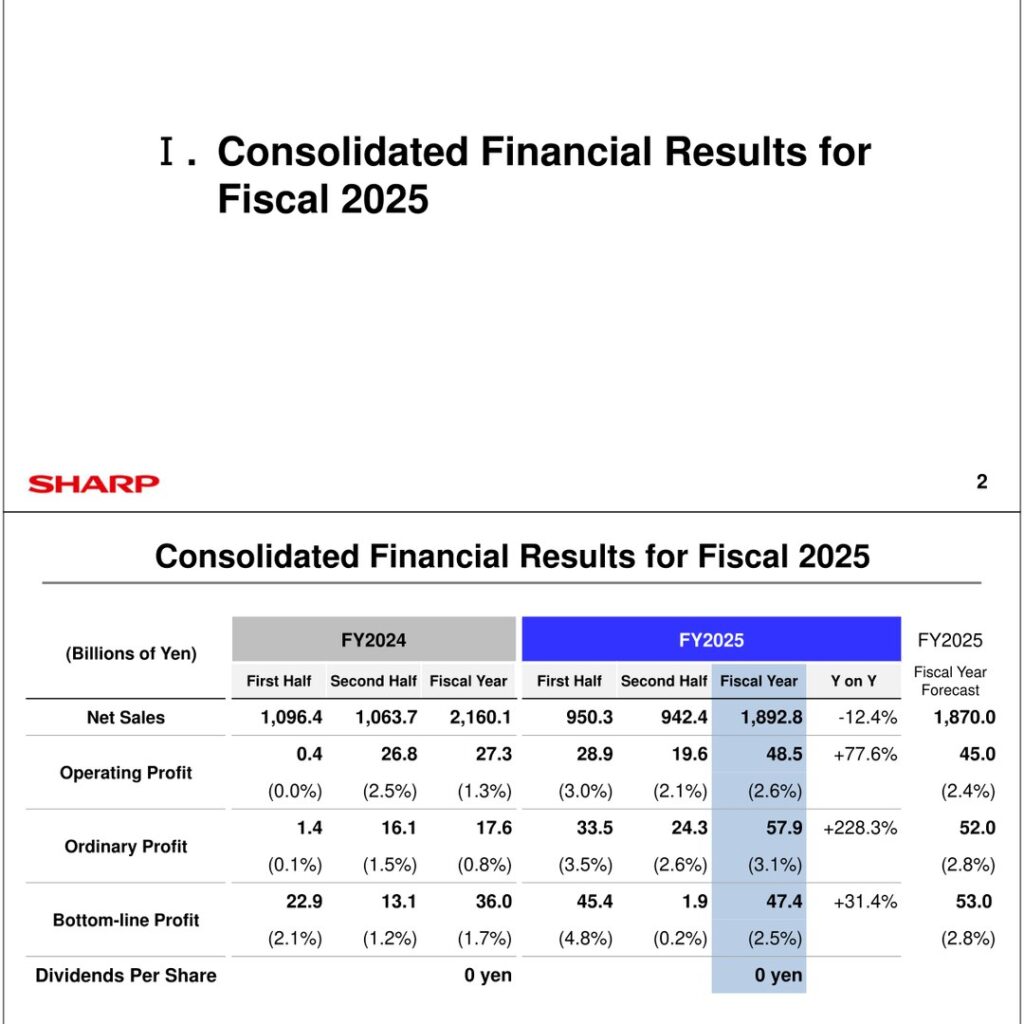
For fiscal 2025 (the year ended March 31, 2026), Sharp Corporation reported consolidated net sales of 1,892.8 billion yen, down 12.4% year on year, while operating profit rose 77.6% to 48.5 billion yen, ordinary profit rose 228.3% to 57.9 billion yen and bottom-line profit (profit attributable to owners of parent) rose 31.4% to 47.4 billion yen. The company states that profits improved despite a decline in net sales, and that net sales, operating profit and ordinary profit exceeded the announced figures. Operating profit in the Brand Business increased despite lower sales, and the operating loss in the Display Device Business narrowed significantly. The equity ratio rose from 10.5% to 19.6%. For fiscal 2026, Sharp forecasts net sales of 1,770.0 billion yen, operating profit of 49.0 billion yen, ordinary profit of 39.0 billion yen and bottom-line profit of 42.0 billion yen. Dividends per share were 0 yen for both fiscal 2024 and fiscal 2025.
Consolidated Results (Full-Year Actual)
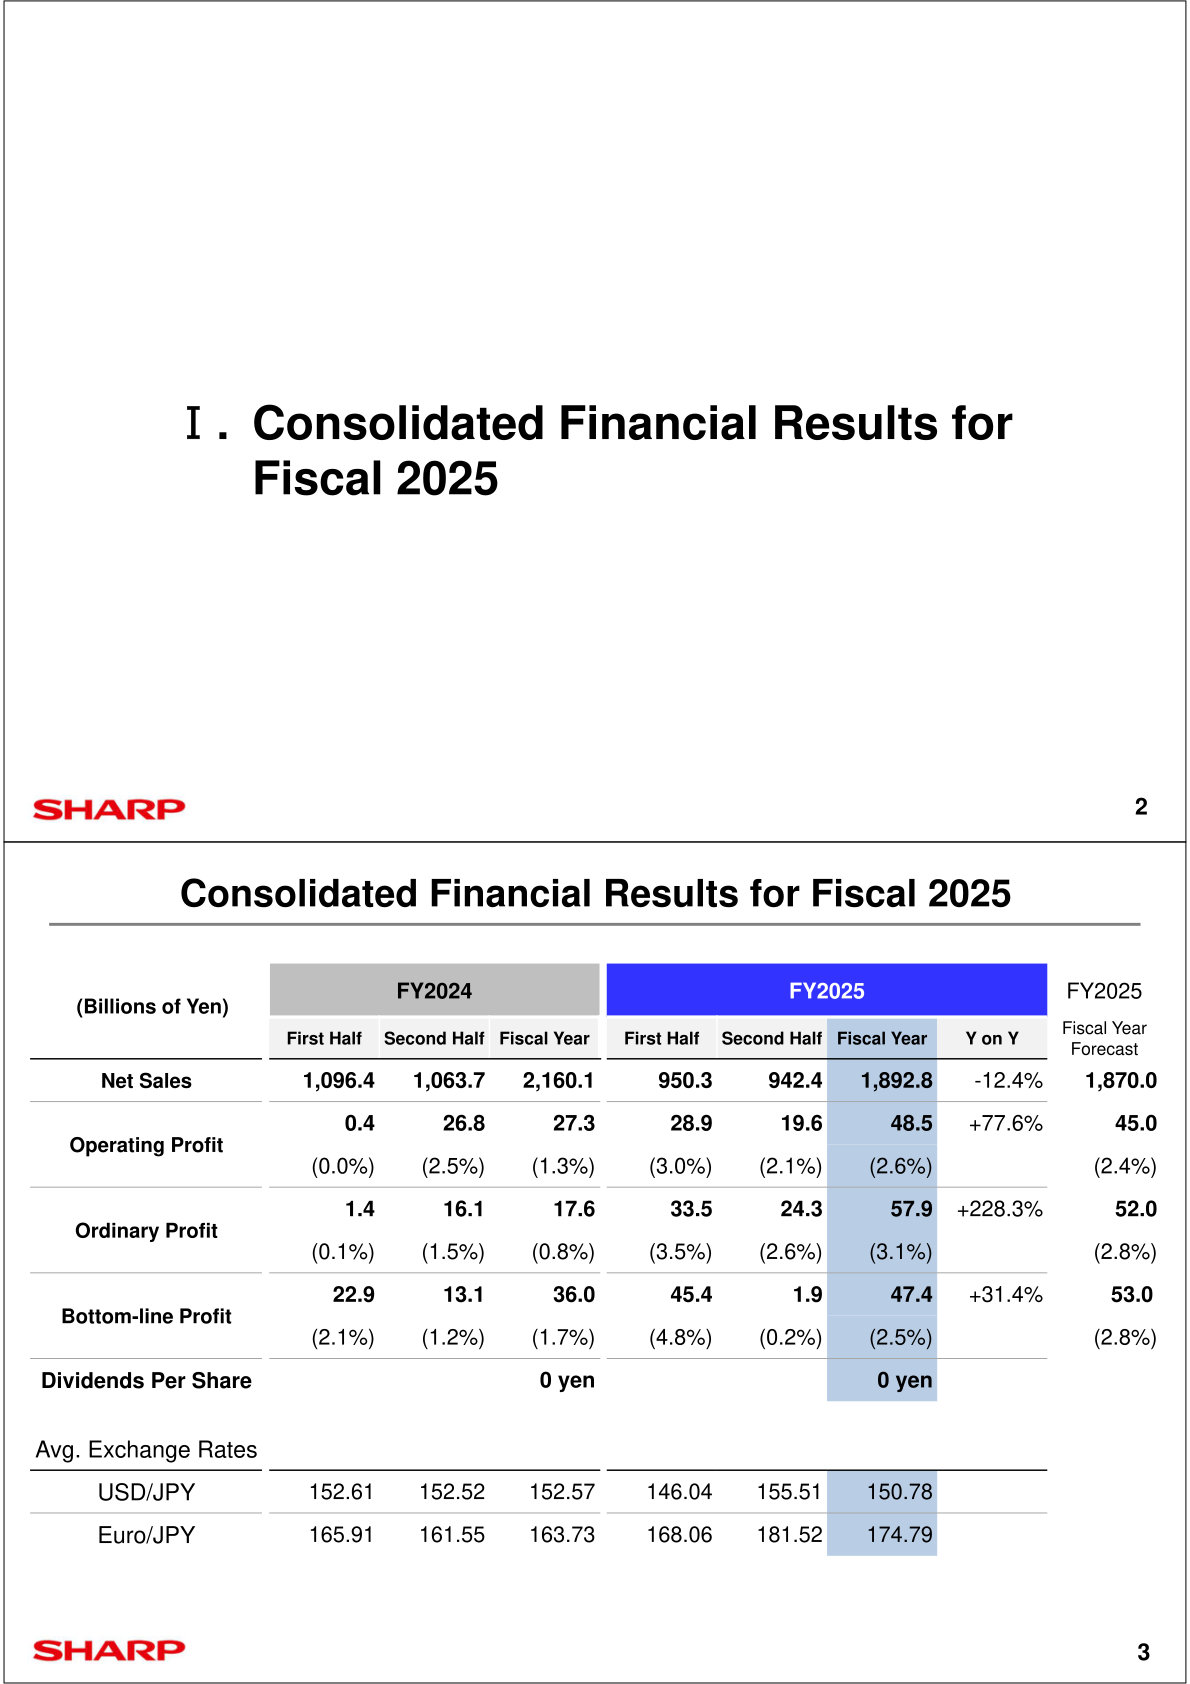
Consolidated net sales for fiscal 2025 were 1,892.8 billion yen (first half 950.3 billion yen, second half 942.4 billion yen), compared with 2,160.1 billion yen in fiscal 2024, a decrease of 12.4%. Operating profit was 48.5 billion yen (operating margin 2.6%) against 27.3 billion yen (1.3%) a year earlier, up 77.6%. Ordinary profit was 57.9 billion yen (3.1%) against 17.6 billion yen (0.8%), up 228.3%. Bottom-line profit was 47.4 billion yen (2.5%) against 36.0 billion yen (1.7%), up 31.4%; the company notes that bottom-line profit increased over 30% compared to the last fiscal year, when extraordinary income (losses) had a significant positive impact. Against the fiscal 2025 full-year forecast of net sales of 1,870.0 billion yen, operating profit of 45.0 billion yen, ordinary profit of 52.0 billion yen and bottom-line profit of 53.0 billion yen, net sales, operating profit and ordinary profit exceeded the announced figures. The average exchange rates for the year were 150.78 yen per U.S. dollar (152.57 yen in fiscal 2024) and 174.79 yen per euro (163.73 yen).
| Item (Billions of Yen) | FY2025 | FY2024 | Y on Y | FY2025 Forecast |
|---|---|---|---|---|
| Net Sales | 1,892.8 | 2,160.1 | -12.4% | 1,870.0 |
| Operating Profit | 48.5 | 27.3 | +77.6% | 45.0 |
| (Operating margin) | (2.6%) | (1.3%) | (2.4%) | |
| Ordinary Profit | 57.9 | 17.6 | +228.3% | 52.0 |
| (Margin) | (3.1%) | (0.8%) | (2.8%) | |
| Bottom-line Profit | 47.4 | 36.0 | +31.4% | 53.0 |
| (Margin) | (2.5%) | (1.7%) | (2.8%) | |
| Dividends Per Share | 0 yen | 0 yen | ||
| Avg. Exchange Rate USD/JPY | 150.78 | 152.57 | ||
| Avg. Exchange Rate Euro/JPY | 174.79 | 163.73 |
In the operating profit analysis of year-on-year change factors (management accounting), the company shows operating profit moving from 27.3 billion yen in fiscal 2024 to 48.5 billion yen in fiscal 2025, with sales -24.0 billion yen, selling prices -4.8 billion yen, cost reductions and model mix +24.2 billion yen, overhead expense +11.0 billion yen, foreign exchange +6.4 billion yen and tariff impact -2.5 billion yen. Brand business / display device combined contributed +12.9 billion yen (brand business +6.9 billion yen, display device -0.4 billion yen, impact from one-time income in fiscal 2024 -9.7 billion yen, excluding items shown on the left +7.7 billion yen), and Others (SDP, camera module business and semiconductor business) +10.7 billion yen.
Below operating profit, non-operating income (expenses) was +9.3 billion yen for fiscal 2025 compared with -9.6 billion yen in fiscal 2024 (an improvement of 18.9 billion yen), including interest expenses of -8.6 billion yen (-10.2 billion yen), foreign exchange gains of +3.4 billion yen (-12.6 billion yen) and share of profit of entities accounted for using the equity method of +7.9 billion yen (+7.9 billion yen). Extraordinary income (losses) was +5.4 billion yen against +35.9 billion yen a year earlier, comprising gain on sale of non-current assets of +36.1 billion yen (+78.0 billion yen), gain on sale of business of +1.8 billion yen, gain on sales of shares of subsidiaries and associates of +1.2 billion yen, business restructuring expenses of -19.8 billion yen (-29.6 billion yen), impairment losses of -6.0 billion yen (-54.3 billion yen) and provision for product warranties of -7.0 billion yen. Pretax income was 63.3 billion yen (53.6 billion yen) and income taxes, etc. were -15.9 billion yen (-17.5 billion yen). The 19.8 billion yen of business restructuring expenses consisted of 13.7 billion yen of expenses for the production cease at Kameyama No. 2 Plant, 1.2 billion yen of expenses to discontinue the business at Sakai Display Products Corporation and 4.9 billion yen of business restructuring expenses of consolidated subsidiaries (of which 0.7 billion yen related to discontinuing the business at Sharp Yonago Corporation).
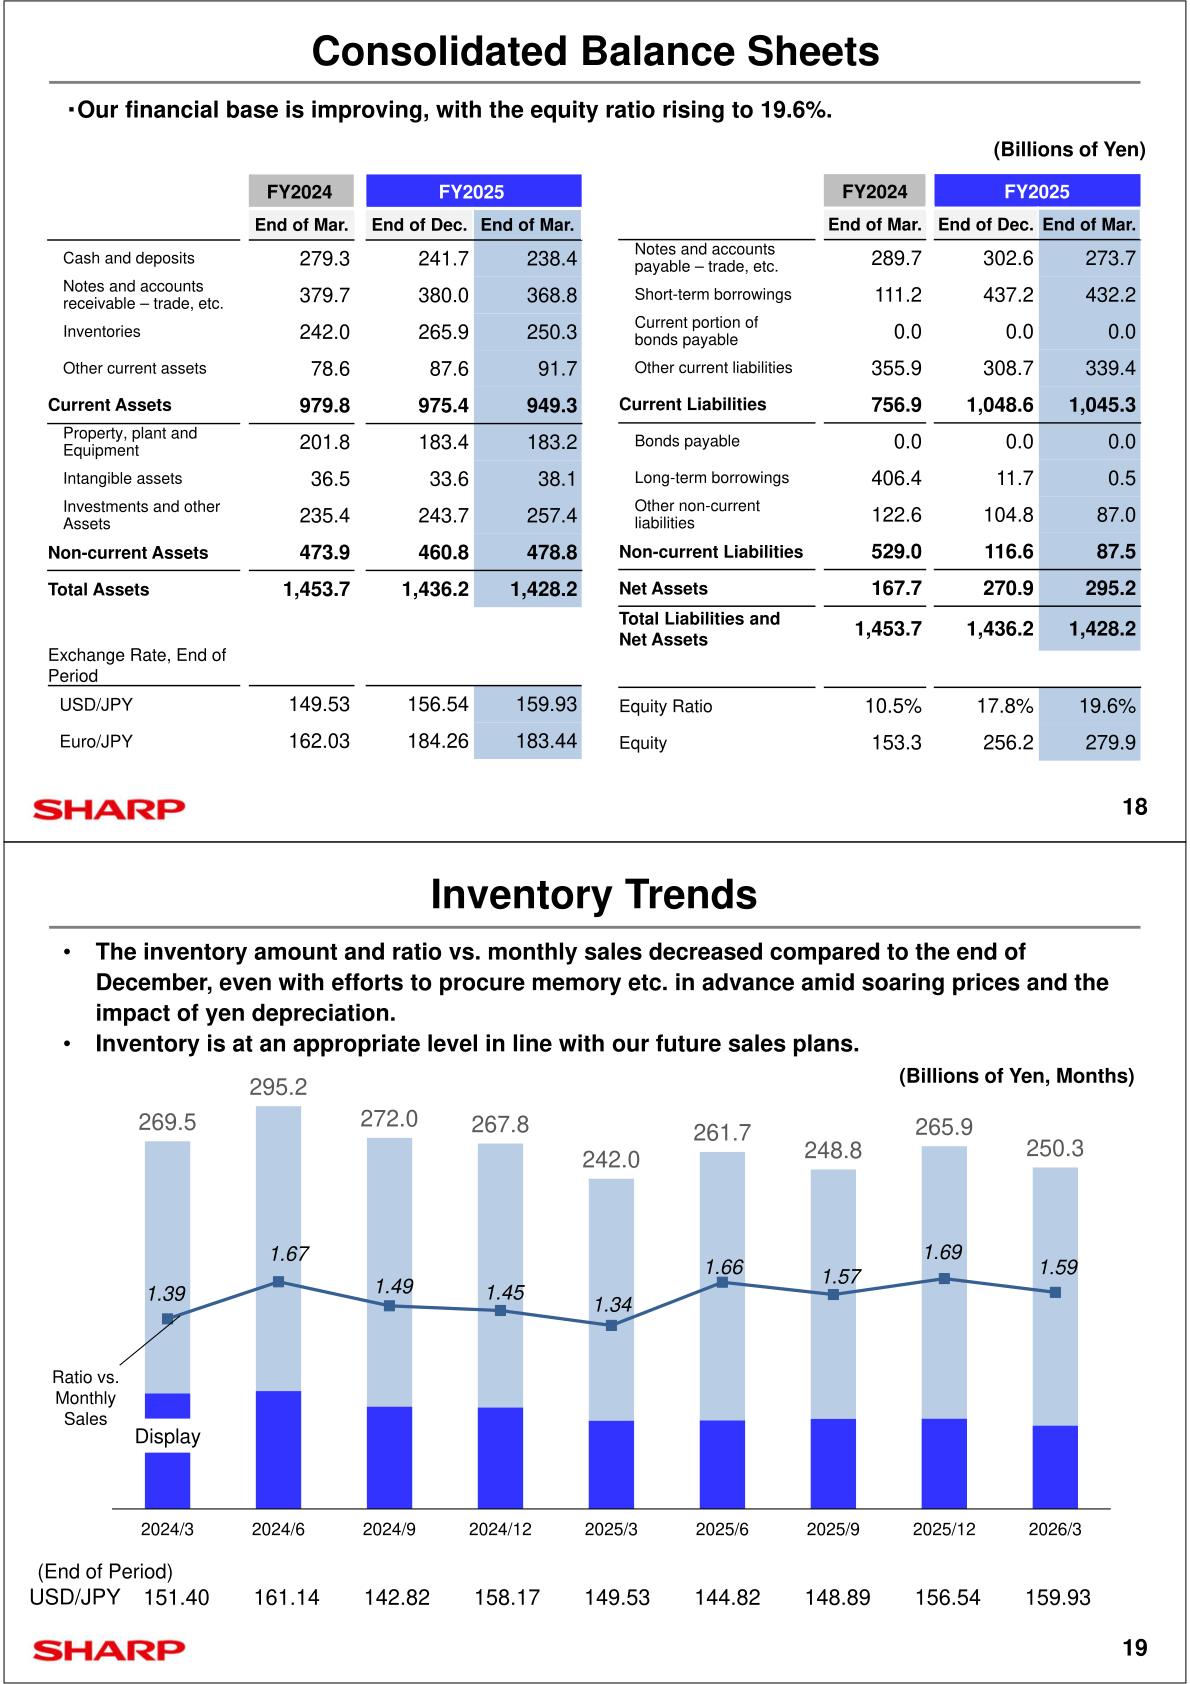
On the balance sheet, total assets were 1,428.2 billion yen at the end of March 2026 (1,453.7 billion yen at the end of March 2025), net assets were 295.2 billion yen (167.7 billion yen), equity was 279.9 billion yen (153.3 billion yen) and the equity ratio rose to 19.6% from 10.5%. Short-term borrowings were 432.2 billion yen (111.2 billion yen) and long-term borrowings 0.5 billion yen (406.4 billion yen). The company states that it signed a refinancing agreement on March 31, 2026 for its syndicated loan, which matured on April 28, 2026, and that its credit rating was upgraded by two notches to B+. Inventories were 250.3 billion yen at the end of March 2026 (242.0 billion yen at the end of March 2025; 265.9 billion yen at the end of December 2025), which the company describes as an appropriate level in line with future sales plans. In cash flows, operating cash flow was -0.1 billion yen, investing cash flow +71.7 billion yen (free cash flow +71.5 billion yen) and financing cash flow -105.8 billion yen, with a change in cash of -12.2 billion yen.
Segment Results
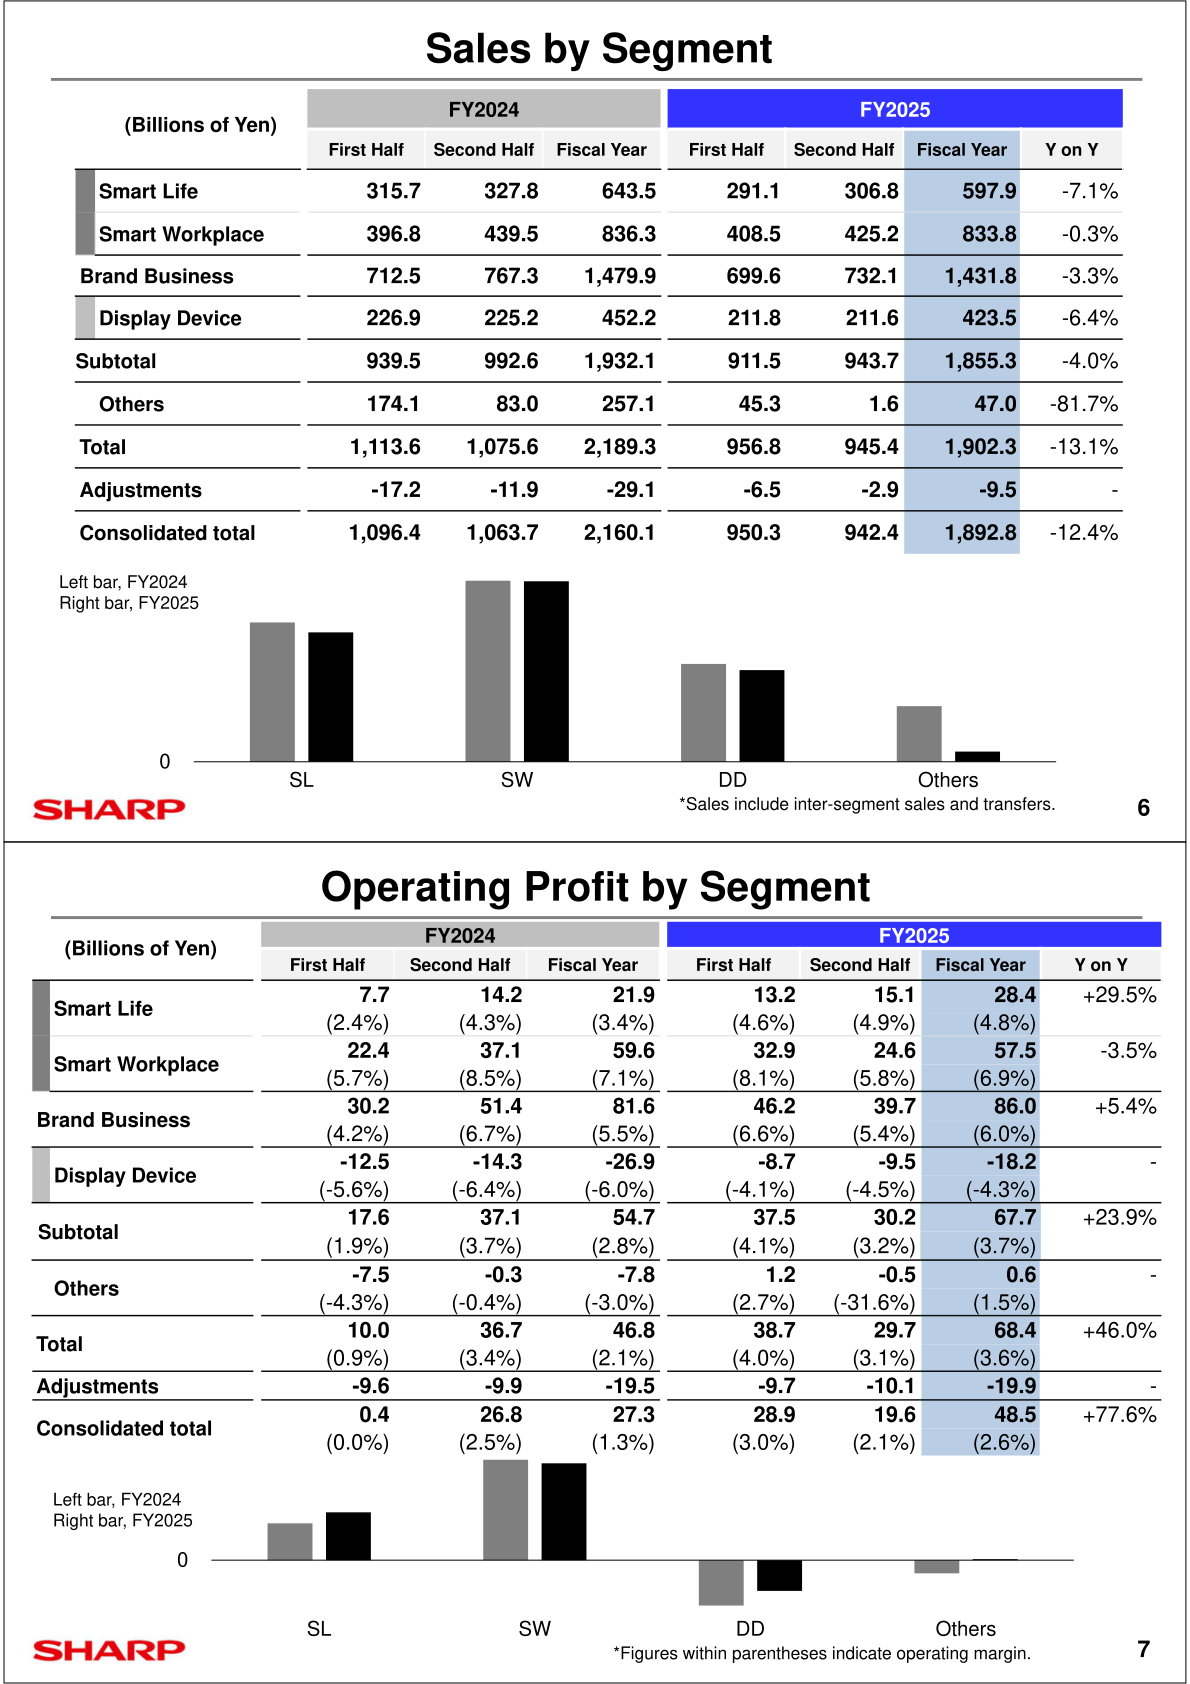
Sales by segment (including inter-segment sales and transfers) for fiscal 2025 were 597.9 billion yen in Smart Life (down 7.1%), 833.8 billion yen in Smart Workplace (down 0.3%) and 1,431.8 billion yen in the Brand Business in total (down 3.3%), 423.5 billion yen in Display Device (down 6.4%) and 47.0 billion yen in Others (down 81.7%), for a consolidated total of 1,892.8 billion yen after adjustments of -9.5 billion yen. Operating profit by segment was 28.4 billion yen in Smart Life (up 29.5%, margin 4.8%), 57.5 billion yen in Smart Workplace (down 3.5%, margin 6.9%), 86.0 billion yen for the Brand Business (up 5.4%, margin 6.0%), -18.2 billion yen in Display Device (-26.9 billion yen a year earlier, margin -4.3%) and 0.6 billion yen in Others (-7.8 billion yen), with adjustments of -19.9 billion yen.
In Smart Life, the company cites sales growth for high-value-added products and cost and expense reductions as positive factors and a decrease in sales as a negative factor. In the white goods business, sales of cooking appliances grew mainly in Japan and the U.S., but sales of washing machines, refrigerators and air conditioners did not reach the same period of the last fiscal year. In the TV business, sales in Japan and overseas decreased due to effects of competitors’ aggressive sales activities. In the energy solutions business, sales saw steady performance in residential use in Japan, and sales of storage battery systems, sales in the Asian market and sales for space applications grew, while sales of EPC decreased in Japan. In Smart Workplace, PC business B2C sales, sales for government agencies and sales for GIGA in Japan grew significantly, and business solutions sales expanded significantly mainly in Japan and Europe, with MFPs (for which new products performed well) also recording increased sales in Japan and Europe, while mobile communications business sales decreased mainly due to effects of competitors’ aggressive sales activities; the company cites one-time revenue recorded in the last fiscal year in the mobile communications business, an increase in material prices such as memory and a decrease in sales as negative factors for profit. In Display Device, sales for smartphone applications phased out, and the company cites cost and expense reduction as a positive factor and a decrease in sales as a negative factor.
| Segment (Billions of Yen) | Metric | FY2025 | FY2024 | Y on Y |
|---|---|---|---|---|
| Smart Life | Sales | 597.9 | 643.5 | -7.1% |
| Smart Life | Operating Profit (margin) | 28.4 (4.8%) | 21.9 (3.4%) | +29.5% |
| Smart Workplace | Sales | 833.8 | 836.3 | -0.3% |
| Smart Workplace | Operating Profit (margin) | 57.5 (6.9%) | 59.6 (7.1%) | -3.5% |
| Brand Business | Sales | 1,431.8 | 1,479.9 | -3.3% |
| Brand Business | Operating Profit (margin) | 86.0 (6.0%) | 81.6 (5.5%) | +5.4% |
| Display Device | Sales | 423.5 | 452.2 | -6.4% |
| Display Device | Operating Profit (margin) | -18.2 (-4.3%) | -26.9 (-6.0%) | – |
| Subtotal | Sales | 1,855.3 | 1,932.1 | -4.0% |
| Subtotal | Operating Profit (margin) | 67.7 (3.7%) | 54.7 (2.8%) | +23.9% |
| Others | Sales | 47.0 | 257.1 | -81.7% |
| Others | Operating Profit (margin) | 0.6 (1.5%) | -7.8 (-3.0%) | – |
| Adjustments | Sales | -9.5 | -29.1 | – |
| Adjustments | Operating Profit | -19.9 | -19.5 | – |
| Consolidated total | Sales | 1,892.8 | 2,160.1 | -12.4% |
| Consolidated total | Operating Profit (margin) | 48.5 (2.6%) | 27.3 (1.3%) | +77.6% |
FY2026 Forecast
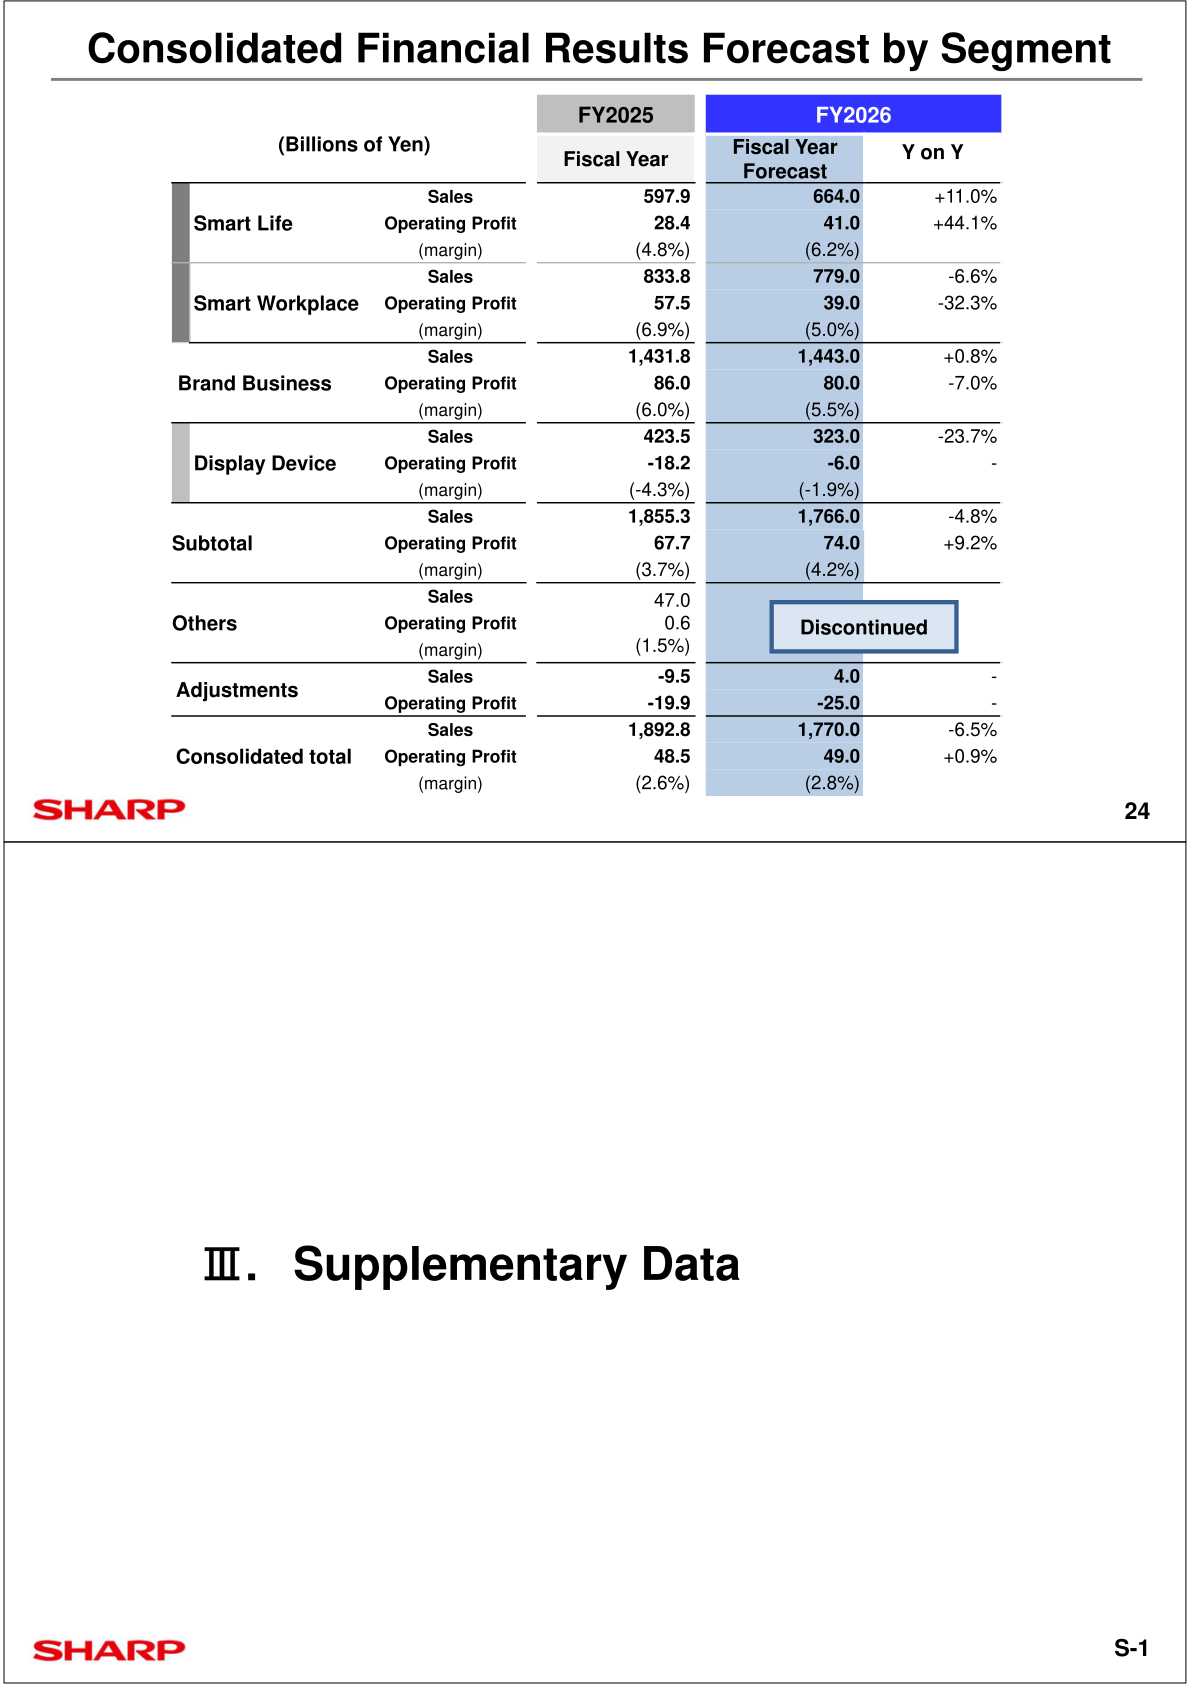
For fiscal 2026, Sharp forecasts net sales of 1,770.0 billion yen (down 6.5% year on year), operating profit of 49.0 billion yen (up 0.9%, margin 2.8%), ordinary profit of 39.0 billion yen (down 32.7%, margin 2.2%) and bottom-line profit of 42.0 billion yen (down 11.5%, margin 2.4%), assuming average exchange rates of 156.00 yen per U.S. dollar and 183.00 yen per euro. By segment, Smart Life is forecast at sales of 664.0 billion yen (up 11.0%) and operating profit of 41.0 billion yen (up 44.1%, margin 6.2%), Smart Workplace at sales of 779.0 billion yen (down 6.6%) and operating profit of 39.0 billion yen (down 32.3%, margin 5.0%), the Brand Business in total at sales of 1,443.0 billion yen (up 0.8%) and operating profit of 80.0 billion yen (down 7.0%, margin 5.5%), and Display Device at sales of 323.0 billion yen (down 23.7%) and an operating loss of 6.0 billion yen (margin -1.9%). The Others segment is shown as discontinued in the fiscal 2026 forecast. Capital investment is planned at 39.0 billion yen (of which displays 10.0 billion yen), depreciation and amortization at 35.0 billion yen and R&D expenditures at 75.0 billion yen. The company states that it reached a turning point in structural reforms in fiscal 2025 and will strengthen growth initiatives in fiscal 2026.
| Item (Billions of Yen) | FY2026 Forecast | FY2025 (Actual) | Y on Y |
|---|---|---|---|
| Net Sales | 1,770.0 | 1,892.8 | -6.5% |
| Operating Profit (margin) | 49.0 (2.8%) | 48.5 (2.6%) | +0.9% |
| Ordinary Profit (margin) | 39.0 (2.2%) | 57.9 (3.1%) | -32.7% |
| Bottom-line Profit (margin) | 42.0 (2.4%) | 47.4 (2.5%) | -11.5% |
| Smart Life — Sales | 664.0 | 597.9 | +11.0% |
| Smart Life — Operating Profit | 41.0 | 28.4 | +44.1% |
| Smart Workplace — Sales | 779.0 | 833.8 | -6.6% |
| Smart Workplace — Operating Profit | 39.0 | 57.5 | -32.3% |
| Brand Business — Sales | 1,443.0 | 1,431.8 | +0.8% |
| Brand Business — Operating Profit | 80.0 | 86.0 | -7.0% |
| Display Device — Sales | 323.0 | 423.5 | -23.7% |
| Display Device — Operating Profit | -6.0 | -18.2 | – |
| Avg. Exchange Rate USD/JPY | 156.00 | 150.78 | |
| Avg. Exchange Rate Euro/JPY | 183.00 | 174.79 |
Shareholder Returns
Dividends per share were 0 yen for fiscal 2024 and 0 yen for fiscal 2025. A dividend forecast for fiscal 2026 and any share repurchase policy cannot be confirmed from the materials.
Financial Base and Topics
The company states that its financial base improved significantly, with the equity ratio rising from 10.5% to 19.6%, that it refinanced its syndicated loan and that its credit rating improved (upgraded by two notches to B+). Net interest-bearing debt (interest-bearing debt less cash and deposits) and its ratio versus monthly sales are shown in trend charts; the inventory amount and ratio versus monthly sales decreased compared to the end of December 2025, even with efforts to procure memory etc. in advance amid soaring prices and the impact of yen depreciation. For fiscal 2025, capital investment was 30.7 billion yen (of which displays 10.6 billion yen), depreciation and amortization 29.6 billion yen and R&D expenditures 69.1 billion yen.
This article is an analysis based on publicly available information and is not a recommendation to buy or sell any specific securities. Investment decisions are your own responsibility.
![[Obayashi] Investors’ Guide 2026 — The Complete 24-Article Breakdown](https://japan-equity.com/wp-content/uploads/2026/07/hub_cover-1024x1024.png)
![[Obayashi] IR & SR Policy — Feeding Dialogue Back into Management](https://japan-equity.com/wp-content/uploads/2026/07/p32_sq-1024x1024.jpg)
![[Obayashi] Domestic Civil Engineering — Resilience Spending Supports 9.6% Margin](https://japan-equity.com/wp-content/uploads/2026/07/p11_sq-1024x1024.jpg)
![[Obayashi] Overseas Construction — Orders Reach ¥1.2tn](https://japan-equity.com/wp-content/uploads/2026/07/p15_sq-1024x1024.jpg)
![[Obayashi] Share Price & External Ratings — vs TOPIX, ESG Index Inclusion](https://japan-equity.com/wp-content/uploads/2026/07/p40_sq-1024x1024.jpg)
![[Construction] ¥75.5tn Investment, Shrinking Workforce — Big-5 Market Share](https://japan-equity.com/wp-content/uploads/2026/07/p12_sq-1024x1024.jpg)



![[Obayashi] Capital Policy & Shareholder Returns — ROE 10%+, DOE ~5%, ¥100bn Buyback](https://japan-equity.com/wp-content/uploads/2026/07/p27_sq-1024x1024.jpg)
![[Obayashi] Reducing Cross-Shareholdings — ¥285.2bn Sold in Five Years](https://japan-equity.com/wp-content/uploads/2026/07/p29_sq-1024x1024.jpg)
![[Obayashi] ¥750bn Investment Plan — ¥300bn to Development, ¥190bn to Tech/DX](https://japan-equity.com/wp-content/uploads/2026/07/p30_sq-1024x1024.jpg)
![[Obayashi] MTP2022 KPIs — Operating Profit ~2x Target, ROE 14.4%](https://japan-equity.com/wp-content/uploads/2026/07/p25_sq-1024x1024.jpg)
![[Obayashi] Cash Allocation — ¥420bn Investment CF Over Five Years](https://japan-equity.com/wp-content/uploads/2026/07/p26_sq-1024x1024.jpg)
![[Obayashi] Green Energy — 44 Plants, 344MW, and the Green Hydrogen Challenge](https://japan-equity.com/wp-content/uploads/2026/07/p21_sq-1024x1024.jpg)
![[Obayashi] Tackling the Labor Shortage — Robotics Construction®](https://japan-equity.com/wp-content/uploads/2026/07/p14_sq-1024x1024.jpg)
