
This article is based on publicly available IR materials and is not a recommendation to buy or sell any specific securities.
Note: Elecom’s presentation labels the fiscal year ended March 31, 2026 as “FY03/26”; this site classifies the most recent completed fiscal year as FY2025. Figures and labels below follow the company’s materials.
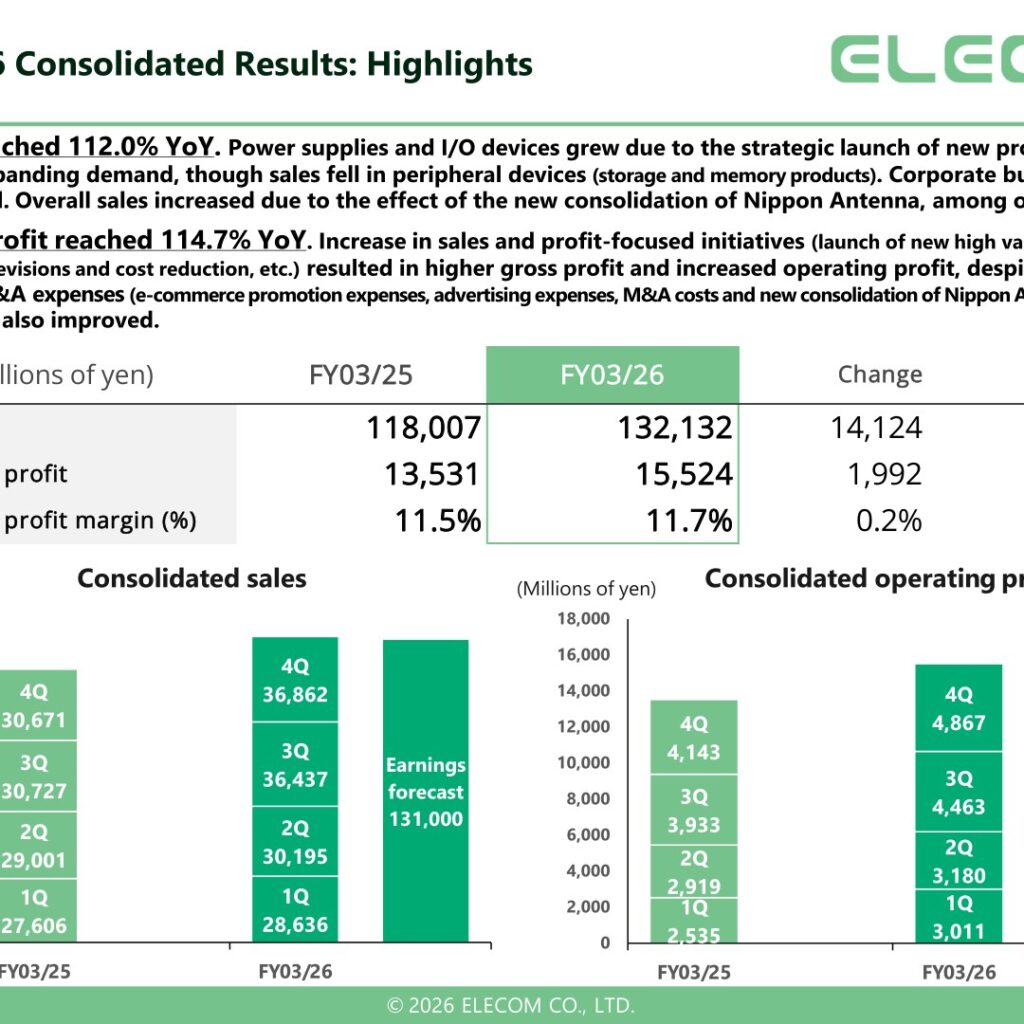
Elecom Co., Ltd. (Tokyo Stock Exchange Prime Market, Code: 6750), a manufacturer centered on digital equipment such as PCs, smartphones and tablets as well as home appliances, reported consolidated results for FY03/26 based on its “ELECOM GROUP Full-Year Results Briefing” presentation. Net sales reached ¥132,132 million (112.0% YoY) and operating profit reached ¥15,524 million (114.7% YoY). Sales and profit increased for three consecutive years, and operating profit, ordinary profit and net profit hit new record-highs. The company cites growth of focus categories in e-commerce, expanded sales of focus products and acquisition of related demand in B2B, and the M&A of Nippon Antenna as drivers.
Consolidated Results (Full-Year Actual)
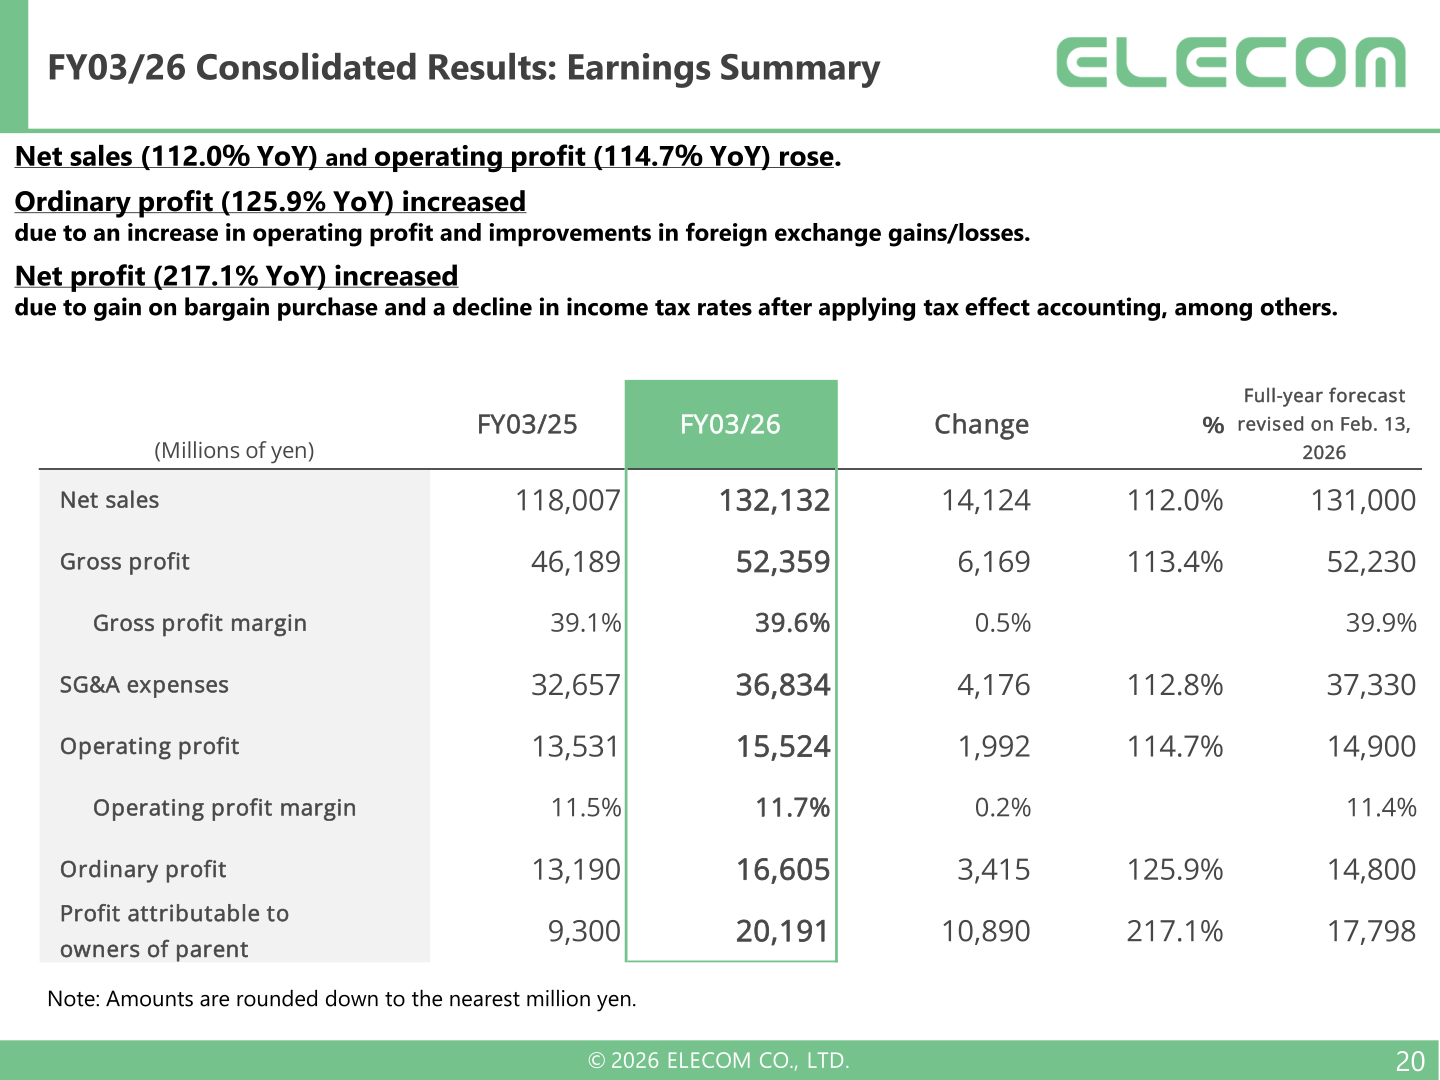
Ordinary profit increased to 125.9% YoY due to an increase in operating profit and improvements in foreign exchange gains/losses. Profit attributable to owners of parent rose to 217.1% YoY, due to gain on bargain purchase and a decline in income tax rates after applying tax effect accounting, among others. Operating profit of ¥15,524 million exceeded the full-year forecast revised on February 13, 2026 (¥14,900 million) by ¥624 million; the company notes that despite headwinds from rising semiconductor prices and the ongoing depreciation of yen, operating profit achieved the announced figure and a record high, supported by efforts for improving profit and accumulation of sales and profit in 2H. The prior record-high operating profit had been ¥15,140 million in FY03/21.
| Item (Millions of yen) | FY03/25 | FY03/26 | Change | % |
|---|---|---|---|---|
| Net sales | 118,007 | 132,132 | 14,124 | 112.0% |
| Gross profit | 46,189 | 52,359 | 6,169 | 113.4% |
| Gross profit margin | 39.1% | 39.6% | 0.5% | – |
| SG&A expenses | 32,657 | 36,834 | 4,176 | 112.8% |
| Operating profit | 13,531 | 15,524 | 1,992 | 114.7% |
| Operating profit margin | 11.5% | 11.7% | 0.2% | – |
| Ordinary profit | 13,190 | 16,605 | 3,415 | 125.9% |
| Profit attributable to owners of parent | 9,300 | 20,191 | 10,890 | 217.1% |
On the balance sheet, total assets increased by ¥30,465 million to ¥145,205 million, owing to a significant increase in cash and deposits (M&A and accumulation of free cash flow) as well as increases in sales receivables, inventories, and property, plant and equipment. Net assets increased by ¥25,490 million to ¥108,183 million. Operating cash flow was ¥9,877 million (FY03/25: ¥17,354 million) and free cash flow was ¥6,801 million; cash and cash equivalents at end of period rose to ¥58,497 million, mainly due to the share exchange with Nippon Antenna.
Results by Product and Channel
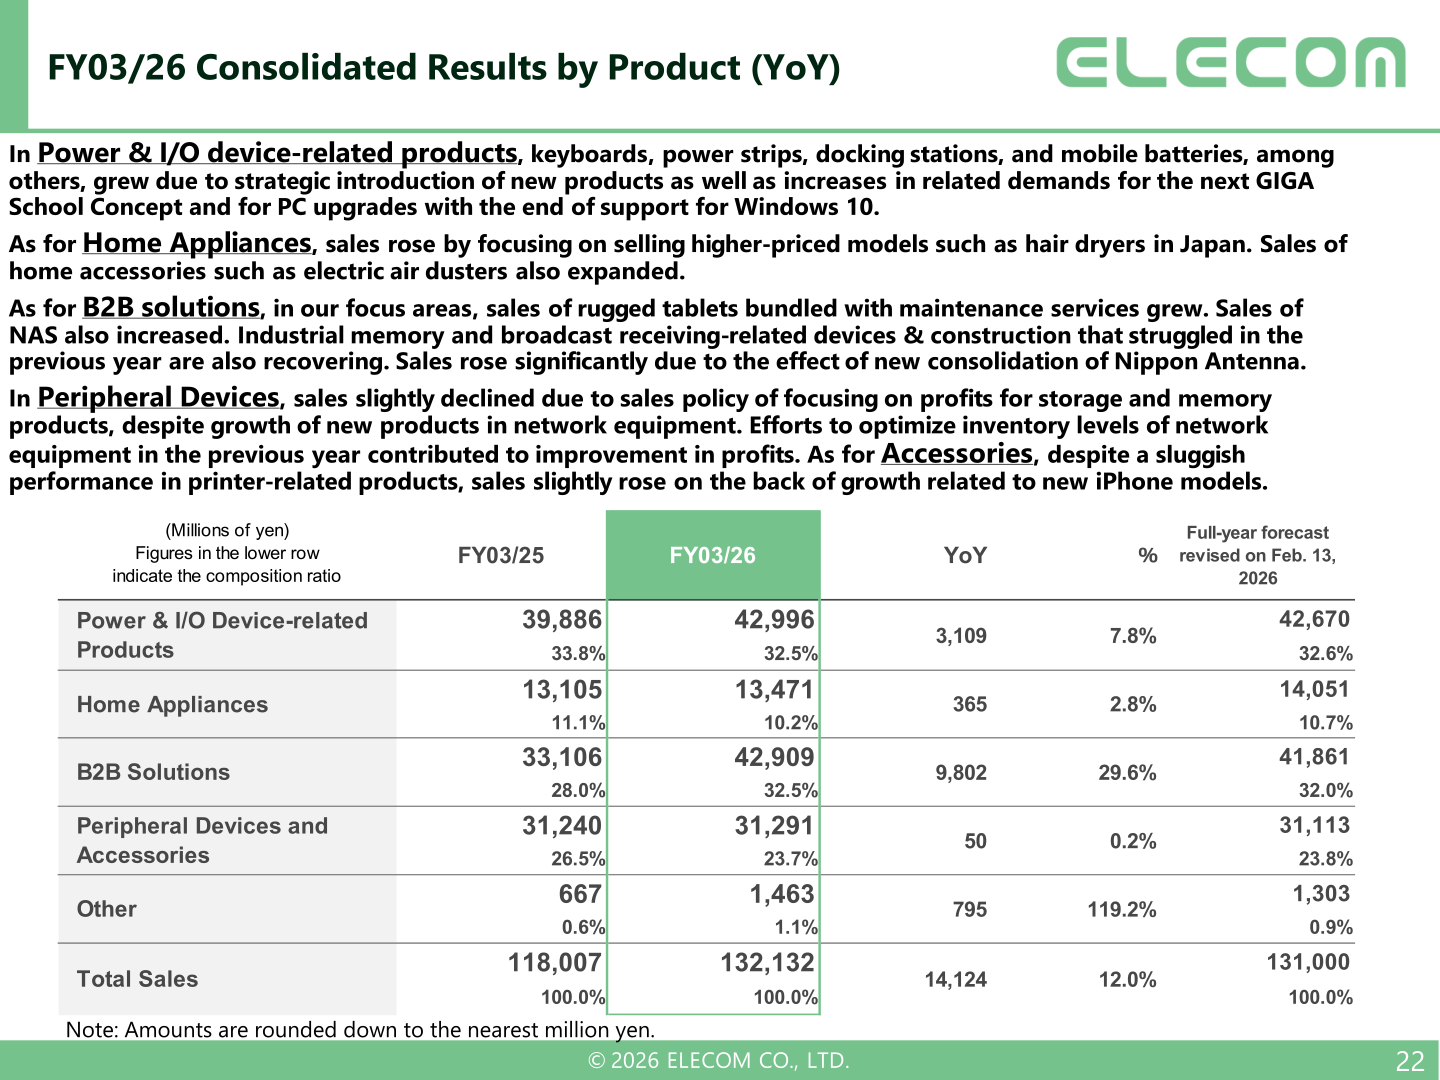
By product, Power & I/O device-related products grew as keyboards, power strips, docking stations, and mobile batteries expanded due to strategic introduction of new products as well as increases in related demand for the next GIGA School Concept and for PC upgrades with the end of support for Windows 10. Home Appliances rose by focusing on selling higher-priced models such as hair dryers in Japan. B2B Solutions grew 29.6% — sales of rugged tablets bundled with maintenance services and NAS increased, industrial memory and broadcast receiving-related devices & construction are recovering, and sales rose significantly due to the new consolidation of Nippon Antenna. Peripheral Devices saw a slight sales decline due to a sales policy of focusing on profits for storage and memory products, despite growth of new products in network equipment.
| Product (Millions of yen) | FY03/25 | FY03/26 | YoY | % |
|---|---|---|---|---|
| Power & I/O Device-related Products | 39,886 | 42,996 | 3,109 | 7.8% |
| Home Appliances | 13,105 | 13,471 | 365 | 2.8% |
| B2B Solutions | 33,106 | 42,909 | 9,802 | 29.6% |
| Peripheral Devices and Accessories | 31,240 | 31,291 | 50 | 0.2% |
| Other | 667 | 1,463 | 795 | 119.2% |
| Total Sales | 118,007 | 132,132 | 14,124 | 12.0% |
By channel, the ¥14,124 million increase in net sales (+12.0% growth) breaks down into B2C +1,115, e-commerce +2,607, ELECOM B2B +2,780, Group B2B +1,801, Other (463), and the new consolidation of Nippon Antenna +6,283 (millions of yen). E-commerce sales rose significantly for power supplies, beauty (hair) appliances, cables, docking stations and mouse. In Group companies’ B2B, DX Antenna’s broadcast receiving-related devices & construction and Hagiwara Solutions’ industrial memory were recovering.
FY03/27 Forecast
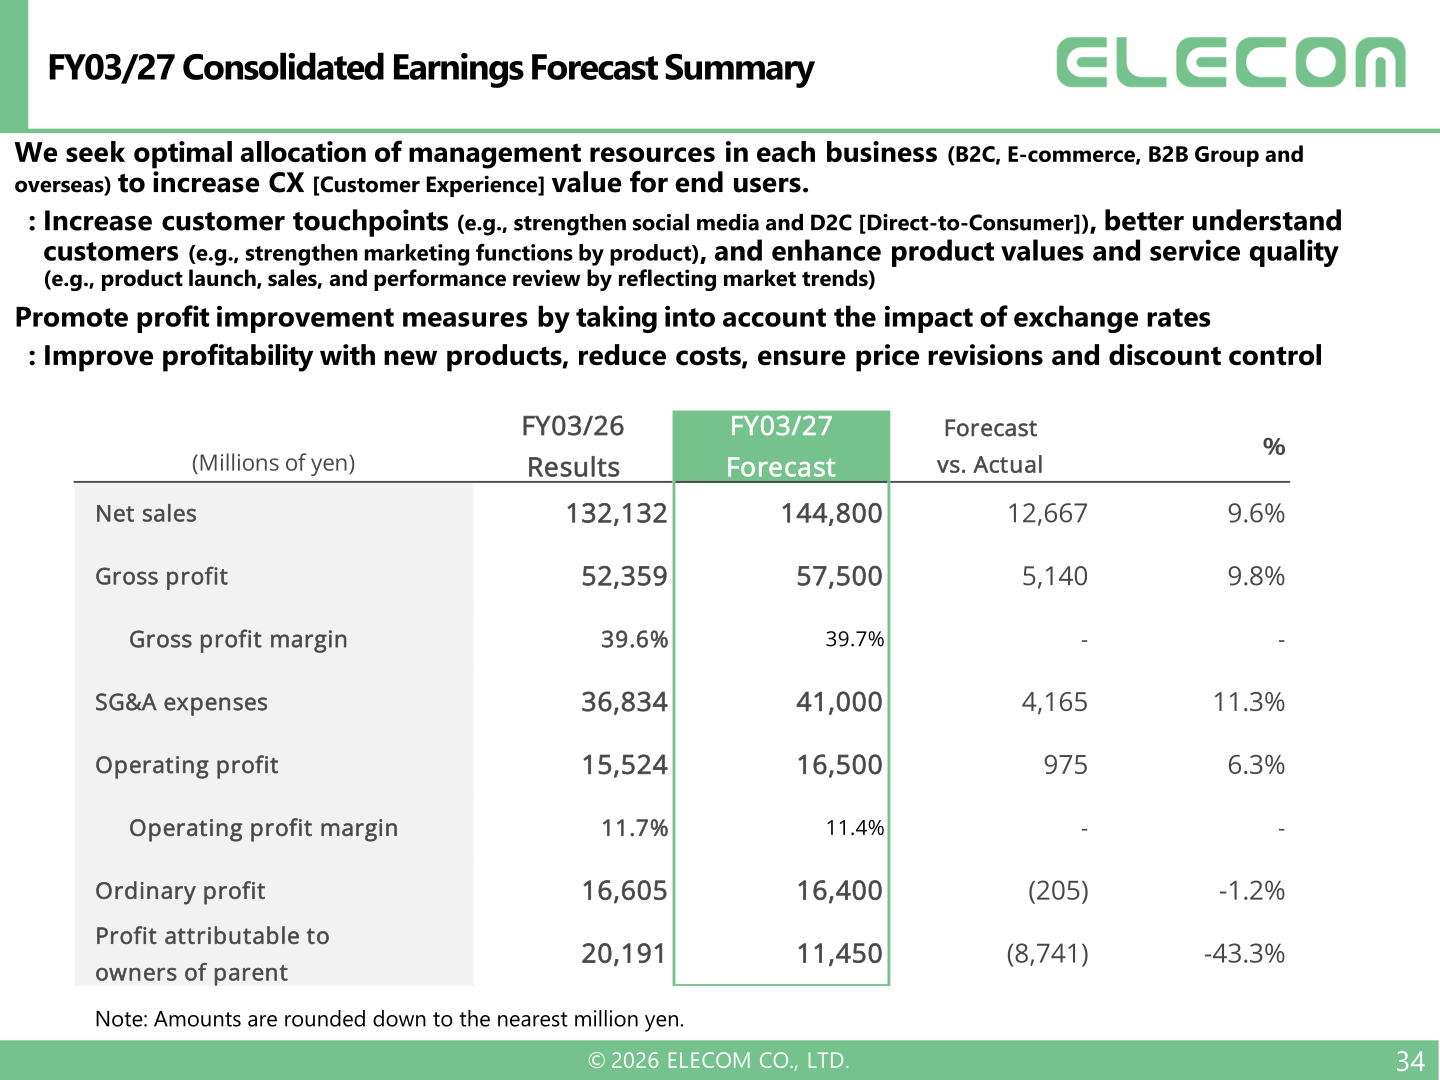
For FY03/27, Elecom forecasts net sales of ¥144,800 million (+9.6%) and operating profit of ¥16,500 million (+6.3%). Profit attributable to owners of parent is forecast at ¥11,450 million (-43.3%), against a FY03/26 result that included gain on bargain purchase. The company seeks optimal allocation of management resources in each business (B2C, e-commerce, B2B Group and overseas) to increase CX (Customer Experience) value for end users, and promotes profit improvement measures taking into account the impact of exchange rates. By product, B2B Solutions is forecast to grow 15.2% to ¥49,412 million and Home Appliances 15.8% to ¥15,601 million, while Peripheral Devices and Accessories is forecast to decline 4.3% to ¥29,940 million. Overseas, the company targets a sales size of ¥4.0 billion for FY03/27.
| Item (Millions of yen) | FY03/26 Results | FY03/27 Forecast | Forecast vs. Actual | % |
|---|---|---|---|---|
| Net sales | 132,132 | 144,800 | 12,667 | 9.6% |
| Gross profit | 52,359 | 57,500 | 5,140 | 9.8% |
| SG&A expenses | 36,834 | 41,000 | 4,165 | 11.3% |
| Operating profit | 15,524 | 16,500 | 975 | 6.3% |
| Ordinary profit | 16,605 | 16,400 | (205) | -1.2% |
| Profit attributable to owners of parent | 20,191 | 11,450 | (8,741) | -43.3% |
Shareholder Returns
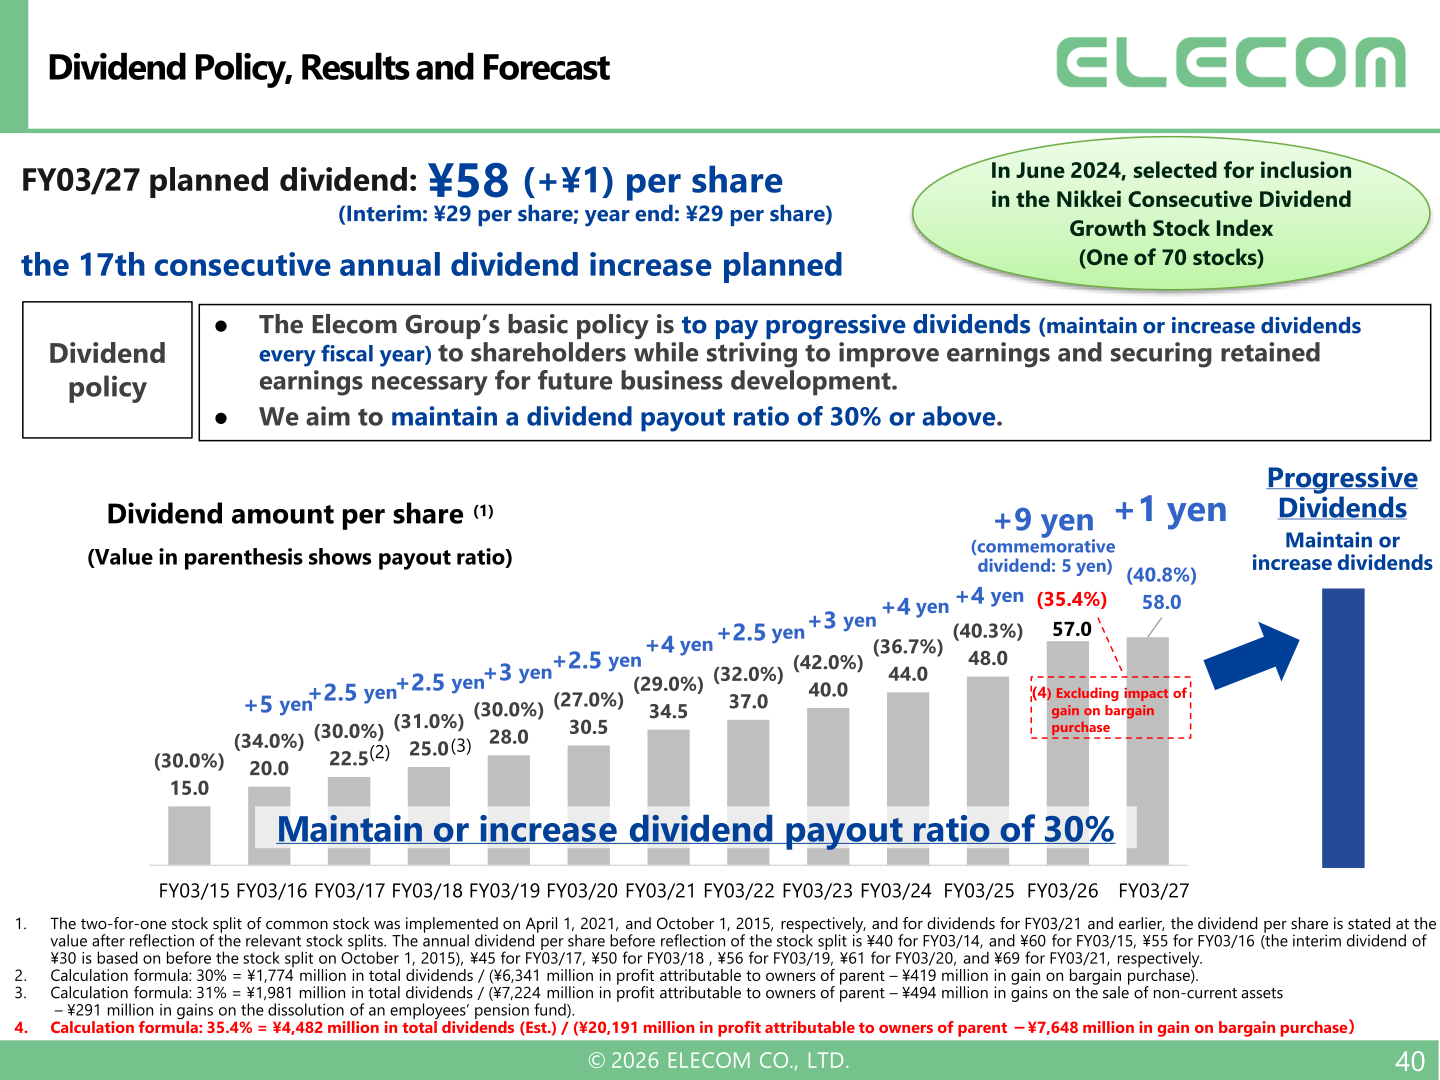
Elecom’s basic policy is to pay progressive dividends (maintain or increase dividends every fiscal year) while aiming to maintain a dividend payout ratio of 30% or above, with flexible acquisition of treasury shares; the shareholder returns slide also shows a share repurchase of ¥7.0 billion. For FY03/26, the dividend was increased by ¥9 to ¥57 per share (including a commemorative dividend of ¥5), with a payout ratio of 22.0% (35.4% excluding gain on bargain purchase); the year-end dividend will be resolved at the annual general meeting of shareholders scheduled for June 26, 2026. For FY03/27, the company plans a dividend of ¥58 per share (+¥1; interim ¥29, year-end ¥29), which would mark the 17th consecutive annual dividend increase. In June 2024, Elecom was selected for inclusion in the Nikkei Consecutive Dividend Growth Stock Index.
| Item | FY03/25 | FY03/26 | FY03/27 (Planned) |
|---|---|---|---|
| Dividend per share | ¥48 | ¥57 | ¥58 |
| Change | +¥4 | +¥9 (commemorative dividend: ¥5) | +¥1 |
| Payout ratio | 40.3% | 22.0% (35.4% excluding gain on bargain purchase) | 40.8% |
Medium-Term Plan / Financial Policy
Under the medium-term management plan, Elecom targets an operating profit growth rate averaging at least 10% per year. Operating profit grew 9.3% in FY03/25 and 14.7% in FY03/26 (2-year average 12.0%), and with the FY03/27 forecast of +6.3%, the 3-year average through the final year of the plan would be 10.0% — the company states profit growth is on track. ROE was 21.2% in FY03/26 (13.2% excluding gain on bargain purchase), above the capital cost range of 4.0-8.0% but against a numerical target of 13% or above under the plan. On returns from recent M&As, the recouped rate (estimates as of March 31, 2026) is 104.3% in 0.5 year for Nippon Antenna (¥7.67 billion invested via share exchange), 80.1% in 2.5 years for Tescom (¥9.6 billion), and 18.0% in 2.7 years for Groxi (¥1.4 billion). The company continues exploring M&A opportunities both in Japan and abroad.
This article is an analysis based on publicly available information and is not a recommendation to buy or sell any specific securities. Investment decisions are your own responsibility.
![[Obayashi] Investors’ Guide 2026 — The Complete 24-Article Breakdown](https://japan-equity.com/wp-content/uploads/2026/07/hub_cover-1024x1024.png)
![[Obayashi] IR & SR Policy — Feeding Dialogue Back into Management](https://japan-equity.com/wp-content/uploads/2026/07/p32_sq-1024x1024.jpg)
![[Obayashi] Real Estate Development — 18.7% Margin, ¥287.7bn Unrealized Gains](https://japan-equity.com/wp-content/uploads/2026/07/p20_sq-1024x1024.jpg)
![[Obayashi] Domestic Civil Engineering — Resilience Spending Supports 9.6% Margin](https://japan-equity.com/wp-content/uploads/2026/07/p11_sq-1024x1024.jpg)
![[Obayashi] Share Price & External Ratings — vs TOPIX, ESG Index Inclusion](https://japan-equity.com/wp-content/uploads/2026/07/p40_sq-1024x1024.jpg)
![[Construction] ¥75.5tn Investment, Shrinking Workforce — Big-5 Market Share](https://japan-equity.com/wp-content/uploads/2026/07/p12_sq-1024x1024.jpg)



![[Obayashi] Capital Policy & Shareholder Returns — ROE 10%+, DOE ~5%, ¥100bn Buyback](https://japan-equity.com/wp-content/uploads/2026/07/p27_sq-1024x1024.jpg)
![[Obayashi] Reducing Cross-Shareholdings — ¥285.2bn Sold in Five Years](https://japan-equity.com/wp-content/uploads/2026/07/p29_sq-1024x1024.jpg)
![[Obayashi] ¥750bn Investment Plan — ¥300bn to Development, ¥190bn to Tech/DX](https://japan-equity.com/wp-content/uploads/2026/07/p30_sq-1024x1024.jpg)
![[Obayashi] MTP2022 KPIs — Operating Profit ~2x Target, ROE 14.4%](https://japan-equity.com/wp-content/uploads/2026/07/p25_sq-1024x1024.jpg)
![[Obayashi] Cash Allocation — ¥420bn Investment CF Over Five Years](https://japan-equity.com/wp-content/uploads/2026/07/p26_sq-1024x1024.jpg)
![[Obayashi] Green Energy — 44 Plants, 344MW, and the Green Hydrogen Challenge](https://japan-equity.com/wp-content/uploads/2026/07/p21_sq-1024x1024.jpg)
![[Obayashi] Tackling the Labor Shortage — Robotics Construction®](https://japan-equity.com/wp-content/uploads/2026/07/p14_sq-1024x1024.jpg)
