
This article is based on publicly available IR materials and is not a recommendation to buy or sell any specific securities.
Note: Nohmi Bosai labels the fiscal year under review as FY2026/3 (the fiscal year ended March 31, 2026) in its presentation materials; this site classifies the most recent completed fiscal year as FY2025. Labels in the text and tables below follow the company’s materials.
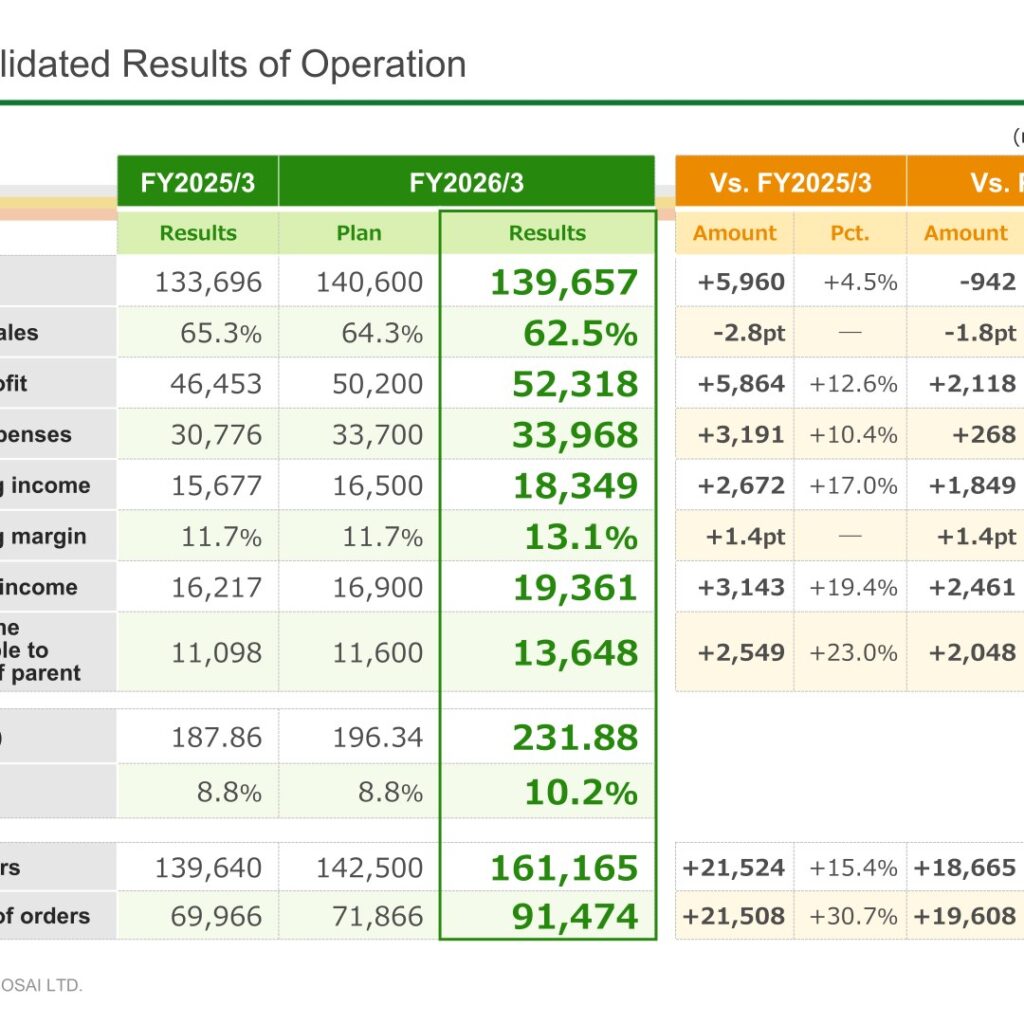
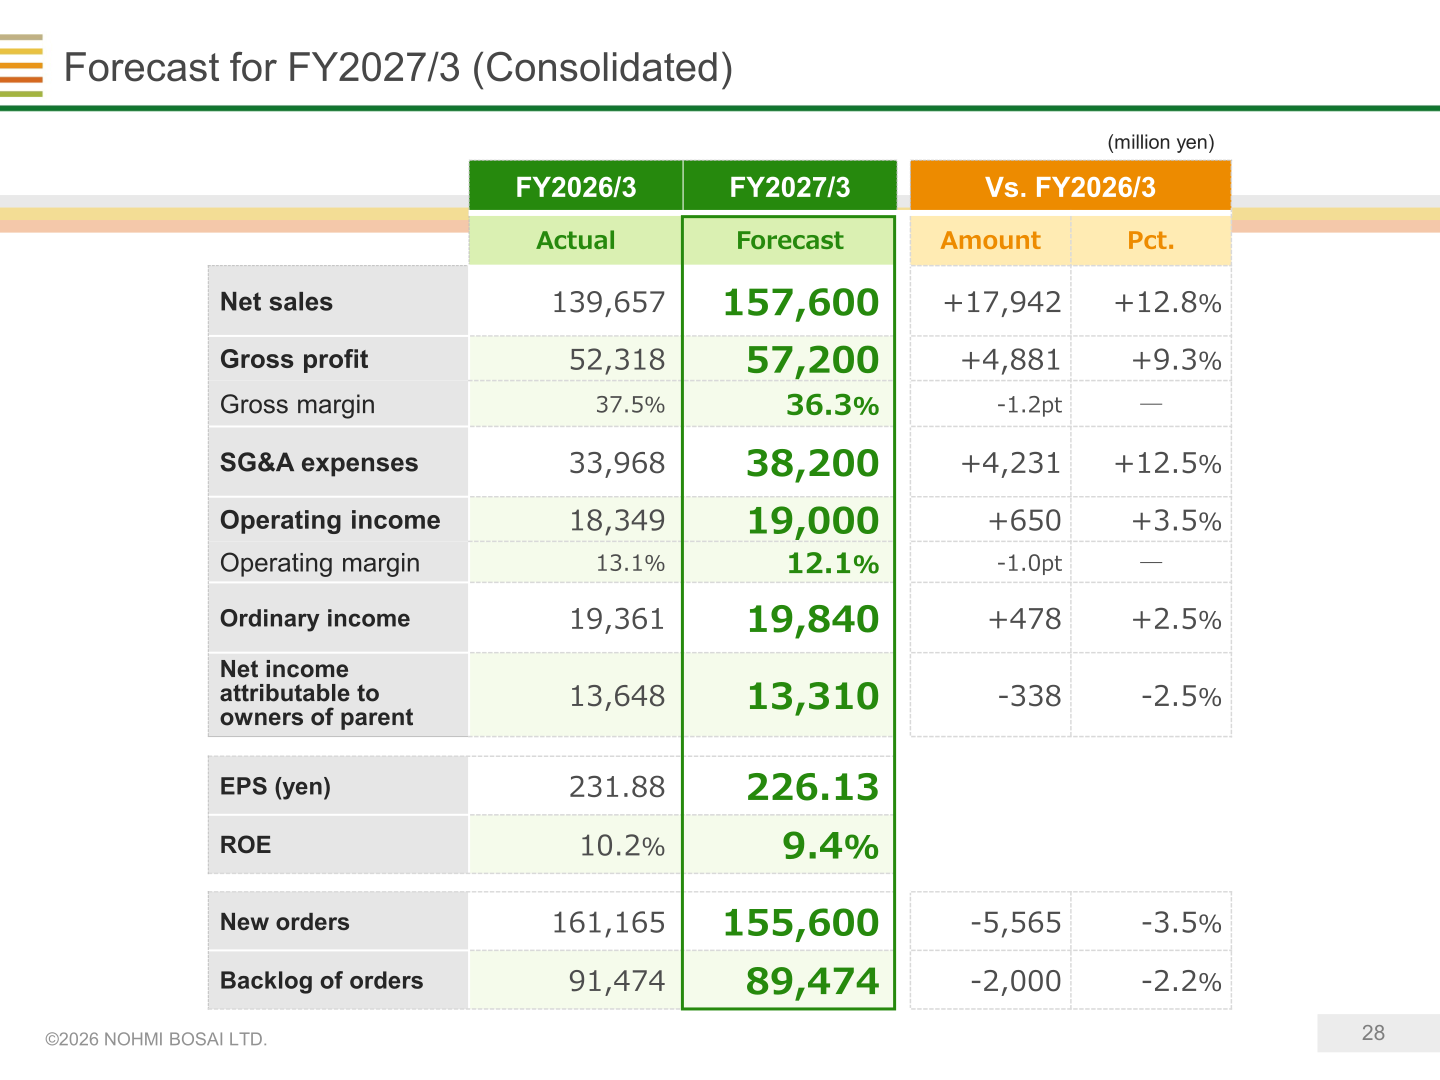
NOHMI BOSAI LTD. (6744), a comprehensive fire safety company, reported consolidated net sales of 139,657 million yen for FY2026/3, up 4.5% year on year, with operating income of 18,349 million yen (up 17.0%) and net income attributable to owners of parent of 13,648 million yen (up 23.0%). Net sales and profits increased for the third consecutive year, with both reaching record highs, while orders and the order backlog reached record highs for the fourth consecutive year. The company also achieved its Medium- to Long-Term Vision targets of an operating margin of 12% or higher and an ROE of 10% or higher.
Consolidated Results (Full-Year Actual)
The market environment in the fire protection industry remained strong, and orders increased across all segments. Against the backdrop of a favorable market environment, construction of ordered properties progressed generally smoothly, and systematic price revisions and streamlining operations in response to rising costs contributed to earnings. The cost of sales ratio improved by 2.8 points year on year to 62.5%. The company notes that financial results were more heavily concentrated in the fourth quarter than usual, and profit levels exceeded plans: operating income came in 1,849 million yen (+11.2%) above plan. New orders reached 161,165 million yen (up 15.4%) and the backlog of orders stood at 91,474 million yen (up 30.7%), both separate indicators from net sales. Figures in the tables below are in millions of yen unless otherwise noted.
| Item | FY2026/3 Results | FY2025/3 Results | Vs. FY2025/3 (Amount) | Vs. FY2025/3 (Pct.) |
|---|---|---|---|---|
| Net sales | 139,657 | 133,696 | +5,960 | +4.5% |
| Gross profit | 52,318 | 46,453 | +5,864 | +12.6% |
| SG&A expenses | 33,968 | 30,776 | +3,191 | +10.4% |
| Operating income | 18,349 | 15,677 | +2,672 | +17.0% |
| Operating margin | 13.1% | 11.7% | +1.4pt | ― |
| Ordinary income | 19,361 | 16,217 | +3,143 | +19.4% |
| Net income attributable to owners of parent | 13,648 | 11,098 | +2,549 | +23.0% |
| EPS (yen) | 231.88 | 187.86 | ― | ― |
| ROE | 10.2% | 8.8% | ― | ― |
| New orders | 161,165 | 139,640 | +21,524 | +15.4% |
| Backlog of orders | 91,474 | 69,966 | +21,508 | +30.7% |
Segment Results
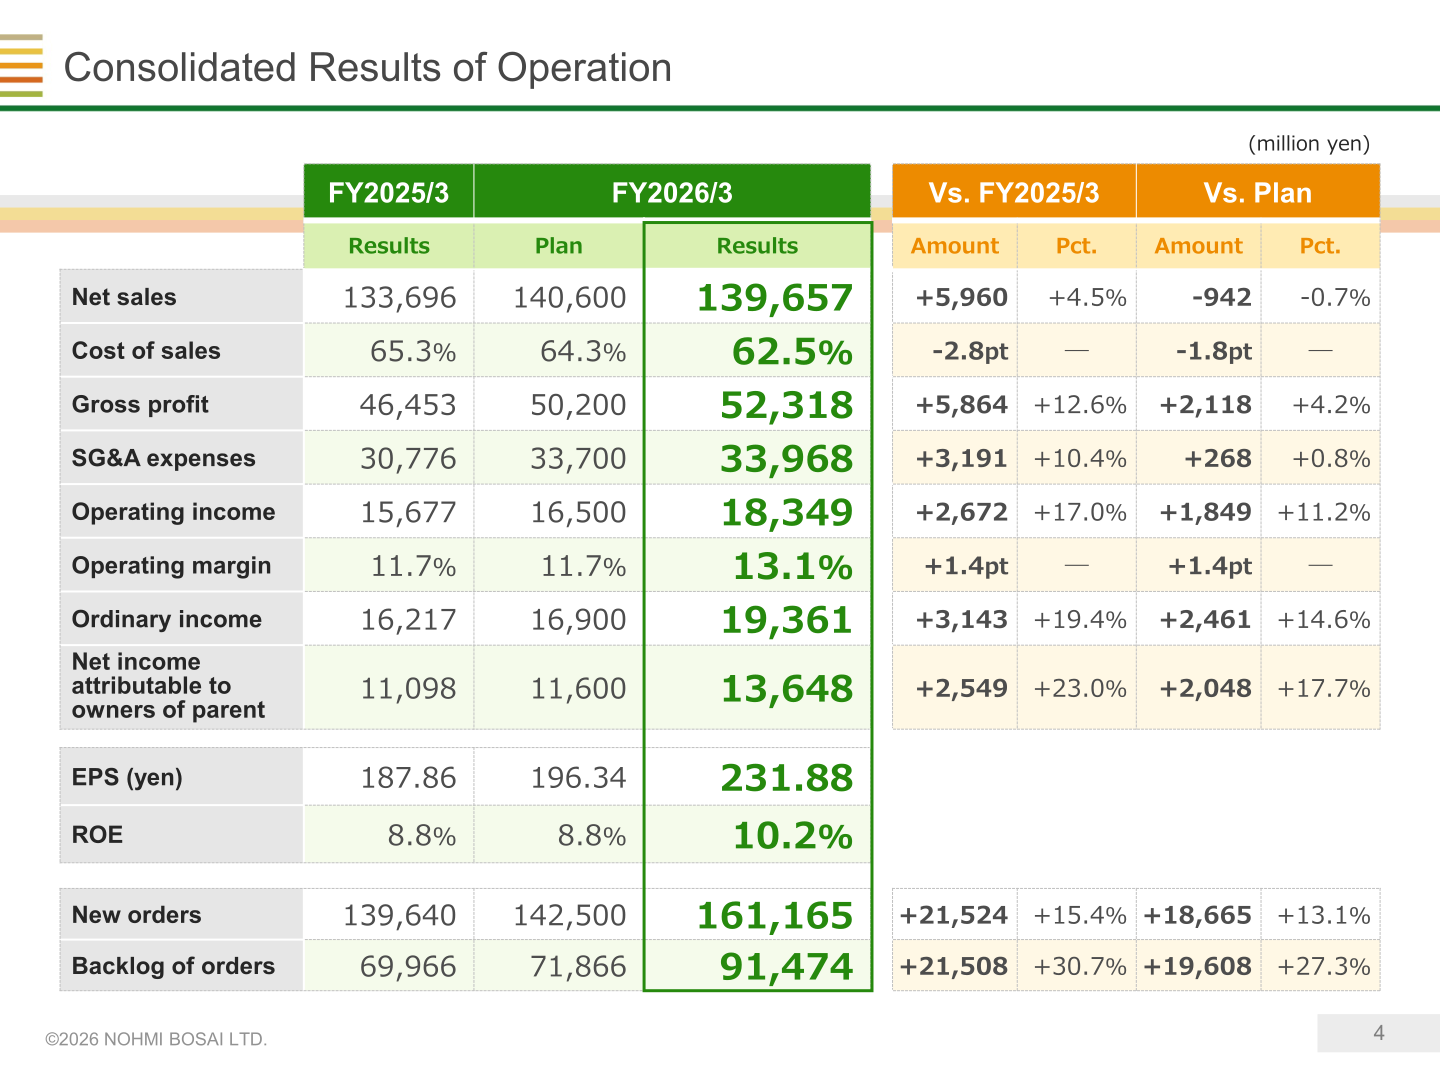
In Fire Alarm Systems, orders, backlog of orders, net sales, and segment income all reached record highs; against rising costs, systematic price revisions and streamlining operations proved effective and maintained the trend of increasing profits. In Fire Extinguishing Systems, net sales and profits increased mainly in special facilities, for which demand remained high, and orders, backlog of orders, net sales, and segment income all reached record highs for the second consecutive year. In Maintenance Services, orders, backlog of orders, and net sales continued to expand steadily and all reached record highs, but compared with the previous period there were a slightly larger number of less profitable projects and higher SG&A expenses, resulting in a decline in profit margin. Figures below are in millions of yen.
| Segment | Metric | FY2026/3 | FY2025/3 | Vs. FY2025/3 |
|---|---|---|---|---|
| Fire Alarm Systems | Net sales | 51,143 | 48,147 | +2,995 |
| Fire Alarm Systems | Operating income | 9,958 | 8,528 | +1,429 |
| Fire Extinguishing Systems | Net sales | 46,949 | 45,232 | +1,717 |
| Fire Extinguishing Systems | Operating income | 10,842 | 8,352 | +2,490 |
| Maintenance Services | Net sales | 36,734 | 34,644 | +2,090 |
| Maintenance Services | Operating income | 7,979 | 8,042 | -62 |
| Others | Net sales | 5,241 | 6,169 | -928 |
| Others | Operating income | 473 | 386 | +87 |
| Elimination/Corporate | Net sales | -411 | -497 | +85 |
| Elimination/Corporate | Operating income | -10,905 | -9,633 | -1,272 |
| Consolidated | Net sales | 139,657 | 133,696 | +5,960 |
| Consolidated | Operating income | 18,349 | 15,677 | +2,672 |
FY2027/3 Forecast
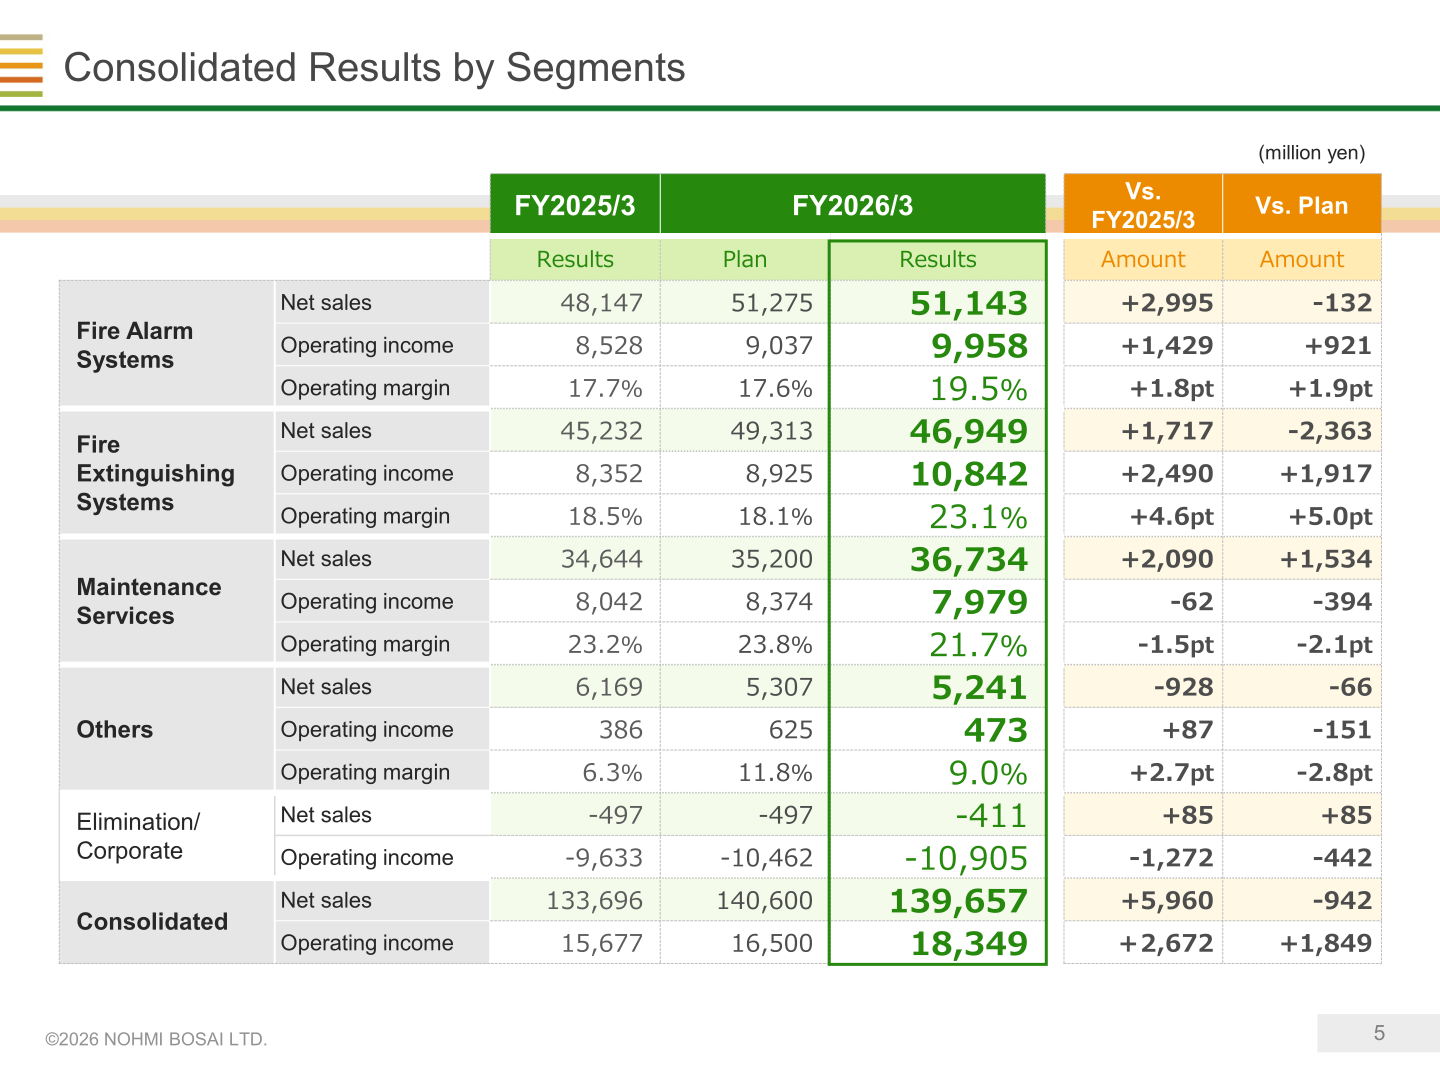
For FY2027/3, the company anticipates the market environment in the fire protection industry will remain strong, while noting it is necessary to closely monitor the impact of the situation in the Middle East on supply chains and the Japanese economy. Backed by a record-high order backlog at the beginning of the fiscal year, net sales are expected to exceed 150 billion yen for the first time, and the company plans to post record-high net sales and operating income. Considering constraints such as construction capacity, orders are expected to decline from the previous fiscal year but remain at a high level. In light of continued increases in raw material prices and labor expenses, the company will further streamline operations and revise prices again in April 2026. Figures below are in millions of yen unless otherwise noted.
| Item | FY2027/3 Forecast | FY2026/3 Actual | Vs. FY2026/3 (Amount) | Vs. FY2026/3 (Pct.) |
|---|---|---|---|---|
| Net sales | 157,600 | 139,657 | +17,942 | +12.8% |
| Gross profit | 57,200 | 52,318 | +4,881 | +9.3% |
| Operating income | 19,000 | 18,349 | +650 | +3.5% |
| Operating margin | 12.1% | 13.1% | -1.0pt | ― |
| Ordinary income | 19,840 | 19,361 | +478 | +2.5% |
| Net income attributable to owners of parent | 13,310 | 13,648 | -338 | -2.5% |
| EPS (yen) | 226.13 | 231.88 | ― | ― |
| New orders | 155,600 | 161,165 | -5,565 | -3.5% |
| Backlog of orders | 89,474 | 91,474 | -2,000 | -2.2% |
Shareholder Returns
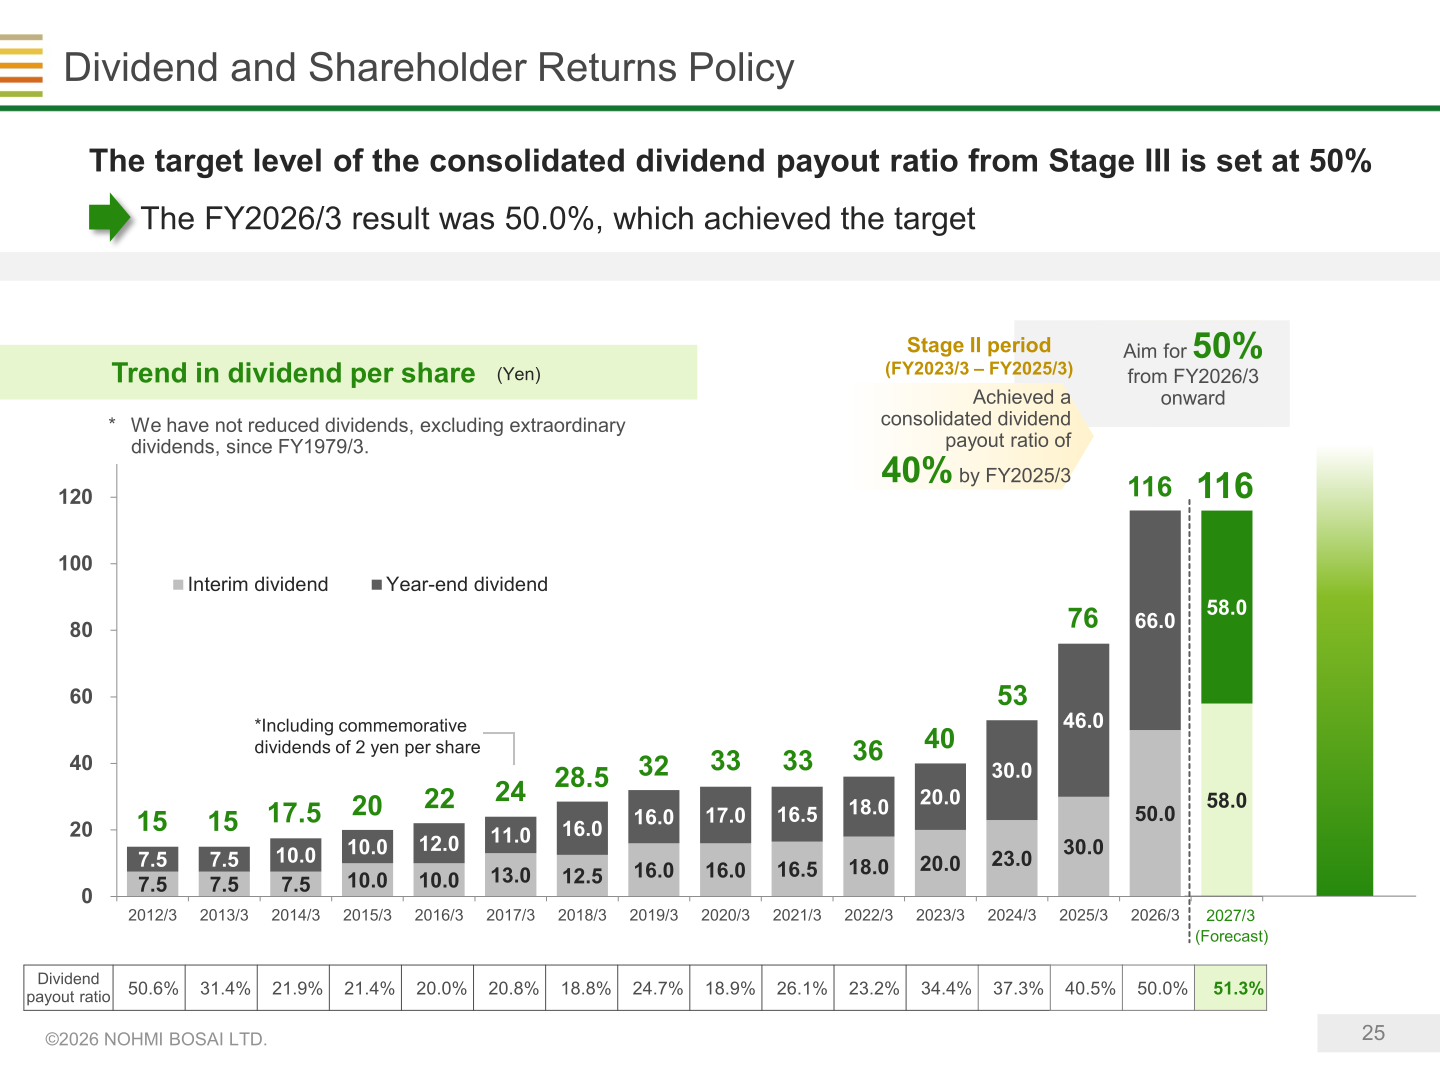
The target level of the consolidated dividend payout ratio from Stage III of the Medium- to Long-Term Vision is set at 50%, and the FY2026/3 result was 50.0%, achieving the target. The annual dividend for FY2026/3 was 116 yen per share (interim 50.0 yen, year-end 66.0 yen). For FY2027/3, the company forecasts an annual dividend of 116 yen per share (interim 58.0 yen, year-end 58.0 yen), for a forecast dividend payout ratio of 51.3%. The company states it has not reduced dividends, excluding extraordinary dividends, since FY1979/3. Under the Stage III capital allocation policy (FY2026/3–FY2029/3), the company plans a four-year cumulative operating cash flow of 56 billion yen, growth investment of 44 billion yen and upward, facility maintenance and renewal of 6 billion yen, and dividends of 26 billion yen; investment of about 13 billion yen has already been made, mainly in M&A.
Medium- to Long-Term Plan / Topics
FY2026/3 was the first year of Stage III (FY2026/3 to FY2029/3) of the Nohmi Bosai Group Medium- to Long-Term Vision 2028. The company states that in the first year of Stage III it achieved the targets for three indicators, but since temporary factors also contributed, it will continue working to achieve the target level. Priority measures are: (1) expand earnings and improve profit margins in existing businesses, (2) business expansion through active engagement in mergers and acquisitions in domains related to disaster prevention and peripheral industries, and (3) new business creation and upscaling. In Stage III the company has made Hokko Tsushin Co., Ltd. (July 2025), Sefuto Co., Ltd. (September 2025), Prime Value Co., Ltd. (September 2025), and Meisei Electric Co., Ltd. (February 2026) subsidiaries.
| Indicator | FY2025/3 Actual | FY2026/3 Actual | FY2029/3 Target |
|---|---|---|---|
| Net sales | 133.6 billion yen | 139.6 billion yen | 170 billion yen or more |
| Operating margin | 11.7% | 13.1% | 12.0% or higher |
| ROE | 8.8% | 10.2% | 10.0% or higher |
| Dividend payout ratio | 40.5% | 50.0% | 50.0% |
This article is an analysis based on publicly available information and is not a recommendation to buy or sell any specific securities. Investment decisions are your own responsibility.
![[Obayashi] Investors’ Guide 2026 — The Complete 24-Article Breakdown](https://japan-equity.com/wp-content/uploads/2026/07/hub_cover-1024x1024.png)
![[Obayashi] IR & SR Policy — Feeding Dialogue Back into Management](https://japan-equity.com/wp-content/uploads/2026/07/p32_sq-1024x1024.jpg)
![[Obayashi] Real Estate Development — 18.7% Margin, ¥287.7bn Unrealized Gains](https://japan-equity.com/wp-content/uploads/2026/07/p20_sq-1024x1024.jpg)
![[Obayashi] Domestic Civil Engineering — Resilience Spending Supports 9.6% Margin](https://japan-equity.com/wp-content/uploads/2026/07/p11_sq-1024x1024.jpg)
![[Obayashi] Share Price & External Ratings — vs TOPIX, ESG Index Inclusion](https://japan-equity.com/wp-content/uploads/2026/07/p40_sq-1024x1024.jpg)
![[Construction] ¥75.5tn Investment, Shrinking Workforce — Big-5 Market Share](https://japan-equity.com/wp-content/uploads/2026/07/p12_sq-1024x1024.jpg)



![[Obayashi] Capital Policy & Shareholder Returns — ROE 10%+, DOE ~5%, ¥100bn Buyback](https://japan-equity.com/wp-content/uploads/2026/07/p27_sq-1024x1024.jpg)
![[Obayashi] Reducing Cross-Shareholdings — ¥285.2bn Sold in Five Years](https://japan-equity.com/wp-content/uploads/2026/07/p29_sq-1024x1024.jpg)
![[Obayashi] ¥750bn Investment Plan — ¥300bn to Development, ¥190bn to Tech/DX](https://japan-equity.com/wp-content/uploads/2026/07/p30_sq-1024x1024.jpg)
![[Obayashi] MTP2022 KPIs — Operating Profit ~2x Target, ROE 14.4%](https://japan-equity.com/wp-content/uploads/2026/07/p25_sq-1024x1024.jpg)
![[Obayashi] Cash Allocation — ¥420bn Investment CF Over Five Years](https://japan-equity.com/wp-content/uploads/2026/07/p26_sq-1024x1024.jpg)
![[Obayashi] Green Energy — 44 Plants, 344MW, and the Green Hydrogen Challenge](https://japan-equity.com/wp-content/uploads/2026/07/p21_sq-1024x1024.jpg)
![[Obayashi] Tackling the Labor Shortage — Robotics Construction®](https://japan-equity.com/wp-content/uploads/2026/07/p14_sq-1024x1024.jpg)
