
This article is based on publicly available IR materials and is not a recommendation to buy or sell any specific securities.
Note: The company’s English presentation is titled “FY 2025 Financial Results” (dated May 15, 2026) and covers the fiscal year ending March 2026; its tables label the period “2026/3”, and those labels are kept as-is below.
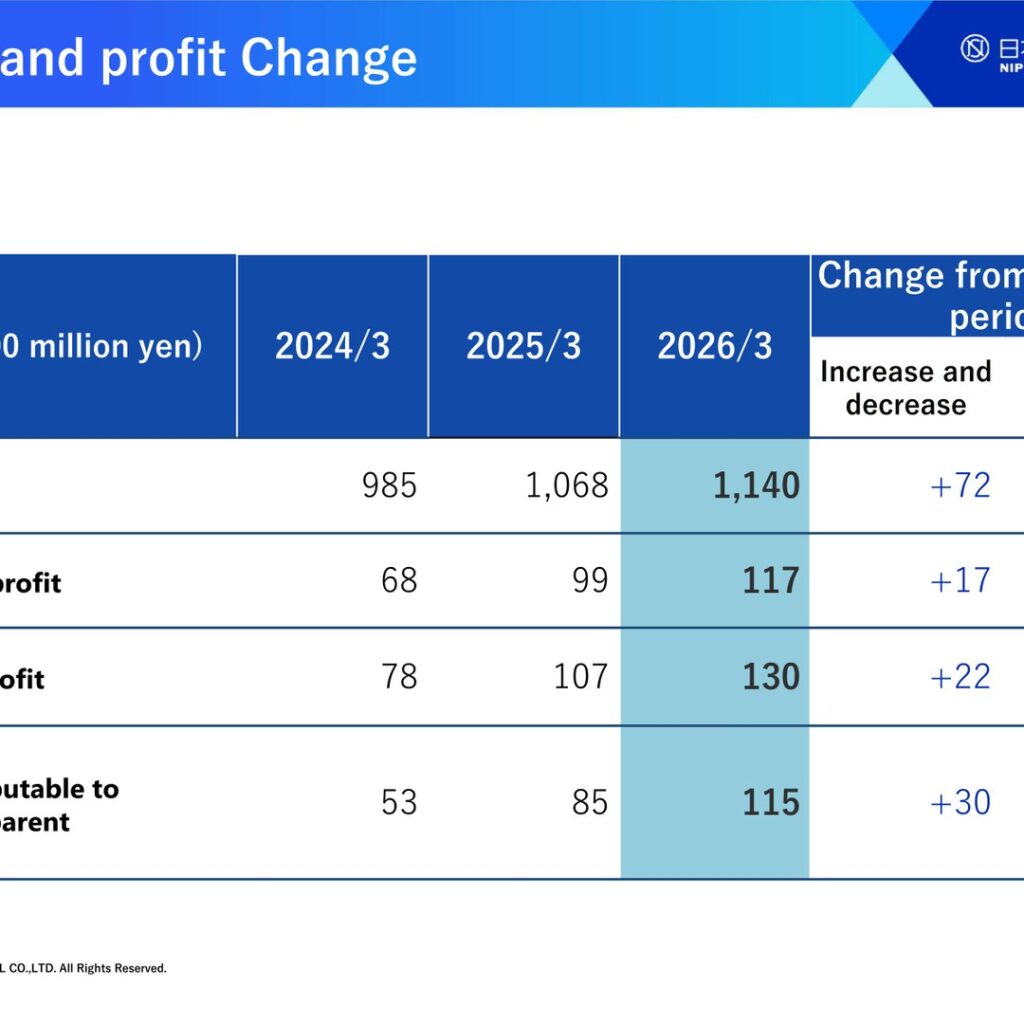
NIPPON SIGNAL CO., Ltd. (Securities Code: 6741) reported consolidated results for the fiscal year ending March 2026 with net sales of 114.0 billion yen (+7.2 billion yen year to year), operating profit of 11.7 billion yen (+1.7 billion yen), ordinary profit of 13.0 billion yen (+2.2 billion yen), and profit attributable to owners of parent of 11.5 billion yen (+3.0 billion yen). Sales and all profit lines reached record highs, with both the Transportation Infrastructure and ICT Solutions businesses performing steadily and achieving sales and profit growth for the third consecutive year. Net profit increased due to extraordinary gains from the sale of investment securities and idle assets.
Consolidated Results (Full-Year Actual)
The table below shows the three-year trend in consolidated results (unit: 100 million yen). Sales rose +6.7% year on year, operating profit +18.1%, ordinary profit +20.7%, and profit attributable to owners of parent +36.3%.
| Item | 2024/3 | 2025/3 | 2026/3 | Increase and decrease | Rate of increase or decrease |
|---|---|---|---|---|---|
| Sales | 985 | 1,068 | 1,140 | +72 | +6.7% |
| Operating profit | 68 | 99 | 117 | +17 | +18.1% |
| Ordinary profit | 78 | 107 | 130 | +22 | +20.7% |
| Profit attributable to owners of parent | 53 | 85 | 115 | +30 | +36.3% |
On the balance-sheet side (unit: 100 million yen), total assets stood at 1,722 (+59 from the previous period), equity capital at 1,143 (+117), and interest-bearing debts at 155 (▲37). The capital adequacy ratio improved to 66.4% (+4.7pt), ROE to 10.7% (+2.2pt), and ROIC to 7.4% (+0.5pt). PBR rose to 0.87x (+0.33pt), with the year-end stock price at 1,600 yen (+705 yen) shown as reference.
Segment Results
In the Transportation Infrastructure business, Railway Signal is the main business, and Smart Mobility sales increased, resulting in higher sales and profit year on year. The ICT Solution business posted higher revenue and profit, mainly due to an increase in domestic AFC projects. In AFC, measures to accommodate the new banknotes were mostly finished, but increases in automatic passenger gates and platform screen doors more than offset the decline. (Unit: 100 million yen)
| Segment | 2025/3 Sales | 2025/3 Segment profit | 2026/3 Sales | 2026/3 Segment profit | Change (Sales) | Change (Segment profit) |
|---|---|---|---|---|---|---|
| Transport infrastructure business | 565 | 45 | 591 | 51 | +26 | +6 |
| ICT solution business | 502 | 89 | 549 | 105 | +46 | +16 |
| Corporate expenses | − | ▲35 | − | ▲40 | − | ▲4 |
| Total | 1,068 | 99 | 1,140 | 117 | +72 | +17 |
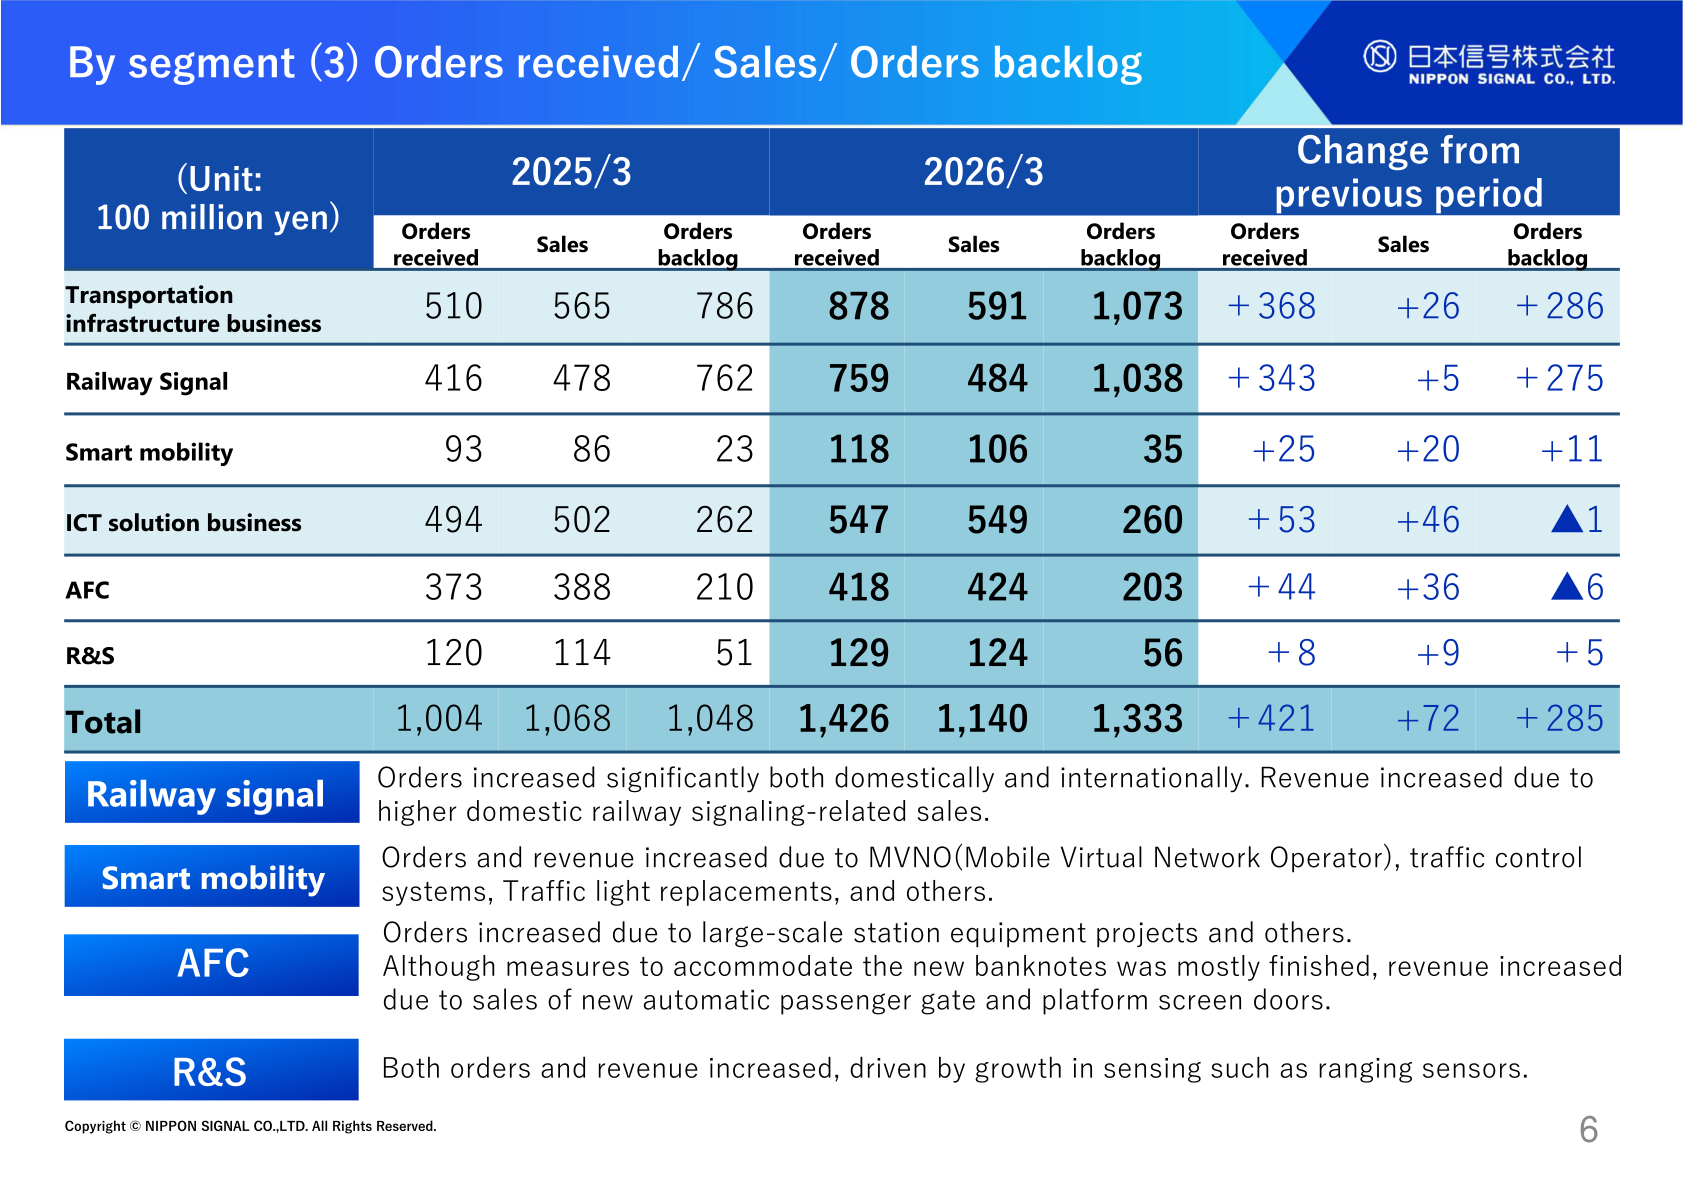
Orders received and the order backlog are disclosed separately from sales. Orders increased significantly both domestically and internationally in Railway Signal, and Smart Mobility orders and revenue increased due to MVNO (Mobile Virtual Network Operator), traffic control systems, traffic light replacements, and others. AFC orders increased due to large-scale station equipment projects and others, and in R&S both orders and revenue increased, driven by growth in sensing such as ranging sensors. (Unit: 100 million yen)
| Segment | 2026/3 Orders received | 2026/3 Sales | 2026/3 Orders backlog | Change (Orders received) | Change (Sales) | Change (Orders backlog) |
|---|---|---|---|---|---|---|
| Transportation infrastructure business | 878 | 591 | 1,073 | +368 | +26 | +286 |
| — Railway Signal | 759 | 484 | 1,038 | +343 | +5 | +275 |
| — Smart mobility | 118 | 106 | 35 | +25 | +20 | +11 |
| ICT solution business | 547 | 549 | 260 | +53 | +46 | ▲1 |
| — AFC | 418 | 424 | 203 | +44 | +36 | ▲6 |
| — R&S | 129 | 124 | 56 | +8 | +9 | +5 |
| Total | 1,426 | 1,140 | 1,333 | +421 | +72 | +285 |
Overseas, total orders received were 306 (+219 from the previous period), sales 142 (+1), and the order backlog 737 (+164) (unit: 100 million yen). Revenue was broadly flat, but the order backlog reached a record high due to large orders. In the overseas Transportation Infrastructure business, orders increased significantly due to a large order for the Taiwan 3rd-generation CTC center equipment renewal project, while revenue decreased depending on the progress of large projects accounted for under the percentage-of-completion method. Overseas ICT solution revenue was mostly related to platform screen door projects for Egypt’s Cairo Metro Line 4.
Forecast for the Fiscal Year Ending March 2027
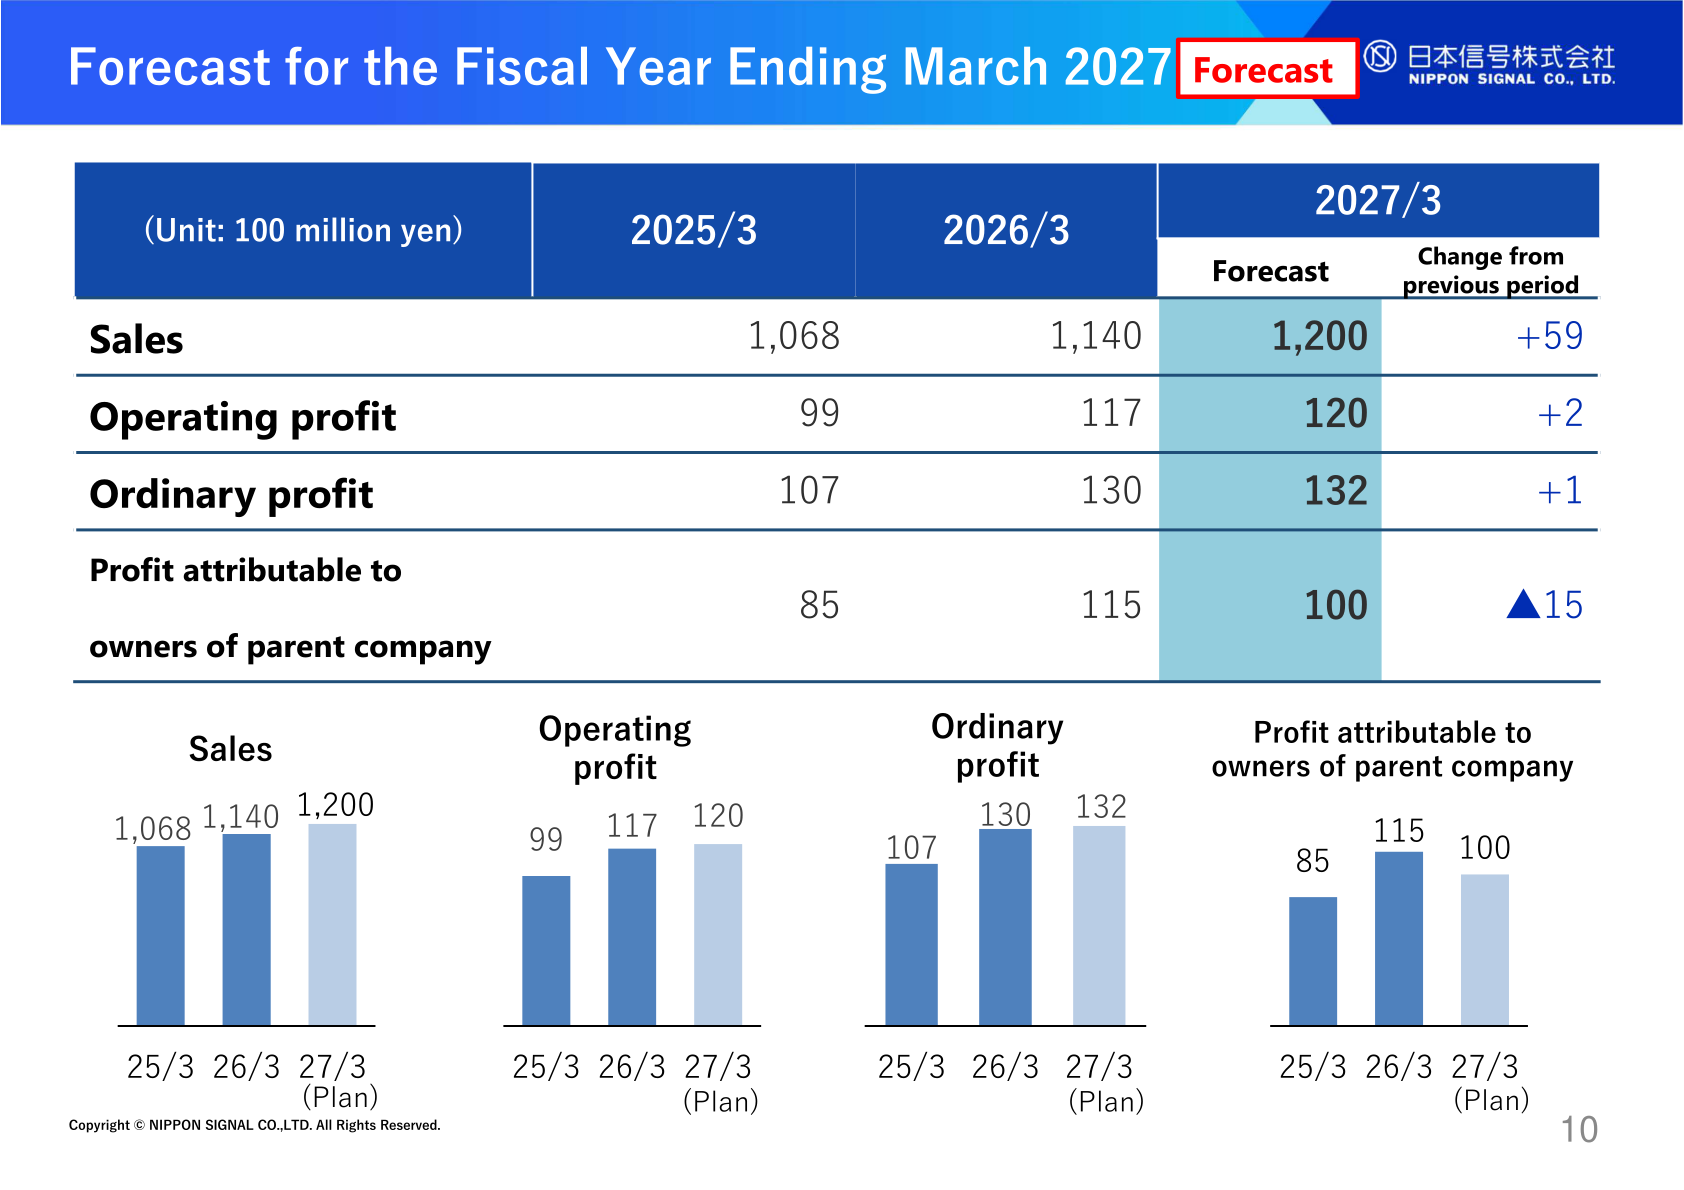
Based on record-high orders and order backlog, the company forecasts higher revenue and increases in operating and ordinary profit for the fiscal year ending March 2027 (unit: 100 million yen). By segment, profit is forecast at 53 (+1) for the Transportation Infrastructure business and 107 (+1) for the ICT solution business, with corporate expenses of ▲40 (+0), for a total of 120 (+2). Total orders received are forecast at 1,300 (▲126), sales at 1,200 (+59), and the order backlog at 1,433 (+100).
| Item | 2025/3 | 2026/3 | 2027/3 Forecast | Change from previous period |
|---|---|---|---|---|
| Sales | 1,068 | 1,140 | 1,200 | +59 |
| Operating profit | 99 | 117 | 120 | +2 |
| Ordinary profit | 107 | 130 | 132 | +1 |
| Profit attributable to owners of parent company | 85 | 115 | 100 | ▲15 |
Shareholder Returns
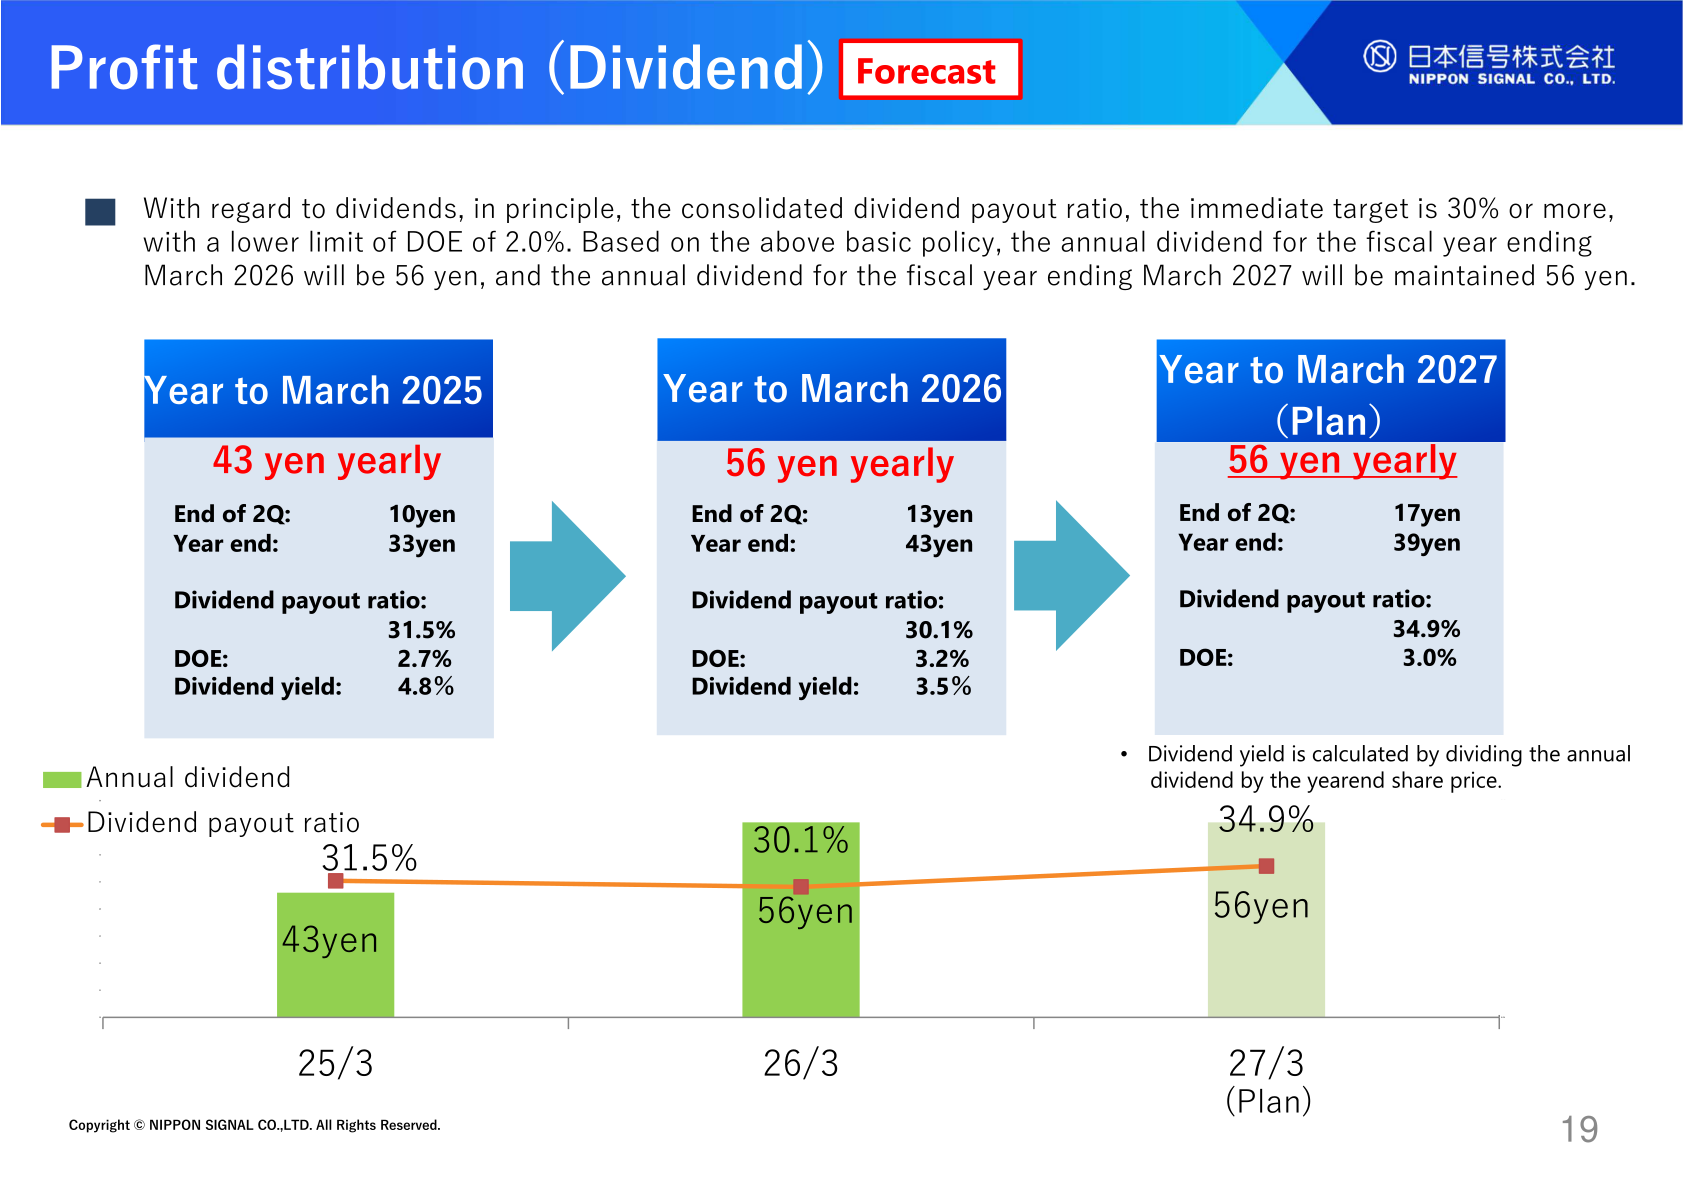
With regard to dividends, in principle, the immediate target for the consolidated dividend payout ratio is 30% or more, with a lower limit of DOE of 2.0%. For the fiscal year ending March 2026, the annual dividend is 56 yen (interim dividend 13 yen, year-end dividend 43 yen — a 6 yen increase from the February plan), with a dividend payout ratio of 30.1%, DOE of 3.2%, and dividend yield of 3.5%. For the fiscal year ending March 2027, the annual dividend will be maintained at 56 yen (interim dividend 17 yen, year-end dividend 39 yen), with a planned payout ratio of 34.9% and DOE of 3.0%. The prior year (year to March 2025) dividend was 43 yen yearly with a payout ratio of 31.5%, DOE of 2.7%, and dividend yield of 4.8%. The company notes that dividend yield is calculated by dividing the annual dividend by the year-end share price.
Capital Strategy / Reduction of Cross-Shareholdings
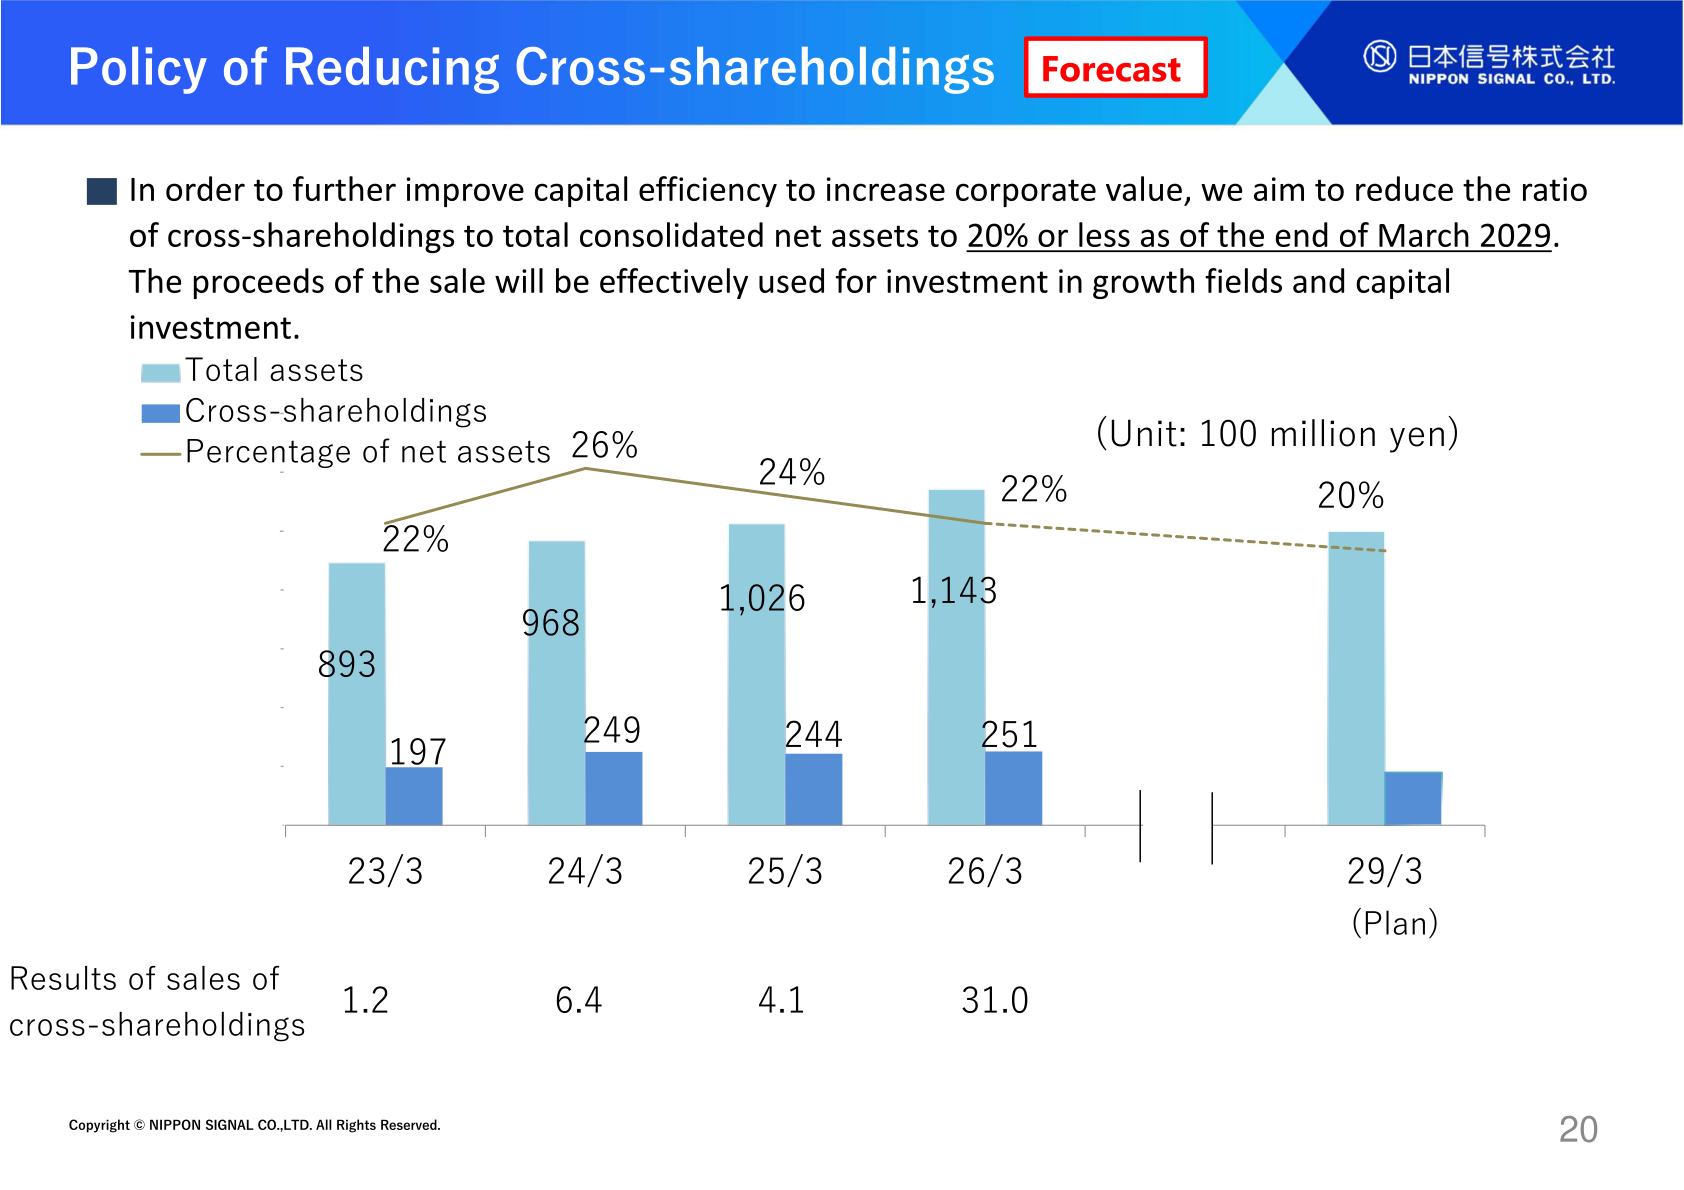
The company states that it performs well-balanced management between investment for growth and return of profit to shareholders while maintaining financial soundness. To further improve capital efficiency and increase corporate value, it aims to reduce the ratio of cross-shareholdings to total consolidated net assets to 20% or less as of the end of March 2029, from 22% at 2026/3 (cross-shareholdings of 251 against total assets of 1,143; unit: 100 million yen). Sales of cross-shareholdings in 2026/3 amounted to 31.0 (unit: 100 million yen), and the proceeds of sales will be effectively used for investment in growth fields and capital investment.
This article is an analysis based on publicly available information and is not a recommendation to buy or sell any specific securities. Investment decisions are your own responsibility.
![[Obayashi] Investors’ Guide 2026 — The Complete 24-Article Breakdown](https://japan-equity.com/wp-content/uploads/2026/07/hub_cover-1024x1024.png)
![[Obayashi] IR & SR Policy — Feeding Dialogue Back into Management](https://japan-equity.com/wp-content/uploads/2026/07/p32_sq-1024x1024.jpg)
![[Obayashi] Real Estate Development — 18.7% Margin, ¥287.7bn Unrealized Gains](https://japan-equity.com/wp-content/uploads/2026/07/p20_sq-1024x1024.jpg)
![[Obayashi] Domestic Civil Engineering — Resilience Spending Supports 9.6% Margin](https://japan-equity.com/wp-content/uploads/2026/07/p11_sq-1024x1024.jpg)
![[Obayashi] Share Price & External Ratings — vs TOPIX, ESG Index Inclusion](https://japan-equity.com/wp-content/uploads/2026/07/p40_sq-1024x1024.jpg)
![[Construction] ¥75.5tn Investment, Shrinking Workforce — Big-5 Market Share](https://japan-equity.com/wp-content/uploads/2026/07/p12_sq-1024x1024.jpg)



![[Obayashi] Capital Policy & Shareholder Returns — ROE 10%+, DOE ~5%, ¥100bn Buyback](https://japan-equity.com/wp-content/uploads/2026/07/p27_sq-1024x1024.jpg)
![[Obayashi] Reducing Cross-Shareholdings — ¥285.2bn Sold in Five Years](https://japan-equity.com/wp-content/uploads/2026/07/p29_sq-1024x1024.jpg)
![[Obayashi] ¥750bn Investment Plan — ¥300bn to Development, ¥190bn to Tech/DX](https://japan-equity.com/wp-content/uploads/2026/07/p30_sq-1024x1024.jpg)
![[Obayashi] MTP2022 KPIs — Operating Profit ~2x Target, ROE 14.4%](https://japan-equity.com/wp-content/uploads/2026/07/p25_sq-1024x1024.jpg)
![[Obayashi] Cash Allocation — ¥420bn Investment CF Over Five Years](https://japan-equity.com/wp-content/uploads/2026/07/p26_sq-1024x1024.jpg)
![[Obayashi] Green Energy — 44 Plants, 344MW, and the Green Hydrogen Challenge](https://japan-equity.com/wp-content/uploads/2026/07/p21_sq-1024x1024.jpg)
![[Obayashi] Tackling the Labor Shortage — Robotics Construction®](https://japan-equity.com/wp-content/uploads/2026/07/p14_sq-1024x1024.jpg)
