
This article is based on publicly available IR materials and is not a recommendation to buy or sell any specific securities.
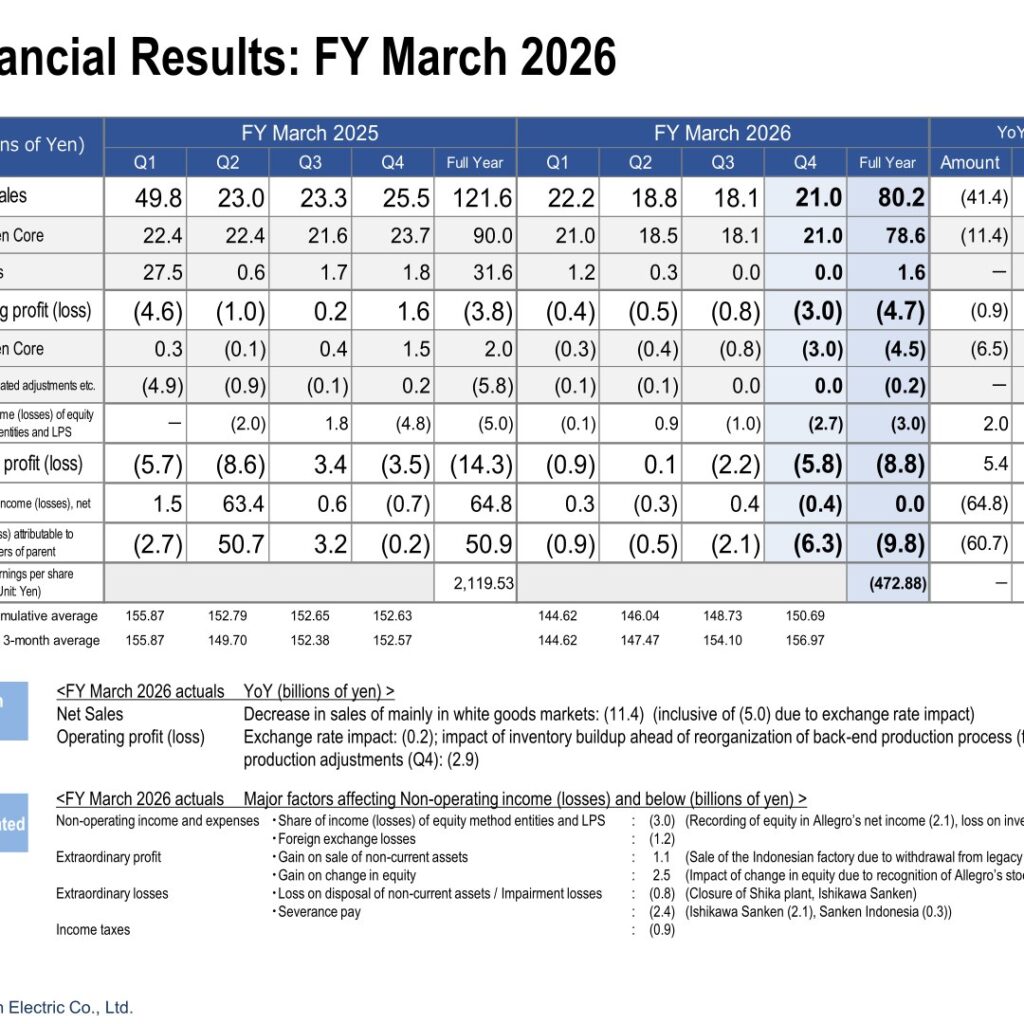
Note: Sanken Electric labels the fiscal year ended March 31, 2026 as “FY March 2026” (FY 3/26) and the year ending March 31, 2027 as “FY March 2027”; the text and tables below keep the company’s own labels. For FY March 2026, Sanken Electric reported consolidated net sales of 80.2 billion yen, down 41.4 billion yen (34.1%) year on year, as the “Others” category (the legacy unit business) shrank to 1.6 billion yen from 31.6 billion yen. Sanken Core net sales fell 11.4 billion yen (12.7%) to 78.6 billion yen, mainly on lower sales in white goods markets. The company posted an operating loss of 4.7 billion yen (Sanken Core: operating loss of 4.5 billion yen), an ordinary loss of 8.8 billion yen and a loss attributable to owners of parent of 9.8 billion yen. For FY March 2027 the company forecasts net sales of 86.5 billion yen, operating profit of 1.4 billion yen and profit attributable to owners of parent of 1.0 billion yen, and it continues to suspend dividend payments for FY March 2026.
Consolidated Results (Full-Year Actual)
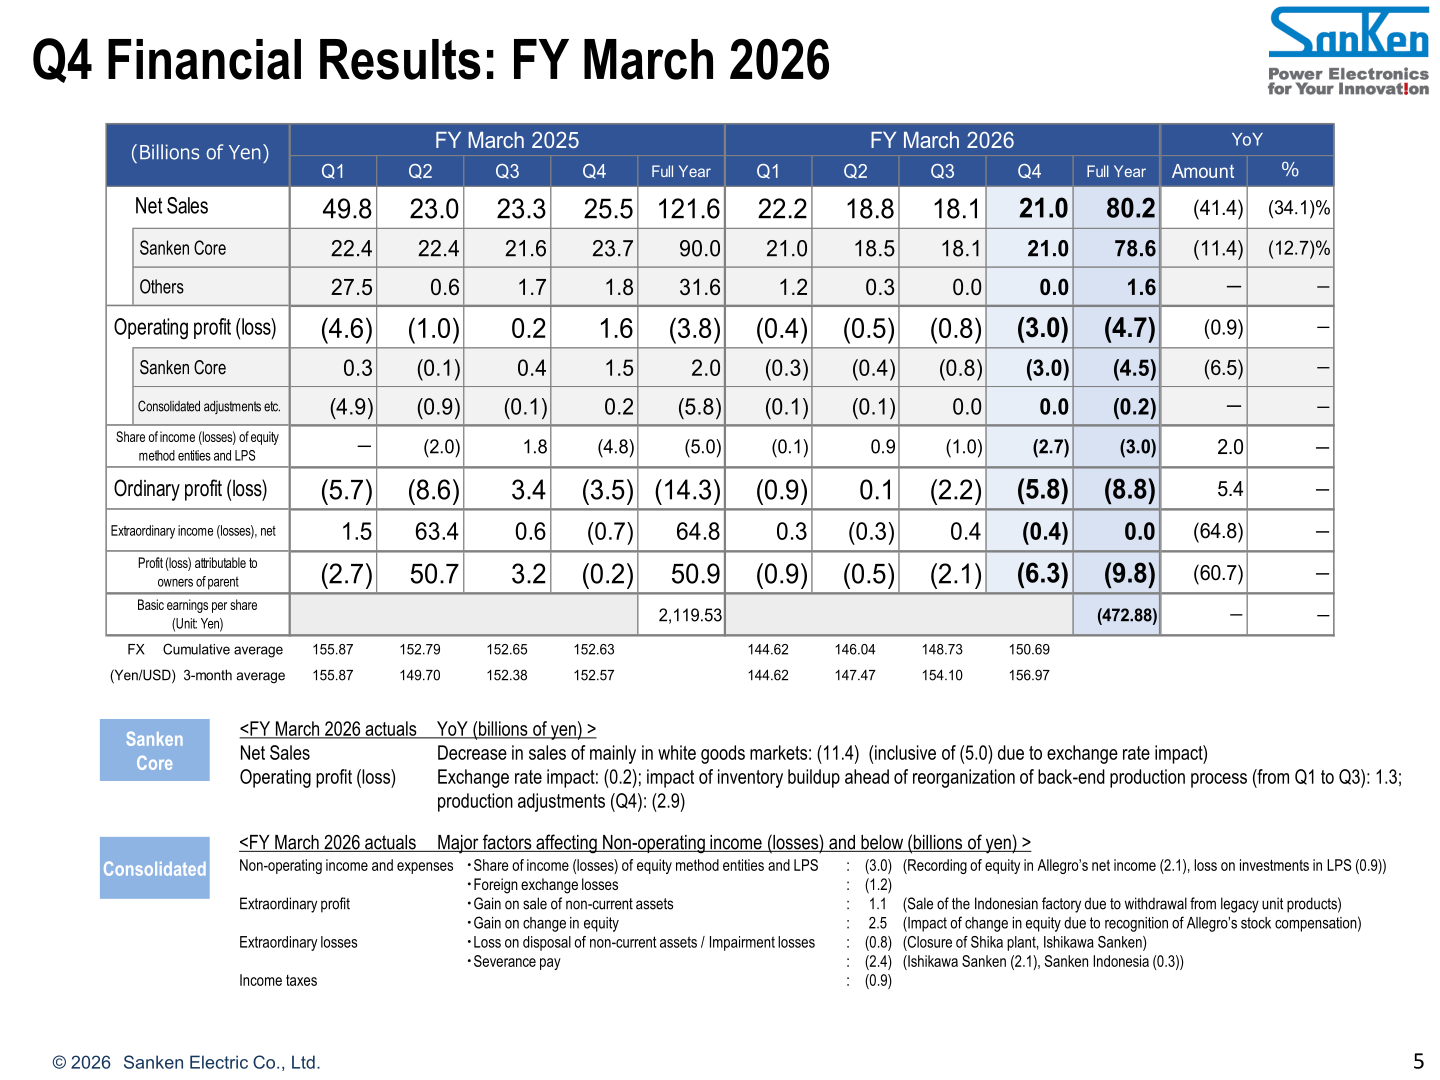
Consolidated net sales for FY March 2026 were 80.2 billion yen, against 121.6 billion yen in FY March 2025, a decrease of 41.4 billion yen (34.1%). Sanken Core net sales were 78.6 billion yen (90.0 billion yen a year earlier), down 11.4 billion yen (12.7%), which the company attributes to a decrease in sales mainly in white goods markets, inclusive of a 5.0 billion yen negative exchange rate impact. Net sales in Others were 1.6 billion yen (31.6 billion yen). The consolidated operating loss was 4.7 billion yen, compared with an operating loss of 3.8 billion yen in the previous year; Sanken Core recorded an operating loss of 4.5 billion yen against an operating profit of 2.0 billion yen a year earlier (down 6.5 billion yen), with the company citing an exchange rate impact of (0.2) billion yen, a 1.3 billion yen positive impact from inventory buildup ahead of the reorganization of the back-end production process (Q1 to Q3), and (2.9) billion yen from production adjustments in Q4. Share of income (losses) of equity method entities and LPS was (3.0) billion yen, consisting of equity in Allegro’s net income of (2.1) billion yen and a loss on investments in LPS of (0.9) billion yen, and foreign exchange losses were (1.2) billion yen, leaving an ordinary loss of 8.8 billion yen (ordinary loss of 14.3 billion yen a year earlier). Extraordinary income (losses), net, was 0.0 billion yen, comprising a gain on sale of non-current assets of 1.1 billion yen (sale of the Indonesian factory due to withdrawal from legacy unit products), a gain on change in equity of 2.5 billion yen (impact of change in equity due to recognition of Allegro’s stock compensation), loss on disposal of non-current assets / impairment losses of (0.8) billion yen (closure of the Shika plant, Ishikawa Sanken) and severance pay of (2.4) billion yen (Ishikawa Sanken (2.1), Sanken Indonesia (0.3)); a year earlier extraordinary income was 64.8 billion yen. After income taxes of (0.9) billion yen, the loss attributable to owners of parent was 9.8 billion yen, against a profit of 50.9 billion yen in FY March 2025. Basic earnings per share were (472.88) yen (2,119.53 yen). The cumulative average exchange rate was 150.69 yen per U.S. dollar (152.63 yen). Versus the forecast announced in November, net sales were 1.4 billion yen (1.8%) higher at 80.2 billion yen (forecast 78.8 billion yen) and the operating loss was 1.3 billion yen smaller than the forecast loss of 6.0 billion yen, while the loss attributable to owners of parent was 0.1 billion yen wider than the forecast loss of 9.7 billion yen.
| Item (Billions of Yen) | FY March 2026 | FY March 2025 | YoY Amount | YoY % |
|---|---|---|---|---|
| Net Sales | 80.2 | 121.6 | (41.4) | (34.1)% |
| — Sanken Core | 78.6 | 90.0 | (11.4) | (12.7)% |
| — Others | 1.6 | 31.6 | - | - |
| Operating profit (loss) | (4.7) | (3.8) | (0.9) | - |
| — Sanken Core | (4.5) | 2.0 | (6.5) | - |
| — Consolidated adjustments etc. | (0.2) | (5.8) | - | - |
| Share of income (losses) of equity method entities and LPS | (3.0) | (5.0) | 2.0 | - |
| Ordinary profit (loss) | (8.8) | (14.3) | 5.4 | - |
| Extraordinary income (losses), net | 0.0 | 64.8 | (64.8) | - |
| Profit (loss) attributable to owners of parent | (9.8) | 50.9 | (60.7) | - |
| Basic earnings per share (Yen) | (472.88) | 2,119.53 | - | - |
| FX (Yen/USD), cumulative average | 150.69 | 152.63 |
On the balance sheet, the equity ratio was 50.1% as of March 31, 2026, against 56.9% as of March 31, 2025 and 31.1% as of March 31, 2024, and the D/E ratio was 0.67x (0.43x and 1.18x, respectively). The company describes this as continuing to maintain the strengthened financial structure.
Sales by Market
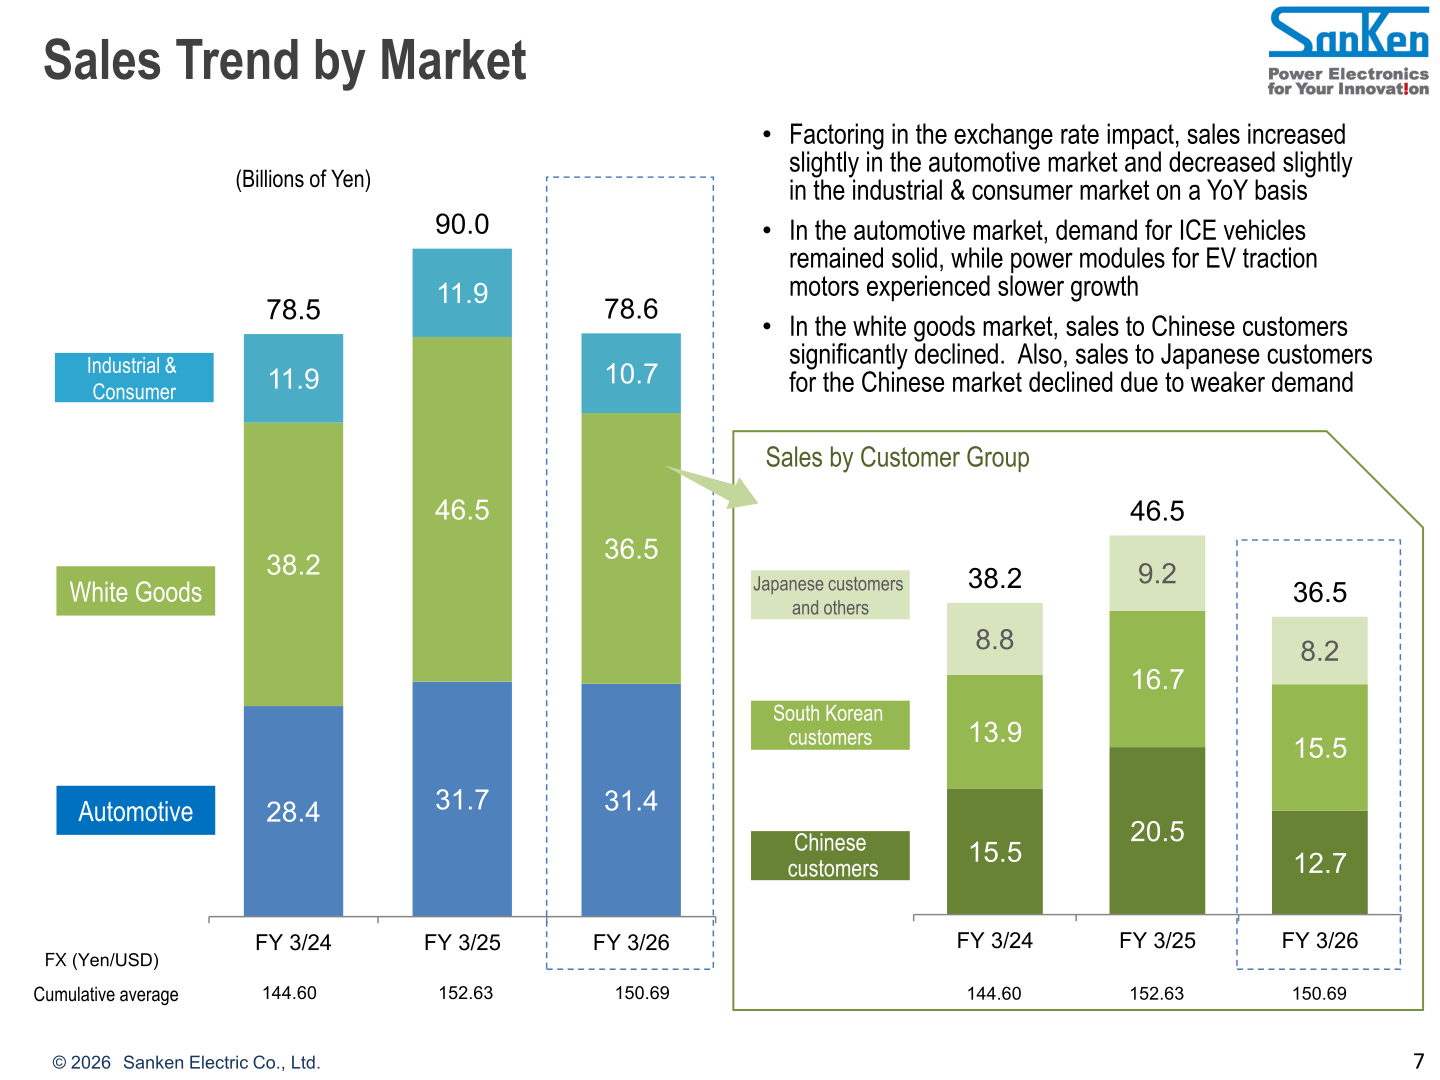
Sanken Core net sales of 78.6 billion yen in FY 3/26 broke down into 31.4 billion yen in the automotive market (31.7 billion yen in FY 3/25), 36.5 billion yen in white goods (46.5 billion yen) and 10.7 billion yen in industrial & consumer (11.9 billion yen). Factoring in the exchange rate impact, the company says sales increased slightly in the automotive market and decreased slightly in the industrial & consumer market on a year-on-year basis. In the automotive market, demand for ICE vehicles remained solid, while power modules for EV traction motors experienced slower growth. In the white goods market, sales to Chinese customers significantly declined, and sales to Japanese customers for the Chinese market also declined due to weaker demand. By customer group, white goods sales to Chinese customers were 12.7 billion yen (20.5 billion yen in FY 3/25), to South Korean customers 15.5 billion yen (16.7 billion yen) and to Japanese customers and others 8.2 billion yen (9.2 billion yen).
| Market (Billions of Yen) | FY 3/26 | FY 3/25 | FY 3/24 |
|---|---|---|---|
| Automotive | 31.4 | 31.7 | 28.4 |
| White Goods | 36.5 | 46.5 | 38.2 |
| — Chinese customers | 12.7 | 20.5 | 15.5 |
| — South Korean customers | 15.5 | 16.7 | 13.9 |
| — Japanese customers and others | 8.2 | 9.2 | 8.8 |
| Industrial & Consumer | 10.7 | 11.9 | 11.9 |
| Sanken Core total | 78.6 | 90.0 | 78.5 |
FY March 2027 Forecast
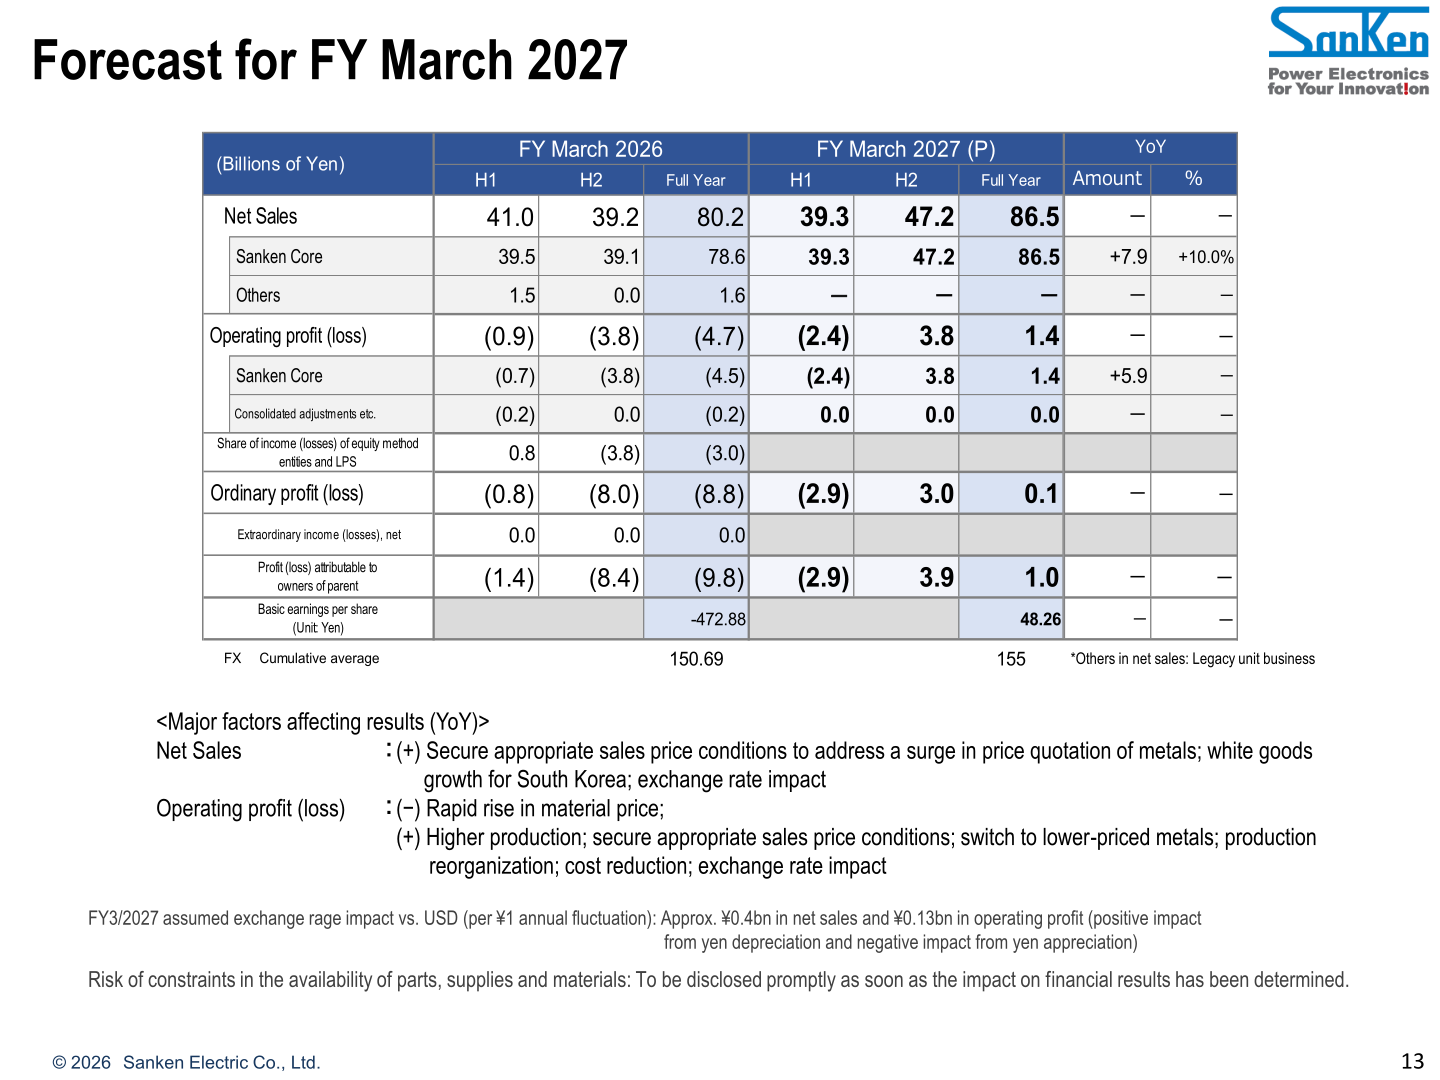
For FY March 2027 the company forecasts net sales of 86.5 billion yen, all from Sanken Core (up 7.9 billion yen, or 10.0%, from Sanken Core net sales of 78.6 billion yen), operating profit of 1.4 billion yen (Sanken Core operating profit of 1.4 billion yen, an improvement of 5.9 billion yen), ordinary profit of 0.1 billion yen and profit attributable to owners of parent of 1.0 billion yen, with basic earnings per share of 48.26 yen. By half, net sales are forecast at 39.3 billion yen in H1 and 47.2 billion yen in H2, and operating profit (loss) at (2.4) billion yen in H1 and 3.8 billion yen in H2. The assumed exchange rate is 155 yen per U.S. dollar. For net sales, the company lists as positive factors securing appropriate sales price conditions to address a surge in price quotation of metals, white goods growth for South Korea and the exchange rate impact; for operating profit it lists the rapid rise in material prices as a negative factor, and higher production, securing appropriate sales price conditions, switching to lower-priced metals, production reorganization, cost reduction and the exchange rate impact as positive factors. The assumed exchange rate impact vs. the U.S. dollar for FY3/2027 is approximately ¥0.4bn in net sales and ¥0.13bn in operating profit per ¥1 annual fluctuation (positive impact from yen depreciation and negative impact from yen appreciation). By market, FY 3/27 sales are planned at 34.5 billion yen in automotive, 39.9 billion yen in white goods and 12.2 billion yen in industrial & consumer.
| Item (Billions of Yen) | FY March 2027 (P) | FY March 2026 | YoY Amount | YoY % |
|---|---|---|---|---|
| Net Sales | 86.5 | 80.2 | - | - |
| — Sanken Core | 86.5 | 78.6 | +7.9 | +10.0% |
| — Others | - | 1.6 | - | - |
| Operating profit (loss) | 1.4 | (4.7) | - | - |
| — Sanken Core | 1.4 | (4.5) | +5.9 | - |
| — Consolidated adjustments etc. | 0.0 | (0.2) | - | - |
| Ordinary profit (loss) | 0.1 | (8.8) | - | - |
| Profit (loss) attributable to owners of parent | 1.0 | (9.8) | - | - |
| Basic earnings per share (Yen) | 48.26 | -472.88 | - | - |
| FX (Yen/USD), cumulative average | 155 | 150.69 |
As a significant subsequent event, the company notes that at an extraordinary meeting of the Board of Directors of Yamagata Sanken Co., Ltd., a consolidated subsidiary, held on May 7, 2026, a resolution was made to solicit applicants for voluntary retirement. Eligible applicants are employees (including re-employed workers) aged 45 or older as of April 1, 2026, approximately 65 people are applicable, the offer period runs from June 8 to June 26, 2026 and the early separation date is planned for the end of September 2026. At present, this matter is forecast to produce special redundancy benefits and other costs totaling approximately 0.7 billion yen, which will be recorded as an extraordinary loss in the consolidated business results for FY March 2027.
Shareholder Returns
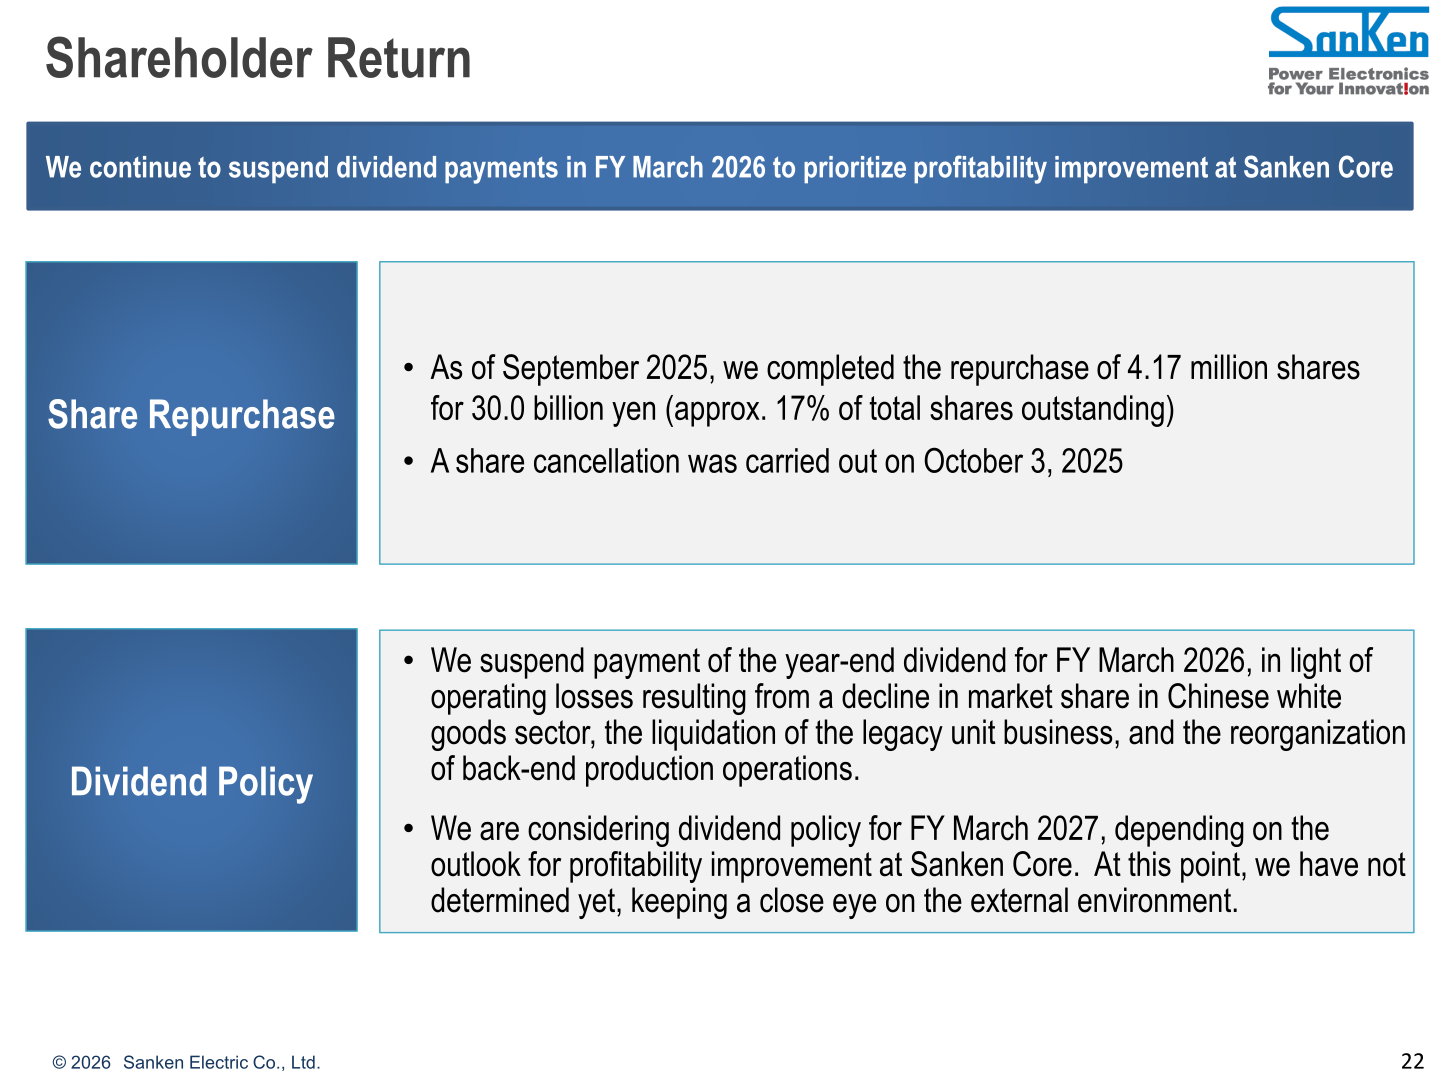
The company states that it continues to suspend dividend payments in FY March 2026 to prioritize profitability improvement at Sanken Core. It suspends payment of the year-end dividend for FY March 2026 in light of operating losses resulting from a decline in market share in the Chinese white goods sector, the liquidation of the legacy unit business and the reorganization of back-end production operations. On share repurchases, as of September 2025 the company completed the repurchase of 4.17 million shares for 30.0 billion yen (approx. 17% of total shares outstanding), and a share cancellation was carried out on October 3, 2025. Regarding FY March 2027, the company says it is considering its dividend policy depending on the outlook for profitability improvement at Sanken Core; at this point it has not determined the policy, keeping a close eye on the external environment.
Medium-Term Plan and Topics
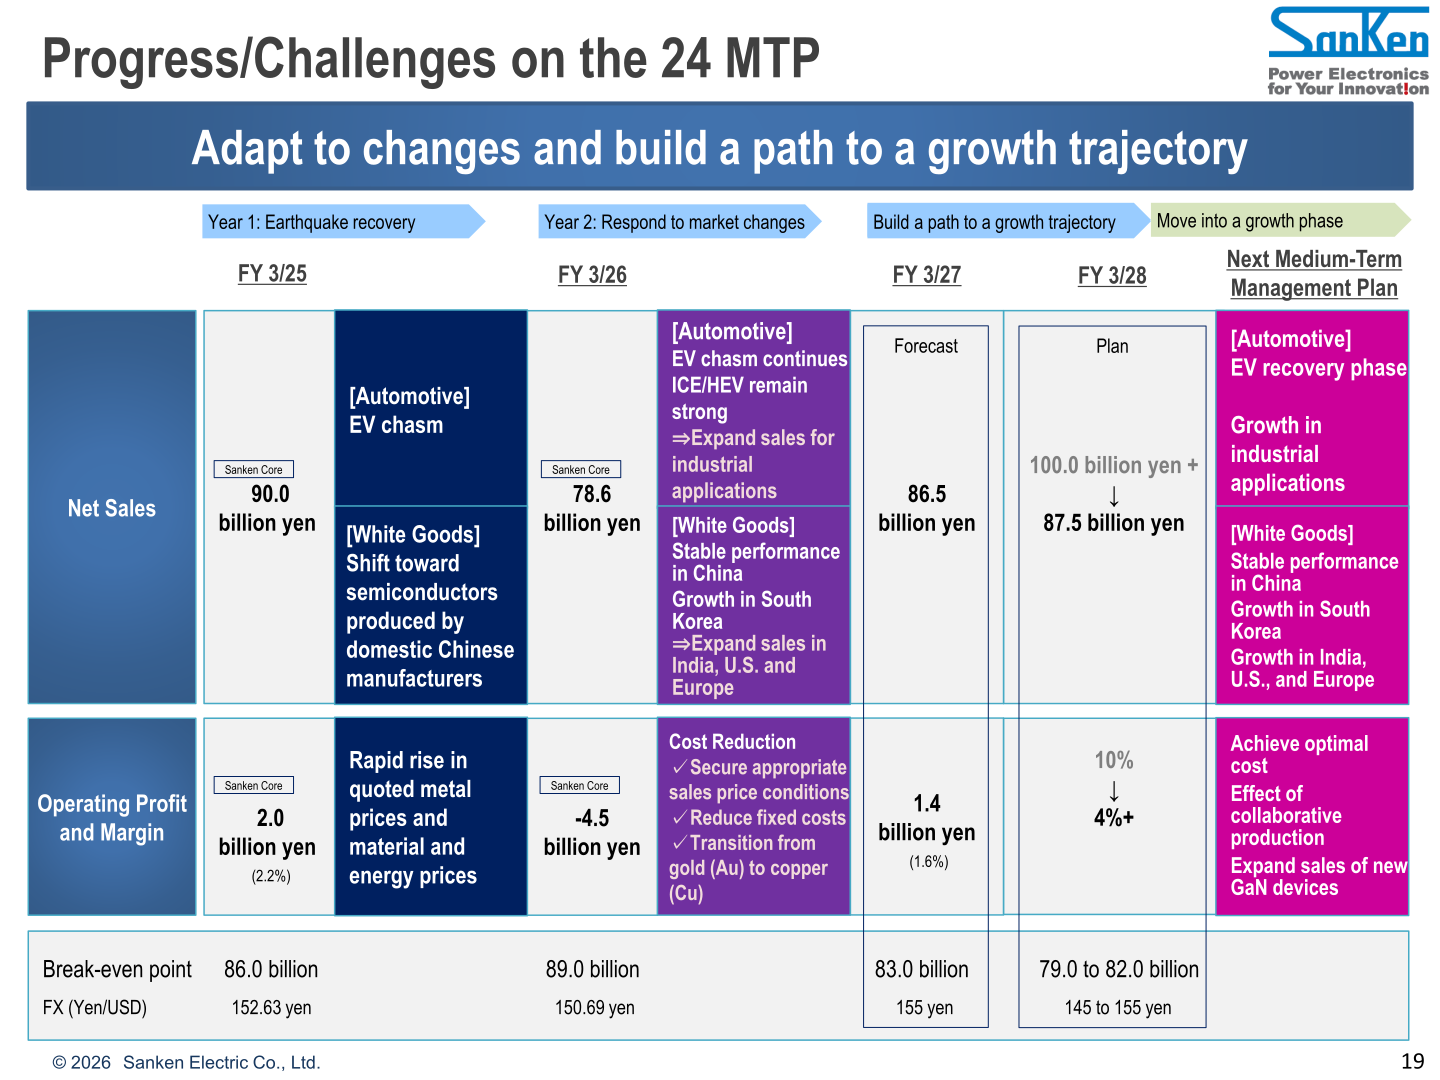
On progress against the 2024 Medium-Term Management Plan (24 MTP), the company positions FY 3/25 as “Year 1: Earthquake recovery,” FY 3/26 as “Year 2: Respond to market changes,” and FY 3/27 to FY 3/28 as building a path to a growth trajectory before moving into a growth phase under the next medium-term management plan. Sanken Core net sales were 90.0 billion yen in FY 3/25 and 78.6 billion yen in FY 3/26, with operating profit of 2.0 billion yen (margin 2.2%) and an operating loss of 4.5 billion yen, respectively; the FY 3/27 forecast is 86.5 billion yen in net sales and 1.4 billion yen in operating profit (margin 1.6%). The FY 3/28 plan has been revised to net sales of 87.5 billion yen (from 100.0 billion yen +) and an operating margin of 4%+ (from 10%). The break-even point is shown as 86.0 billion for FY 3/25, 89.0 billion for FY 3/26, 83.0 billion for FY 3/27 and 79.0 to 82.0 billion for FY 3/28, with assumed exchange rates of 152.63 yen, 150.69 yen, 155 yen and 145 to 155 yen per U.S. dollar, respectively. Cost reduction measures cited include securing appropriate sales price conditions, reducing fixed costs and transitioning from gold (Au) to copper (Cu).
Among priority tasks aimed at improving earnings, the company lists expanding sales to other regions, new markets and new applications through early measures led by the Asia Strategy Office, securing appropriate sales price conditions, reducing fixed costs through Ishikawa Sanken’s structural reform and emergency cost control measures, and achieving optimized production — the closure of the Shika Plant was completed at the end of April 2026 and the reorganization of production operations in the back-end process is in progress as planned. It also cites establishing copper wire technology, starting customer negotiations on measures related to the price quotation of metals, and announcing back-end collaborative production. In its future growth vision, the company shows FY 3/26 net sales of 78.6 billion yen, an FY 3/27 forecast of 86.5 billion yen and an FY 3/28 plan of 87.5 billion yen, and states that, excluding xEV, performance is expected to exceed the previous forecast. Citing Fuji Keizai’s 2026 edition survey, the company states it holds a 10% share of the intelligent power module (IPM) market, ranking No. 5 globally and No. 3 in Japan.
This article is an analysis based on publicly available information and is not a recommendation to buy or sell any specific securities. Investment decisions are your own responsibility.
![[Obayashi] Investors’ Guide 2026 — The Complete 24-Article Breakdown](https://japan-equity.com/wp-content/uploads/2026/07/hub_cover-1024x1024.png)
![[Obayashi] IR & SR Policy — Feeding Dialogue Back into Management](https://japan-equity.com/wp-content/uploads/2026/07/p32_sq-1024x1024.jpg)
![[Obayashi] Domestic Civil Engineering — Resilience Spending Supports 9.6% Margin](https://japan-equity.com/wp-content/uploads/2026/07/p11_sq-1024x1024.jpg)
![[Obayashi] Overseas Construction — Orders Reach ¥1.2tn](https://japan-equity.com/wp-content/uploads/2026/07/p15_sq-1024x1024.jpg)
![[Obayashi] Share Price & External Ratings — vs TOPIX, ESG Index Inclusion](https://japan-equity.com/wp-content/uploads/2026/07/p40_sq-1024x1024.jpg)
![[Construction] ¥75.5tn Investment, Shrinking Workforce — Big-5 Market Share](https://japan-equity.com/wp-content/uploads/2026/07/p12_sq-1024x1024.jpg)



![[Obayashi] Capital Policy & Shareholder Returns — ROE 10%+, DOE ~5%, ¥100bn Buyback](https://japan-equity.com/wp-content/uploads/2026/07/p27_sq-1024x1024.jpg)
![[Obayashi] Reducing Cross-Shareholdings — ¥285.2bn Sold in Five Years](https://japan-equity.com/wp-content/uploads/2026/07/p29_sq-1024x1024.jpg)
![[Obayashi] ¥750bn Investment Plan — ¥300bn to Development, ¥190bn to Tech/DX](https://japan-equity.com/wp-content/uploads/2026/07/p30_sq-1024x1024.jpg)
![[Obayashi] MTP2022 KPIs — Operating Profit ~2x Target, ROE 14.4%](https://japan-equity.com/wp-content/uploads/2026/07/p25_sq-1024x1024.jpg)
![[Obayashi] Cash Allocation — ¥420bn Investment CF Over Five Years](https://japan-equity.com/wp-content/uploads/2026/07/p26_sq-1024x1024.jpg)
![[Obayashi] Green Energy — 44 Plants, 344MW, and the Green Hydrogen Challenge](https://japan-equity.com/wp-content/uploads/2026/07/p21_sq-1024x1024.jpg)
![[Obayashi] Tackling the Labor Shortage — Robotics Construction®](https://japan-equity.com/wp-content/uploads/2026/07/p14_sq-1024x1024.jpg)
