
This article is based on publicly available IR materials and is not a recommendation to buy or sell any specific securities.
Note: NEC refers to the fiscal year ended March 31, 2026 as “FY26/3” and to the current fiscal year ending March 31, 2027 as “FY27/3”; this article keeps the company’s own labels in the text and tables.
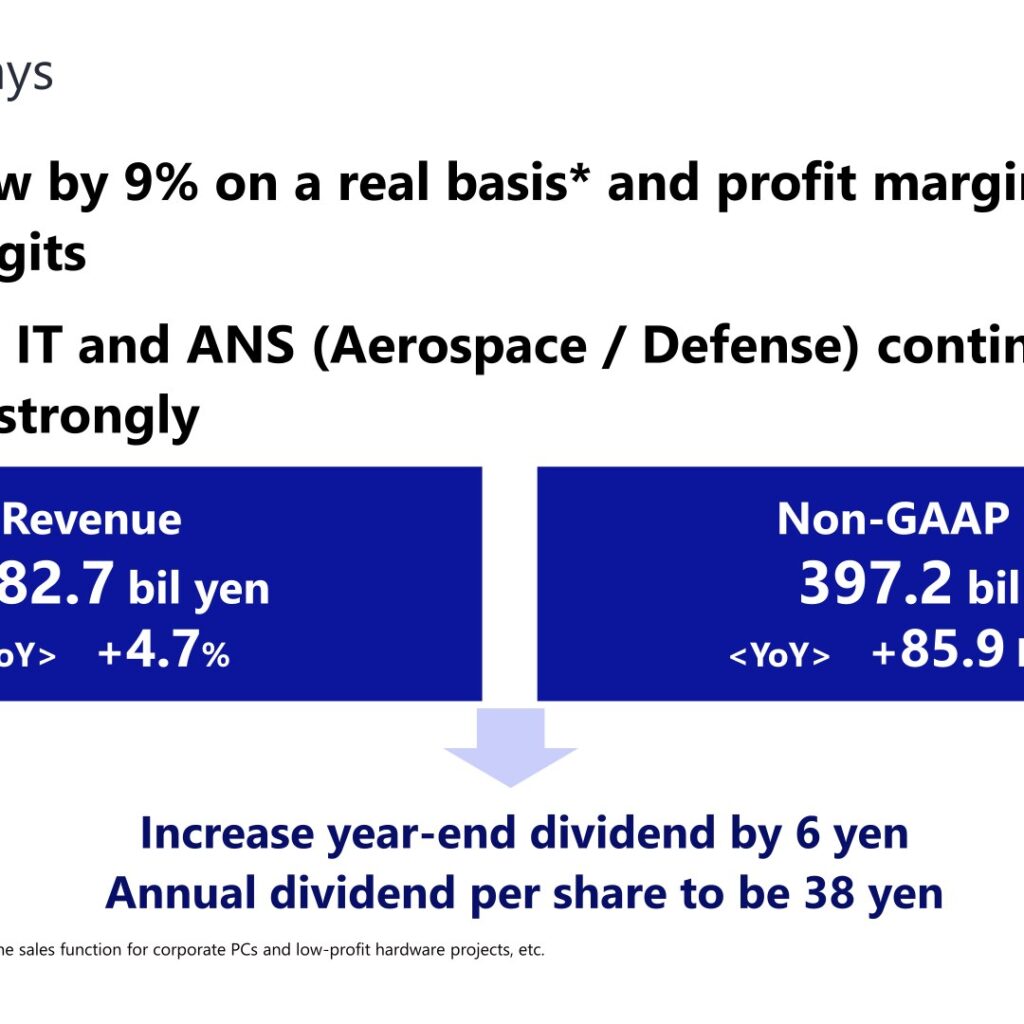
NEC Corporation reported revenue of 3,582.7 billion yen for FY26/3, up 4.7% year on year, and Non-GAAP operating profit of 397.2 billion yen, an increase of 85.9 billion yen. The company’s key takeaways were that sales grew by 9% on a real basis (excluding the impact of the transfer of the sales function for corporate PCs and low-profit hardware projects, etc.) and that the profit margin reached double digits, with Domestic IT and ANS (Aerospace / Defense) continuing to perform strongly. Adjusted operating profit rose by 99.7 billion yen to 386.8 billion yen, which the company summarized as an increase of approximately 100.0 billion yen. The year-end dividend was raised by 6 yen, taking the annual dividend per share to 38 yen.
Consolidated Results (Full-Year Actual)
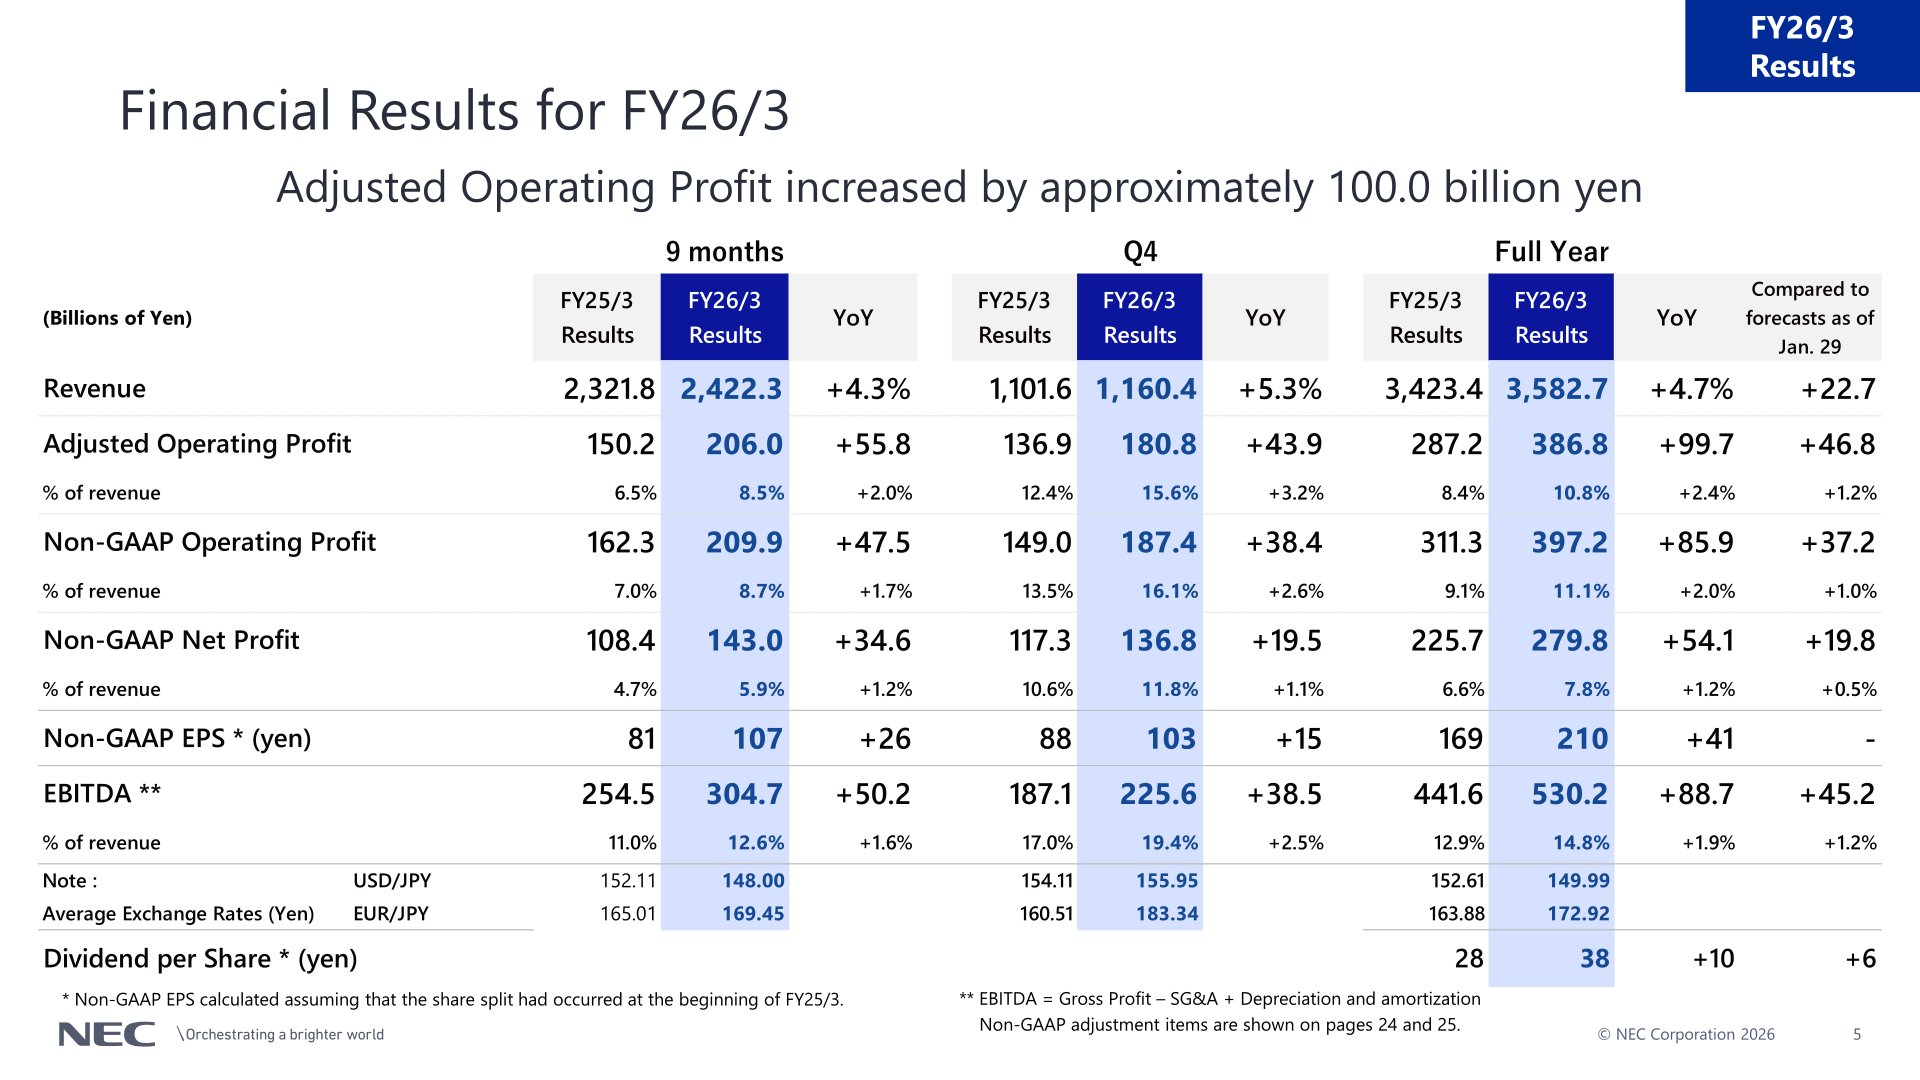
On a full-year basis, revenue reached 3,582.7 billion yen against 3,423.4 billion yen in FY25/3. Adjusted operating profit margin improved to 10.8% from 8.4%, and the Non-GAAP operating profit margin improved to 11.1% from 9.1%. Non-GAAP net profit was 279.8 billion yen and Non-GAAP EPS was 210 yen (calculated assuming that the share split had occurred at the beginning of FY25/3). EBITDA, defined by the company as gross profit less SG&A plus depreciation and amortization, was 530.2 billion yen. Compared with the forecasts as of January 29, revenue came in 22.7 billion yen higher, adjusted operating profit 46.8 billion yen higher and Non-GAAP operating profit 37.2 billion yen higher. Average exchange rates for the full year were 149.99 yen to the US dollar and 172.92 yen to the euro.
| Item (Billions of Yen) | FY26/3 Results | FY25/3 Results | YoY |
|---|---|---|---|
| Revenue | 3,582.7 | 3,423.4 | +4.7% |
| Adjusted Operating Profit | 386.8 | 287.2 | +99.7 |
| Adjusted Operating Profit % of revenue | 10.8% | 8.4% | +2.4% |
| Non-GAAP Operating Profit | 397.2 | 311.3 | +85.9 |
| Non-GAAP Operating Profit % of revenue | 11.1% | 9.1% | +2.0% |
| Non-GAAP Net Profit | 279.8 | 225.7 | +54.1 |
| Non-GAAP Net Profit % of revenue | 7.8% | 6.6% | +1.2% |
| Non-GAAP EPS (yen) | 210 | 169 | +41 |
| EBITDA | 530.2 | 441.6 | +88.7 |
| Operating Profit | 359.9 | 256.5 | +103.4 |
| Net Profit | 270.2 | 175.2 | +95.0 |
| Dividend per Share (yen) | 38 | 28 | +10 |
Segment Results
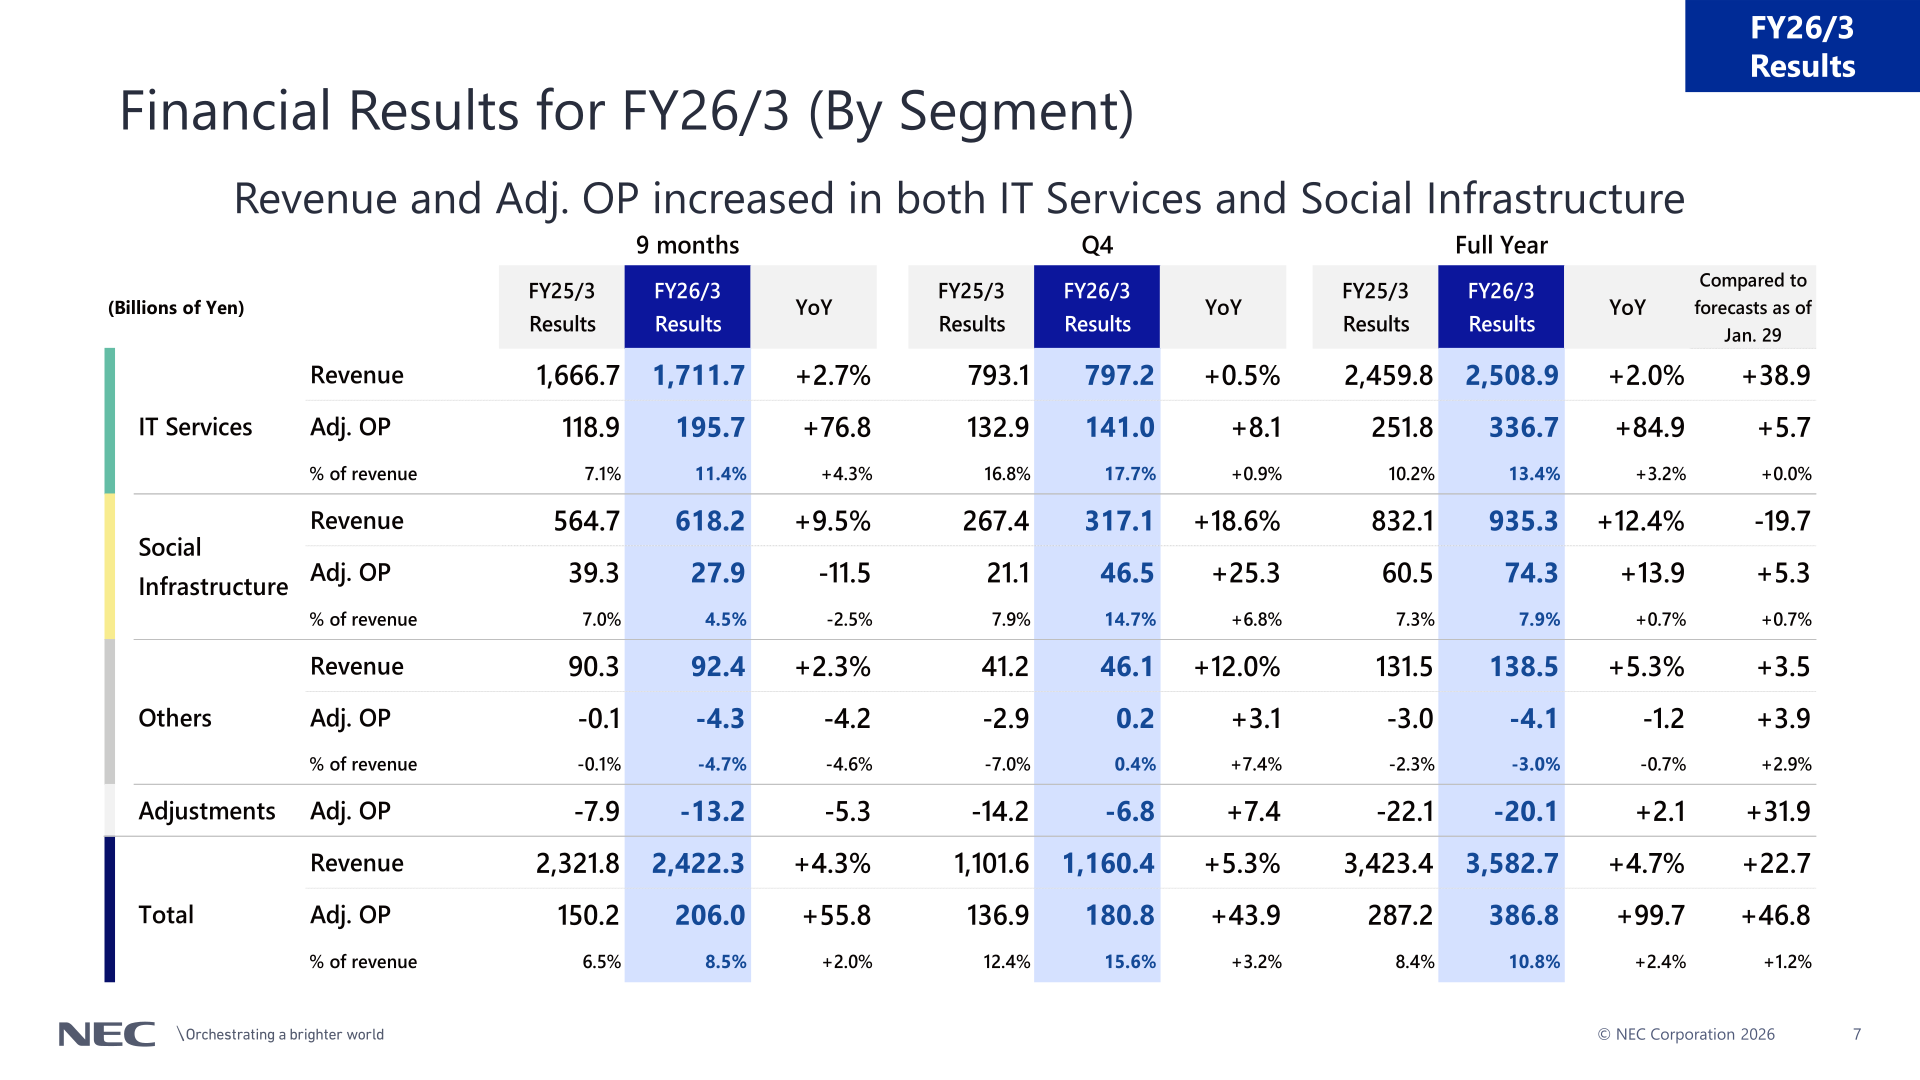
Revenue and adjusted operating profit increased in both IT Services and Social Infrastructure. IT Services revenue was 2,508.9 billion yen (+2.0%) with adjusted operating profit of 336.7 billion yen (+84.9), lifting the segment margin to 13.4% from 10.2%. Social Infrastructure revenue was 935.3 billion yen (+12.4%) with adjusted operating profit of 74.3 billion yen (+13.9) and a margin of 7.9%.
| Segment | Metric (Billions of Yen) | FY26/3 Results | FY25/3 Results | YoY |
|---|---|---|---|---|
| IT Services | Revenue | 2,508.9 | 2,459.8 | +2.0% |
| IT Services | Adj. OP | 336.7 | 251.8 | +84.9 |
| IT Services | Adj. OP % of revenue | 13.4% | 10.2% | +3.2% |
| Social Infrastructure | Revenue | 935.3 | 832.1 | +12.4% |
| Social Infrastructure | Adj. OP | 74.3 | 60.5 | +13.9 |
| Social Infrastructure | Adj. OP % of revenue | 7.9% | 7.3% | +0.7% |
| Others | Revenue | 138.5 | 131.5 | +5.3% |
| Others | Adj. OP | -4.1 | -3.0 | -1.2 |
| Adjustments | Adj. OP | -20.1 | -22.1 | +2.1 |
| Total | Revenue | 3,582.7 | 3,423.4 | +4.7% |
| Total | Adj. OP | 386.8 | 287.2 | +99.7 |
| Total | Adj. OP % of revenue | 10.8% | 8.4% | +2.4% |
Within IT Services, Domestic recorded revenue of 2,175.5 billion yen (+1.9%) and adjusted operating profit of 305.0 billion yen (+72.5), with the margin rising to 14.0% from 10.9%; the company attributed this to capturing strong demand in the Public sector, the expansion of NEC BluStellar and the effects of structural reforms, and noted a 3 pt improvement in profit margin alongside real-basis revenue growth of +9%. International (DGDF, Digital Government / Digital Finance) revenue was 333.5 billion yen (+2.9%) with adjusted operating profit of 31.7 billion yen (+12.4), as improved profit at three European companies absorbed costs incurred by unprofitable projects that occurred outside those three companies. NEC BluStellar revenue reached 705.0 billion yen (+30.0%) with adjusted operating profit of 102.0 billion yen (+35.8), and the ratio of NEC BluStellar revenue was 32% for the full year. Base Business revenue was 1,470.4 billion yen (-7.7%) while its adjusted operating profit rose to 203.0 billion yen (+36.8) on withdrawal from low-profit businesses. Domestic IT Services bookings were +1% for the full year on a real basis (+2% in Q4).
Within Social Infrastructure, Telecom Services revenue was 390.5 billion yen (-5.2%) and adjusted operating profit fell to 20.0 billion yen (-30.6) after a thorough asset clean-up following the review of the base station business. ANS (Aerospace and National Security) revenue rose to 544.8 billion yen (+29.6%) with adjusted operating profit of 54.4 billion yen (+44.5); within it, the Aerospace / Defense business posted revenue of 473.6 billion yen (+27.4%) and adjusted operating profit of 74.4 billion yen (+31.2), while the Submarine Systems business narrowed its losses as business reforms progressed despite additional costs. The company notes that breakdown figures within each segment are for reference only.
Cash Flows and Financial Position
Free cash flows expanded to 472.1 billion yen, an increase of 258.9 billion yen, on increased profits and sales of shares. Cash flows from operating activities were 438.5 billion yen (+94.1) and cash flows from investing activities were a positive 33.7 billion yen (+164.9), the latter reflecting the sale of shares including JAE (approximately +90.0 billion yen) and the acquisition and disposal of real estate (approximately +70.0 billion yen). The cash conversion cycle was 69 days at year-end and 49 days on an average-days basis. Total assets stood at 4,466.8 billion yen and equity attributable to owners of the parent at 2,196.6 billion yen as of March 31, 2026, lifting the ratio of equity attributable to owners of the parent to 49.2% from 45.2%. Interest-bearing debt fell by 177.2 billion yen to 489.2 billion yen, the D/E ratio was 0.22 times and the net D/E ratio was -0.08 times, with cash and cash equivalents of 659.0 billion yen.
FY27/3 Forecast
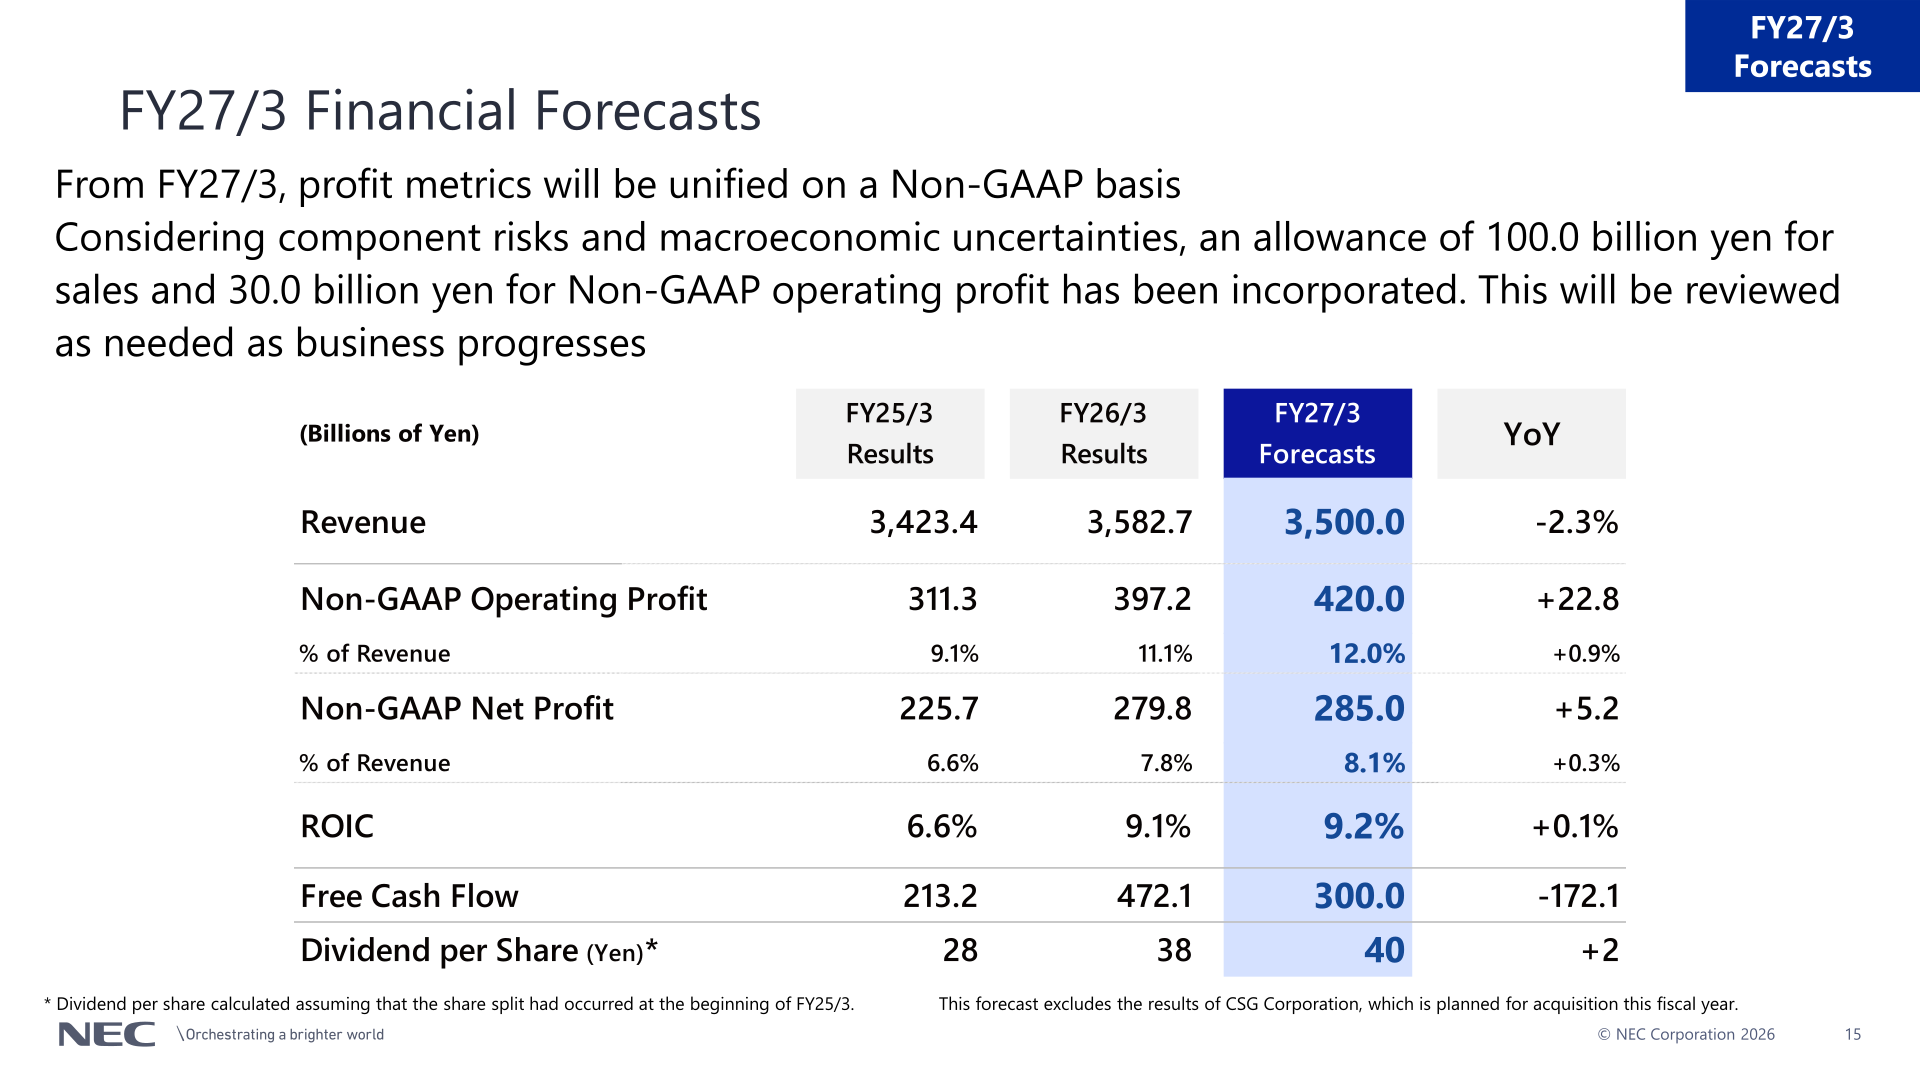
From FY27/3, profit metrics will be unified on a Non-GAAP basis. NEC forecasts revenue of 3,500.0 billion yen (-2.3%) with Non-GAAP operating profit of 420.0 billion yen (+22.8) for a margin of 12.0%, and Non-GAAP net profit of 285.0 billion yen (+5.2). The company states that, considering component risks and macroeconomic uncertainties, an allowance of 100.0 billion yen for sales and 30.0 billion yen for Non-GAAP operating profit has been incorporated, and that this will be reviewed as needed as business progresses. The forecast excludes the results of CSG Corporation, which is planned for acquisition this fiscal year.
| Item (Billions of Yen) | FY27/3 Forecasts | FY26/3 Results | FY25/3 Results | YoY |
|---|---|---|---|---|
| Revenue | 3,500.0 | 3,582.7 | 3,423.4 | -2.3% |
| Non-GAAP Operating Profit | 420.0 | 397.2 | 311.3 | +22.8 |
| Non-GAAP Operating Profit % of Revenue | 12.0% | 11.1% | 9.1% | +0.9% |
| Non-GAAP Net Profit | 285.0 | 279.8 | 225.7 | +5.2 |
| Non-GAAP Net Profit % of Revenue | 8.1% | 7.8% | 6.6% | +0.3% |
| ROIC | 9.2% | 9.1% | 6.6% | +0.1% |
| Free Cash Flow | 300.0 | 472.1 | 213.2 | -172.1 |
| Dividend per Share (Yen) | 40 | 38 | 28 | +2 |
By segment, IT Services is forecast to post revenue of 2,385.0 billion yen (-4.9%) and Non-GAAP operating profit of 350.0 billion yen (+14.2) for a 14.7% margin, as Domestic profitability improves through NEC BluStellar expansion despite the passing of the peak for some public-sector projects, and International (DGDF) delivers continuous profitability improvements and curbs unprofitable projects. Social Infrastructure is forecast at revenue of 975.0 billion yen (+4.2%) and Non-GAAP operating profit of 127.0 billion yen (+43.6) for a 13.0% margin, reflecting the effects of the FY26/3 structural reforms in Telecom Services and, in ANS, further expansion of the defense business plus a return to profit in the submarine systems business. Within Domestic IT, NEC BluStellar revenue is forecast at 840.0 billion yen (+19.1%) with Non-GAAP operating profit of 143.0 billion yen (+41.0), taking the ratio of NEC BluStellar revenue to 41%.
| Segment | Metric (Billions of Yen) | FY27/3 Forecasts | FY26/3 Results | YoY |
|---|---|---|---|---|
| IT Services | Revenue | 2,385.0 | 2,508.9 | -4.9% |
| IT Services | Non-GAAP OP | 350.0 | 335.8 | +14.2 |
| IT Services | Non-GAAP OP % of revenue | 14.7% | 13.4% | +1.3% |
| Social Infrastructure | Revenue | 975.0 | 935.3 | +4.2% |
| Social Infrastructure | Non-GAAP OP | 127.0 | 83.4 | +43.6 |
| Social Infrastructure | Non-GAAP OP % of revenue | 13.0% | 8.9% | +4.1% |
| Others | Revenue | 140.0 | 138.5 | +1.1% |
| Others | Non-GAAP OP | -3.0 | -4.5 | +1.5 |
| Adjustments | Non-GAAP OP | -54.0 | -17.6 | -36.4 |
| Total | Revenue | 3,500.0 | 3,582.7 | -2.3% |
| Total | Non-GAAP OP | 420.0 | 397.2 | +22.8 |
| Total | Non-GAAP OP % of revenue | 12.0% | 11.1% | +0.9% |
Shareholder Returns
NEC increased the year-end dividend by 6 yen relative to its forecasts as of January 29, bringing the annual dividend per share for FY26/3 to 38 yen, 10 yen higher than the 28 yen paid in FY25/3. Per-share dividend figures are calculated assuming that the share split had occurred at the beginning of FY25/3. For FY27/3 the company forecasts a further 2 yen increase to 40 yen per share. Alongside returns, NEC continues to reduce its investment securities: activities to cut the number of shares held have been accelerated based on the zero cross-shareholdings policy effective from April 2020, cumulative sales amount to 174.3 billion yen and greatly contributed to free cash flows, the sales amount in FY26/3 was 15.3 billion yen, and the number of listed companies held has been reduced by 80% from the end of FY20/3.
Medium-Term Plan and Topics
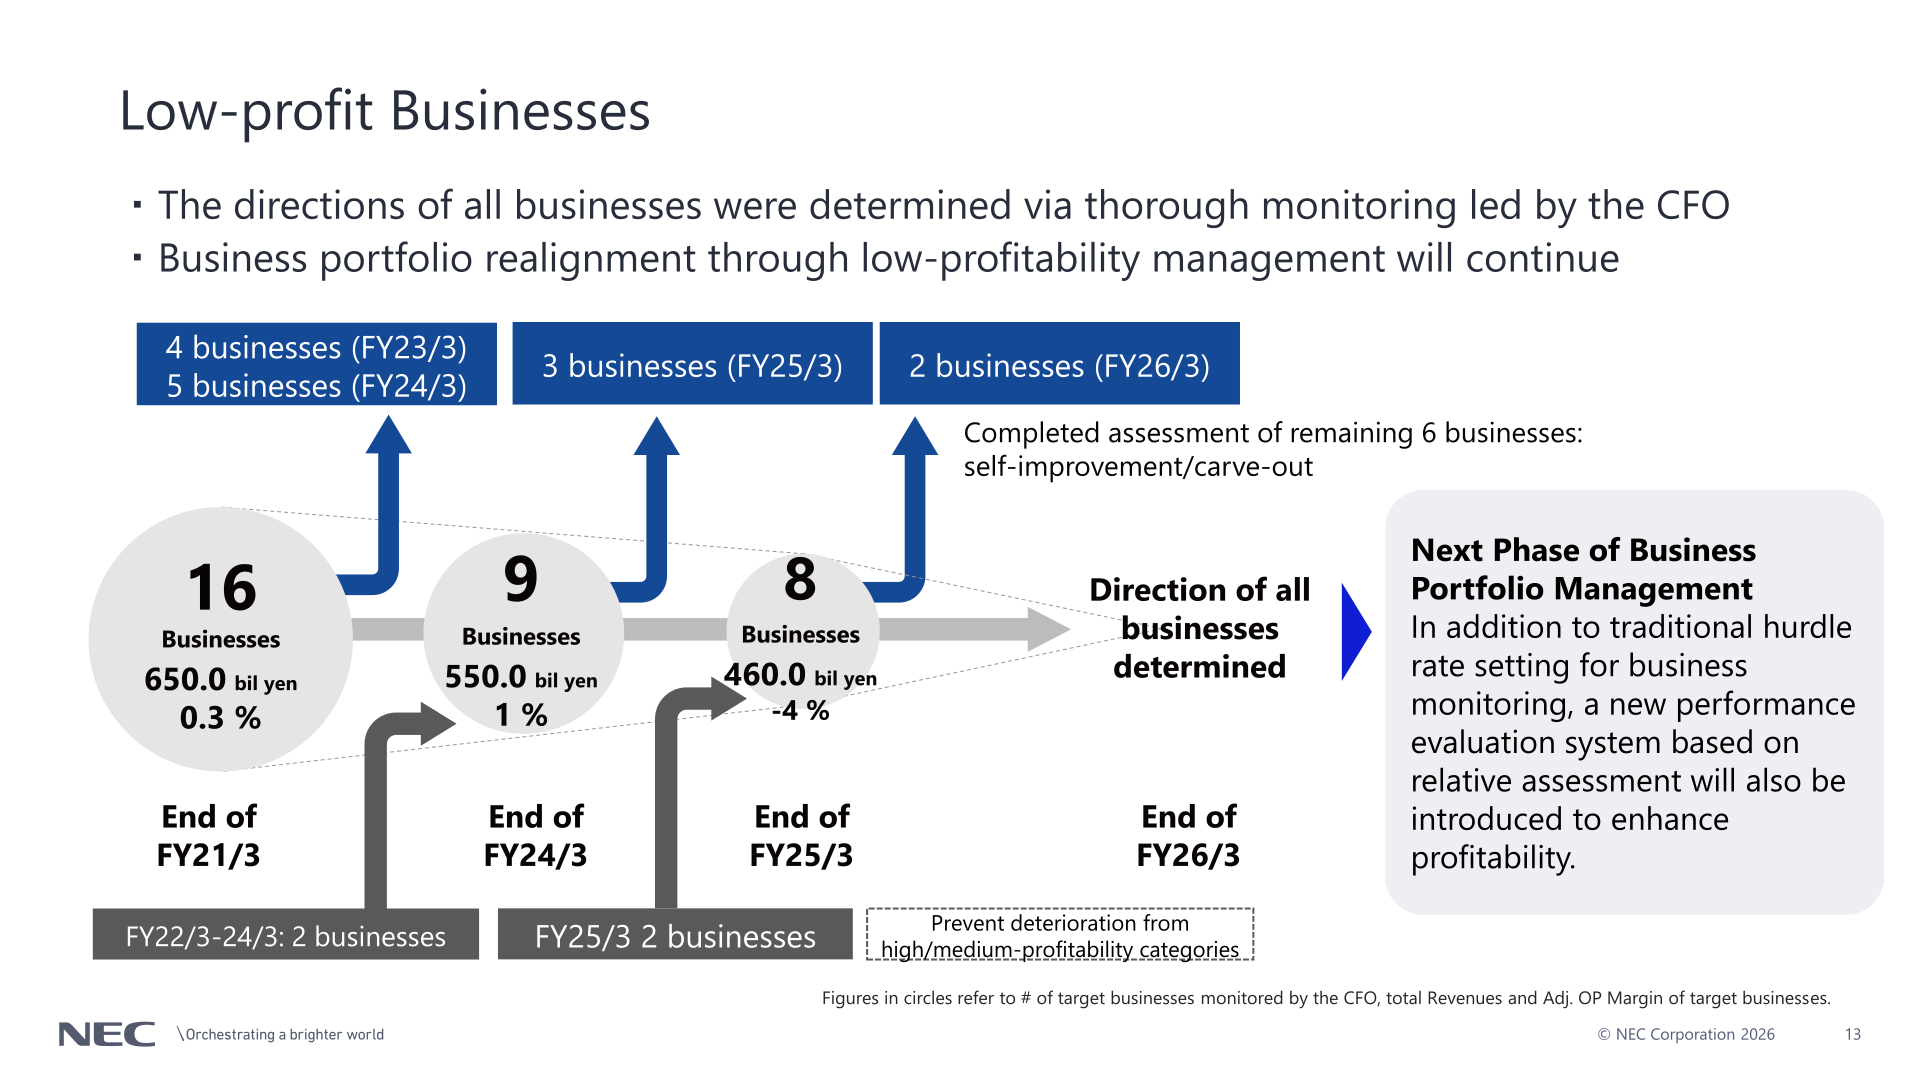
On business portfolio management, NEC states that the directions of all businesses were determined via thorough monitoring led by the CFO, and that business portfolio realignment through low-profitability management will continue. The number of low-profit businesses monitored by the CFO fell from 16 businesses with total revenues of 650.0 billion yen and an adjusted operating profit margin of 0.3% at the end of FY21/3, to 9 businesses / 550.0 billion yen / 1% at the end of FY24/3, and to 8 businesses / 460.0 billion yen / -4% at the end of FY25/3, with 2 businesses addressed in FY26/3 and the assessment of the remaining 6 businesses completed on a self-improvement or carve-out basis. For the next phase, the company says that in addition to traditional hurdle rate setting for business monitoring, a new performance evaluation system based on relative assessment will also be introduced to enhance profitability.
From FY27/3, businesses in the Telecom Services domain will be reorganized into various segments: the IT Services business moves into IT Services, the Network Infrastructure business and Submarine Systems move under Social Infrastructure alongside Aerospace / Defense, and IT Services is presented as Domestic, International and Others. As upcoming events, the deck lists a Mid-Term Management Plan Briefing on Tuesday, May 12 (4:30-6:00 PM JST) with President and CEO Takayuki Morita and Corporate Senior Executive Vice President and CFO Kunikazu Amemiya, and NEC IR Day 2026 (Q&A Sessions) on Monday, June 1 (1:30-3:30 PM JST) covering IT Services and Social Infrastructure.
This article is an analysis based on publicly available information and is not a recommendation to buy or sell any specific securities. Investment decisions are your own responsibility.
![[Obayashi] Investors’ Guide 2026 — The Complete 24-Article Breakdown](https://japan-equity.com/wp-content/uploads/2026/07/hub_cover-1024x1024.png)
![[Obayashi] IR & SR Policy — Feeding Dialogue Back into Management](https://japan-equity.com/wp-content/uploads/2026/07/p32_sq-1024x1024.jpg)
![[Obayashi] Real Estate Development — 18.7% Margin, ¥287.7bn Unrealized Gains](https://japan-equity.com/wp-content/uploads/2026/07/p20_sq-1024x1024.jpg)
![[Obayashi] Domestic Civil Engineering — Resilience Spending Supports 9.6% Margin](https://japan-equity.com/wp-content/uploads/2026/07/p11_sq-1024x1024.jpg)
![[Obayashi] Share Price & External Ratings — vs TOPIX, ESG Index Inclusion](https://japan-equity.com/wp-content/uploads/2026/07/p40_sq-1024x1024.jpg)
![[Construction] ¥75.5tn Investment, Shrinking Workforce — Big-5 Market Share](https://japan-equity.com/wp-content/uploads/2026/07/p12_sq-1024x1024.jpg)



![[Obayashi] Capital Policy & Shareholder Returns — ROE 10%+, DOE ~5%, ¥100bn Buyback](https://japan-equity.com/wp-content/uploads/2026/07/p27_sq-1024x1024.jpg)
![[Obayashi] Reducing Cross-Shareholdings — ¥285.2bn Sold in Five Years](https://japan-equity.com/wp-content/uploads/2026/07/p29_sq-1024x1024.jpg)
![[Obayashi] ¥750bn Investment Plan — ¥300bn to Development, ¥190bn to Tech/DX](https://japan-equity.com/wp-content/uploads/2026/07/p30_sq-1024x1024.jpg)
![[Obayashi] MTP2022 KPIs — Operating Profit ~2x Target, ROE 14.4%](https://japan-equity.com/wp-content/uploads/2026/07/p25_sq-1024x1024.jpg)
![[Obayashi] Cash Allocation — ¥420bn Investment CF Over Five Years](https://japan-equity.com/wp-content/uploads/2026/07/p26_sq-1024x1024.jpg)
![[Obayashi] Green Energy — 44 Plants, 344MW, and the Green Hydrogen Challenge](https://japan-equity.com/wp-content/uploads/2026/07/p21_sq-1024x1024.jpg)
![[Obayashi] Tackling the Labor Shortage — Robotics Construction®](https://japan-equity.com/wp-content/uploads/2026/07/p14_sq-1024x1024.jpg)
