
This article is based on publicly available IR materials and is not a recommendation to buy or sell any specific securities.
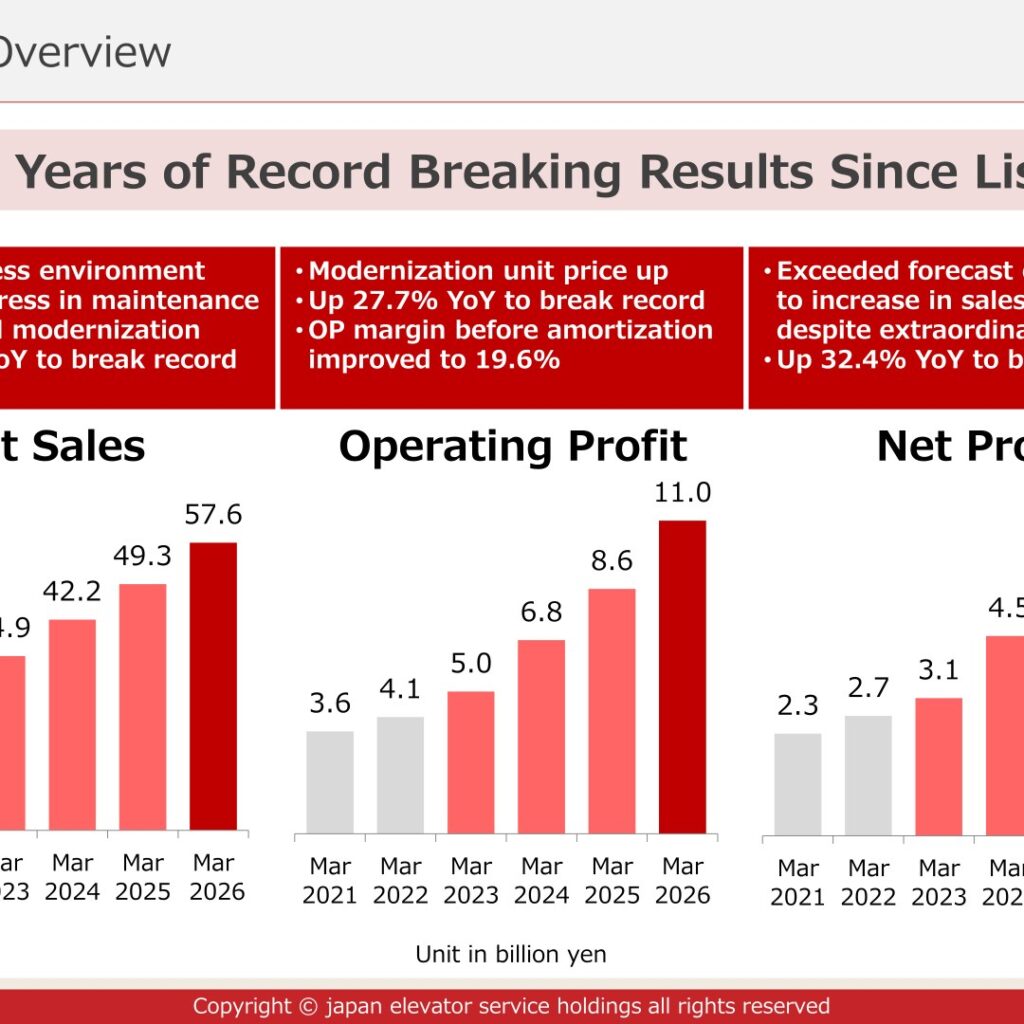
Note: the company’s materials label the fiscal year ended March 31, 2026 as “FY Mar 2026” (and the fiscal year ending March 2027 as “FY Mar 2027”); this site classifies it as FY2025. Labels in the body and tables below follow the materials. Japan Elevator Service Holdings Co., Ltd. (TSE Prime Market: 6544) released its “Presentation Material for the Fiscal Year Ended March 2026” dated May 21, 2026. Net sales rose 16.7% year on year to ¥57,601 million, operating profit rose 27.7% to ¥11,010 million, ordinary profit rose 27.7% to ¥11,006 million and profit attributable to owners of parent rose 32.4% to ¥7,319 million, marking nine years of record-breaking results since listing. Sales and profits both exceeded the earnings forecast revised upward in November 2025. Operating profit before amortization was ¥11,301 million, with the operating profit margin before goodwill amortization improving by 1.6 percentage points to 19.6%. Elevators under maintenance contracts at the end of March 2026 were 126,840 units, a net increase of 13,320. For the fiscal year ending March 2027 the company forecasts net sales of ¥65,000 million (YoY 112.8), operating profit of ¥13,000 million (118.1) and profit attributable to owners of parent of ¥8,200 million (112.0), record highs that exceed all VISION2027 targets. The dividend for the fiscal year ending March 2026 is 21 yen per share (payout ratio 51.2%), an increase of 5.5 yen after adjusting for the 1:2 stock split on October 1, 2025.
Consolidated Results (Full-Year Actual, FY Mar 2026)
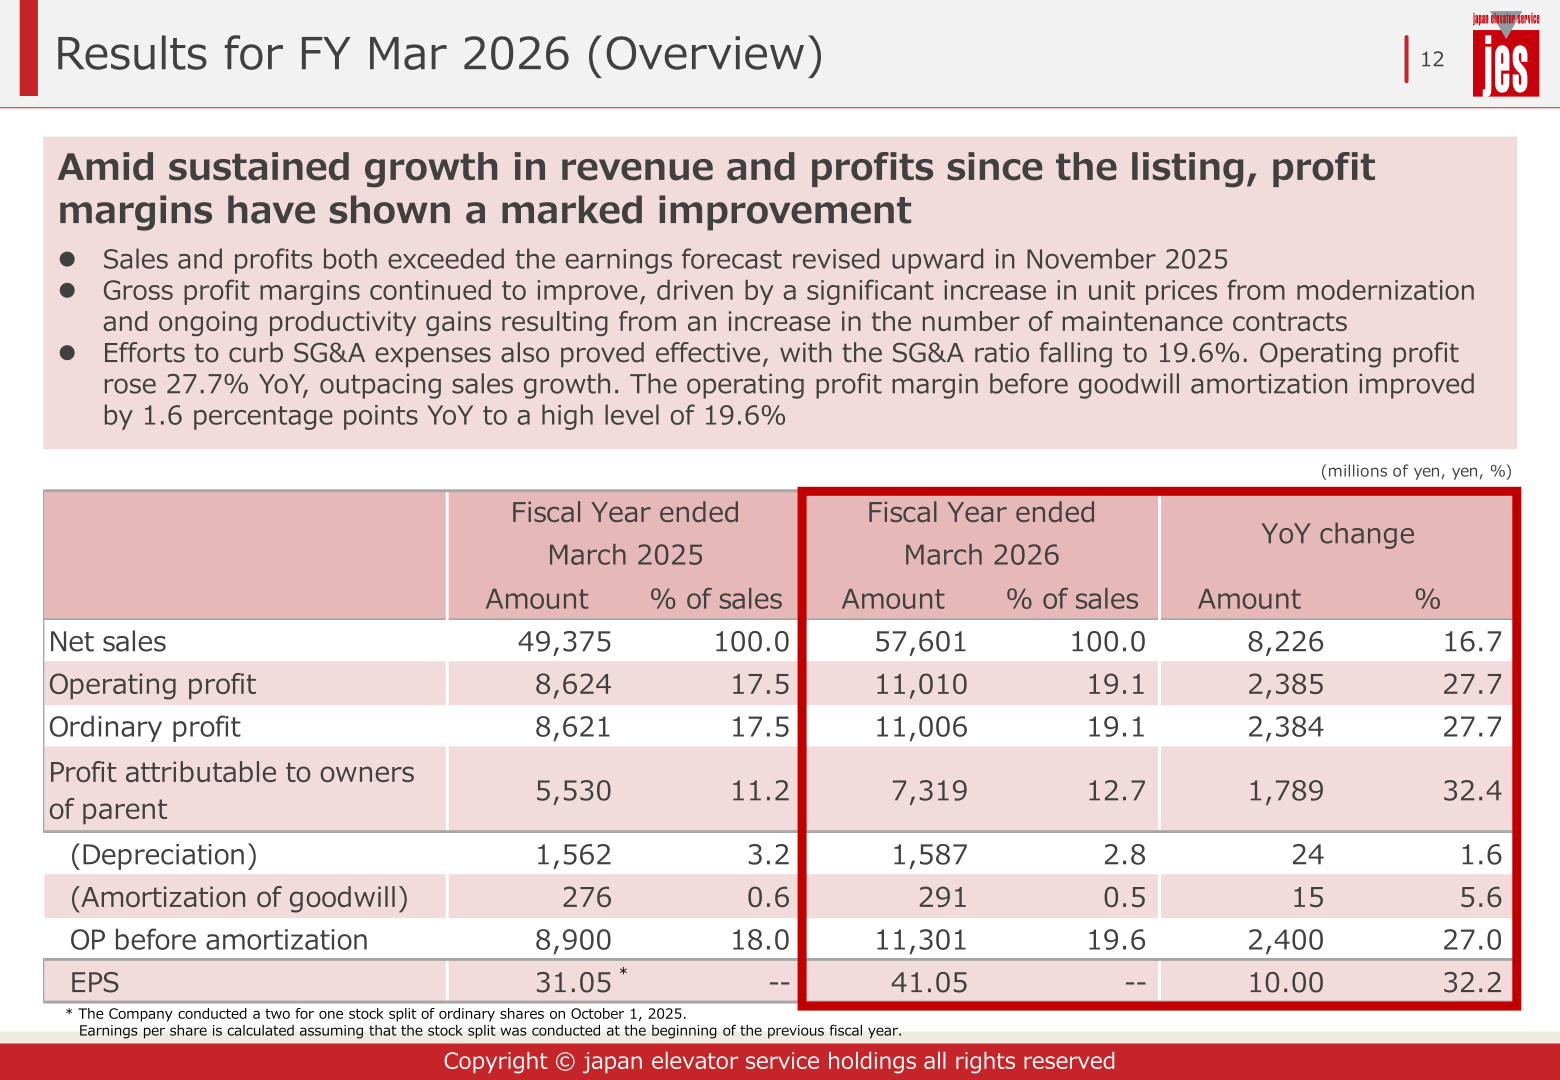
Net sales were ¥57,601 million, up ¥8,226 million (16.7%) from ¥49,375 million in the fiscal year ended March 2025, supported by a good business environment and strong progress in maintenance & repair and modernization. Operating profit was ¥11,010 million, up ¥2,385 million (27.7%), with the operating margin rising from 17.5% to 19.1%; the materials attribute this to modernization unit prices going up. Ordinary profit was ¥11,006 million (up 27.7%). Profit attributable to owners of parent was ¥7,319 million, up ¥1,789 million (32.4%), exceeding the forecast of ¥6.6B due to the increase in sales and profit despite extraordinary losses. Depreciation was ¥1,587 million and amortization of goodwill ¥291 million, so operating profit before amortization was ¥11,301 million (up 27.0%), or 19.6% of sales versus 18.0% a year earlier. EPS was ¥41.05 versus ¥31.05 (calculated assuming the two-for-one stock split of October 1, 2025 was conducted at the beginning of the previous fiscal year). According to the materials, gross profit margins continued to improve, driven by a significant increase in unit prices from modernization and ongoing productivity gains resulting from the increase in the number of maintenance contracts, and efforts to curb SG&A expenses proved effective, with the SG&A ratio falling to 19.6%.
| Item (millions of yen, yen, %) | FY ended March 2025 | % of sales | FY ended March 2026 | % of sales | YoY change (amount) | YoY change (%) |
|---|---|---|---|---|---|---|
| Net sales | 49,375 | 100.0 | 57,601 | 100.0 | 8,226 | 16.7 |
| Operating profit | 8,624 | 17.5 | 11,010 | 19.1 | 2,385 | 27.7 |
| Ordinary profit | 8,621 | 17.5 | 11,006 | 19.1 | 2,384 | 27.7 |
| Profit attributable to owners of parent | 5,530 | 11.2 | 7,319 | 12.7 | 1,789 | 32.4 |
| (Depreciation) | 1,562 | 3.2 | 1,587 | 2.8 | 24 | 1.6 |
| (Amortization of goodwill) | 276 | 0.6 | 291 | 0.5 | 15 | 5.6 |
| OP before amortization | 8,900 | 18.0 | 11,301 | 19.6 | 2,400 | 27.0 |
| EPS (yen) | 31.05 | — | 41.05 | — | 10.00 | 32.2 |
In the factors for change in operating profit before amortization (million yen), the increase in net sales contributed +8,226, while material cost (-1,943), labor cost (-1,651), outsourcing cost (-874), depreciation (-24) and others (-1,333) were negative, taking operating profit before amortization from 8,900 (18.0%) in March 2025 to 11,301 (19.6%) in March 2026. Incremental profit of 2,400 on incremental sales of 8,226 equals 29.2%, compared with 25.3% (incremental profit 1,809 on incremental sales 7,158) in the fiscal year ended March 2025.
Business Review: Maintenance Contracts, Network and Workforce
Elevators under maintenance contracts at the end of March 2026 were 126,840 units, up from 113,520 a year earlier, a net increase of 13,320 that compares with the record-breaking net adds of the previous year; the company’s estimated market share advanced more than one percentage point to 11%. The materials cite a diversified sales channel (building management companies, alliances with financial institutions and business partners, existing customers and auctions) and a better business environment as prices edge up and OEMs ask for price increases. The number of locations increased from 148 at FY Mar 2025 to 156 at FY Mar 2026 (as of May 1, 2026), including a new service office in Oita, a new market for the company. The sales force grew to 305 (272 a year earlier) and technical personnel to 1,452 (1,271). In April 2026 the company hired 167 new graduates, of which 146 were technical personnel (143 in the previous year). The company acquired Naka Elevator Co., Ltd. (January 2026) and took over IHI Transport Machinery’s car lift business, supplementing organic growth. Consolidated employees numbered 2,286 as of March 2026.
In modernization, the number of projects exceeded expectations, driven by robust demand resulting from a concentration of elevator replacement cycles and OEMs discontinuing parts supply; as OEMs pass on rising material and outsourcing costs to selling prices, modernization unit prices continue to rise and profit margins are improving. The company decided to launch a new elevator business in the fiscal year ending March 2027 (May 2026 -) in response to the improvement in pricing conditions in the new business and modernization markets. Overseas, the company plans to establish Japan Elevator Service Malaysia SDN. BHD. in May 2026 in partnership with representatives from the local company Potensi Terus Industries SDN. BHD. (with the company holding a 55% stake); Japan remains the top priority, and overseas business is positioned as a period of know-how accumulation.
Results by Service Line and FY Mar 2027 Forecast
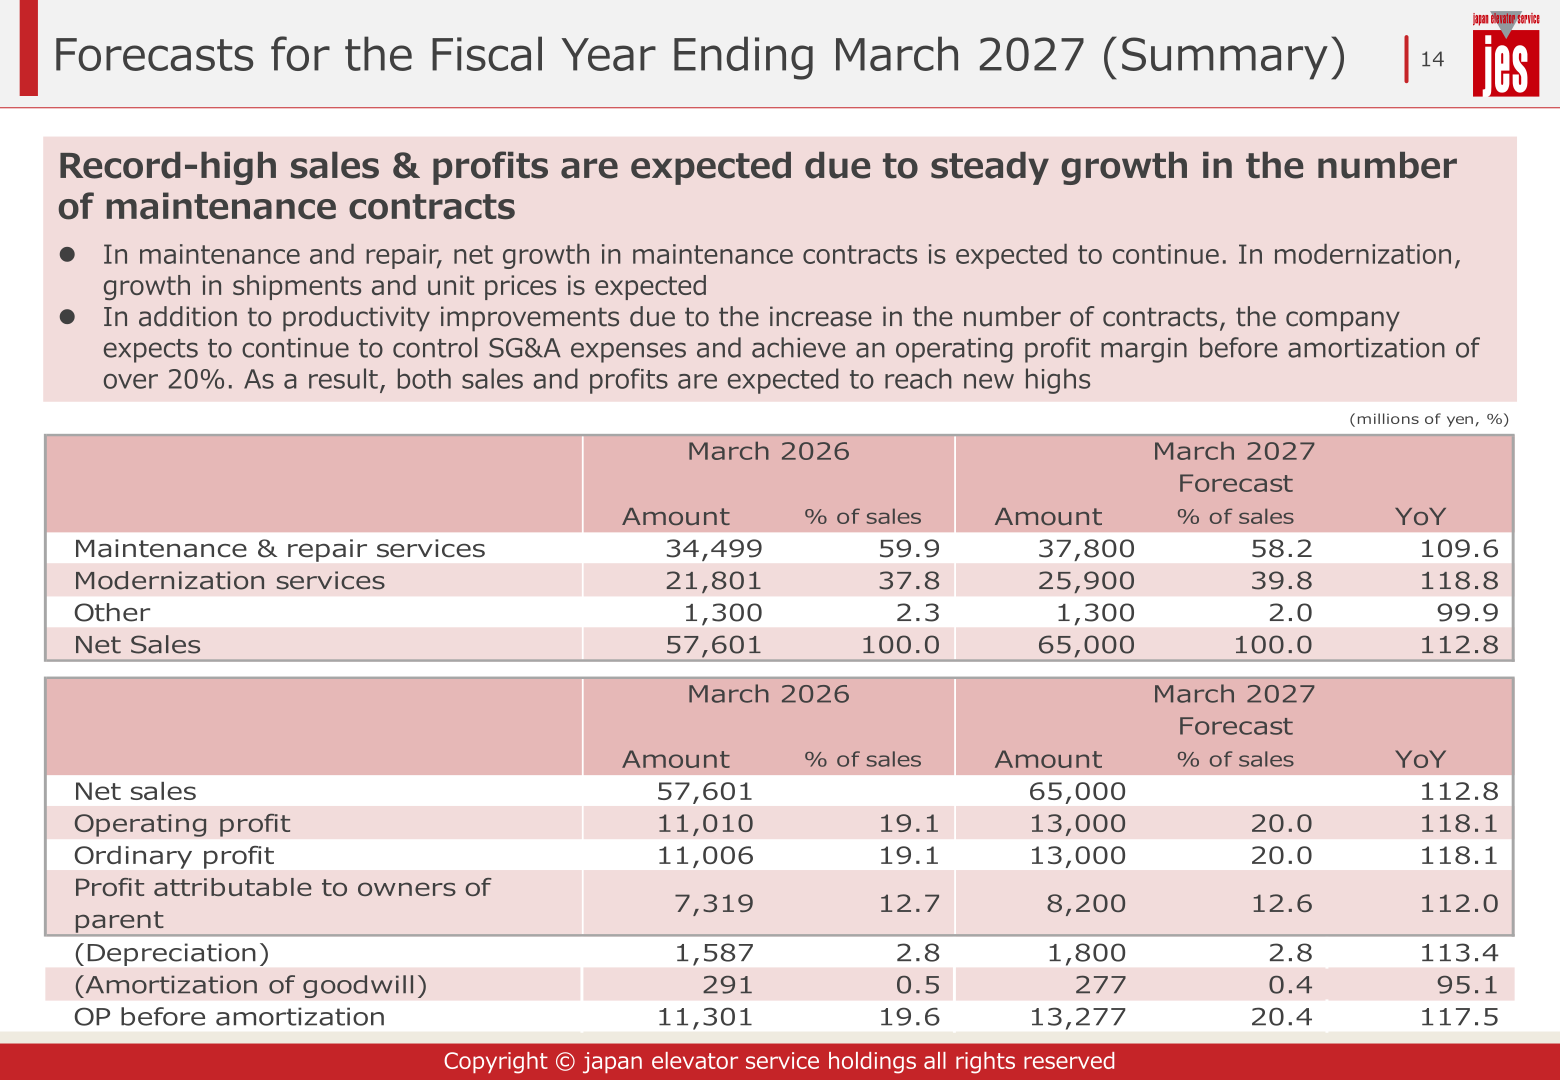
By service line, net sales for the fiscal year ended March 2026 were ¥34,499 million in maintenance & repair services (59.9% of sales), ¥21,801 million in modernization services (37.8%) and ¥1,300 million in other (2.3%). For the fiscal year ending March 2027 the company forecasts maintenance & repair services of ¥37,800 million (YoY 109.6), modernization services of ¥25,900 million (118.8) and other of ¥1,300 million (99.9), for net sales of ¥65,000 million (112.8). Net growth in maintenance contracts is expected to continue, and in modernization growth in shipments and unit prices is expected.
| Service line (millions of yen, %) | March 2026 Amount | % of sales | March 2027 Forecast Amount | % of sales | YoY |
|---|---|---|---|---|---|
| Maintenance & repair services | 34,499 | 59.9 | 37,800 | 58.2 | 109.6 |
| Modernization services | 21,801 | 37.8 | 25,900 | 39.8 | 118.8 |
| Other | 1,300 | 2.3 | 1,300 | 2.0 | 99.9 |
| Net Sales | 57,601 | 100.0 | 65,000 | 100.0 | 112.8 |
On the profit side, the company forecasts operating profit of ¥13,000 million (operating margin 20.0%, YoY 118.1), ordinary profit of ¥13,000 million (118.1) and profit attributable to owners of parent of ¥8,200 million (12.6% of sales, 112.0). With depreciation of ¥1,800 million and amortization of goodwill of ¥277 million, operating profit before amortization is forecast at ¥13,277 million, or 20.4% of sales (117.5). In addition to productivity improvements from the increase in the number of contracts, the company expects to continue to control SG&A expenses and achieve an operating profit margin before amortization of over 20%, so both sales and profits are expected to reach new highs. Capital expenditure is forecast at ¥1.90 billion (¥1.94 billion actual in FY2026, mainly investments related to PRIME, the remote inspection service, etc.) and depreciation at ¥1.80 billion (¥1.58 billion).
| Item (millions of yen, %) | March 2027 Forecast | % of sales | March 2026 (Actual) | % of sales | YoY |
|---|---|---|---|---|---|
| Net sales | 65,000 | 100.0 | 57,601 | 100.0 | 112.8 |
| Operating profit | 13,000 | 20.0 | 11,010 | 19.1 | 118.1 |
| Ordinary profit | 13,000 | 20.0 | 11,006 | 19.1 | 118.1 |
| Profit attributable to owners of parent | 8,200 | 12.6 | 7,319 | 12.7 | 112.0 |
| (Depreciation) | 1,800 | 2.8 | 1,587 | 2.8 | 113.4 |
| (Amortization of goodwill) | 277 | 0.4 | 291 | 0.5 | 95.1 |
| OP before amortization | 13,277 | 20.4 | 11,301 | 19.6 | 117.5 |
Shareholder Returns
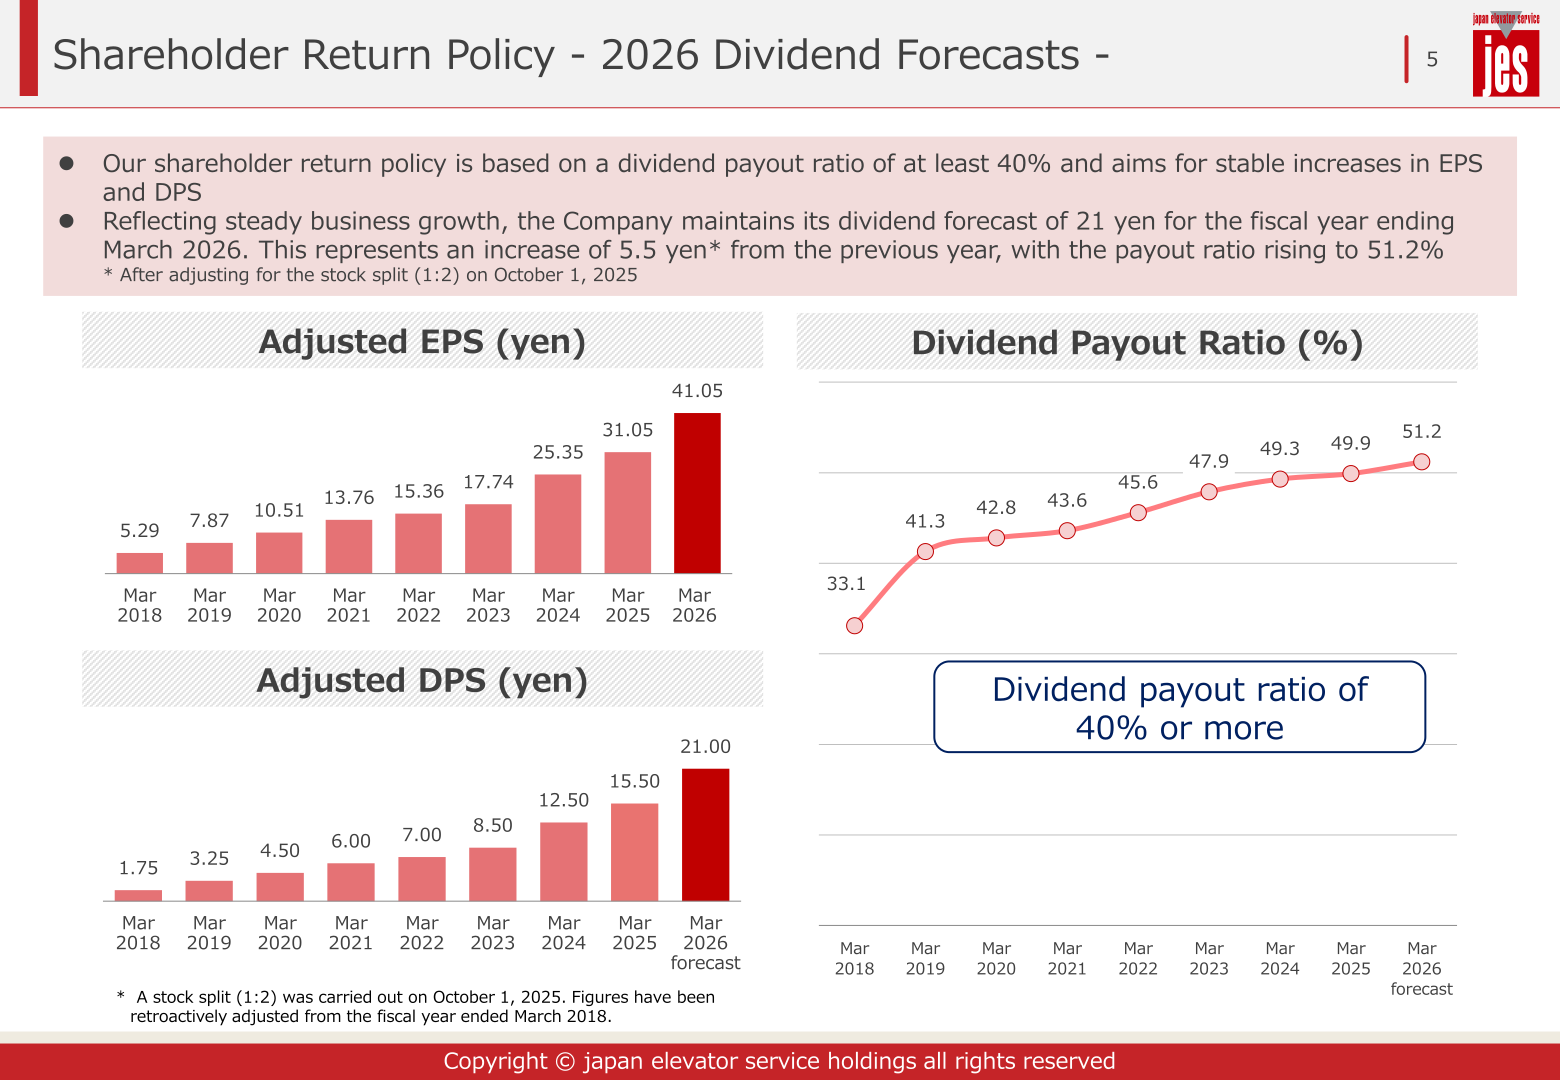
The company’s shareholder return policy is based on a dividend payout ratio of at least 40% and aims for stable increases in EPS and DPS. Reflecting steady business growth, the company maintains its dividend forecast of 21 yen for the fiscal year ending March 2026, an increase of 5.5 yen from the previous year after adjusting for the 1:2 stock split on October 1, 2025, with the payout ratio rising from 49.9% to 51.2%. Adjusted DPS was 15.50 yen for the fiscal year ended March 2025 and adjusted EPS 31.05 yen versus 41.05 yen for March 2026 (figures retroactively adjusted for the stock split from the fiscal year ended March 2018). Under its cash flow management, the company shares profit growth with shareholders through dividends, aims for net cash for the time being, will continue bolt-on acquisitions in Japan, and expects free cash flow to be on an upward trend as the number of maintenance contracts increases and profitability improves. A dividend forecast for the fiscal year ending March 2027 cannot be confirmed from the materials.
| Item | FY ended March 2025 | FY ended March 2026 |
|---|---|---|
| Adjusted EPS (yen) | 31.05 | 41.05 |
| Adjusted DPS (yen) | 15.50 | 21.00 (forecast) |
| Dividend payout ratio (%) | 49.9 | 51.2 |
| Policy | Dividend payout ratio of 40% or more | Dividend payout ratio of 40% or more |
Medium-Term Plan VISION2027 and Topics
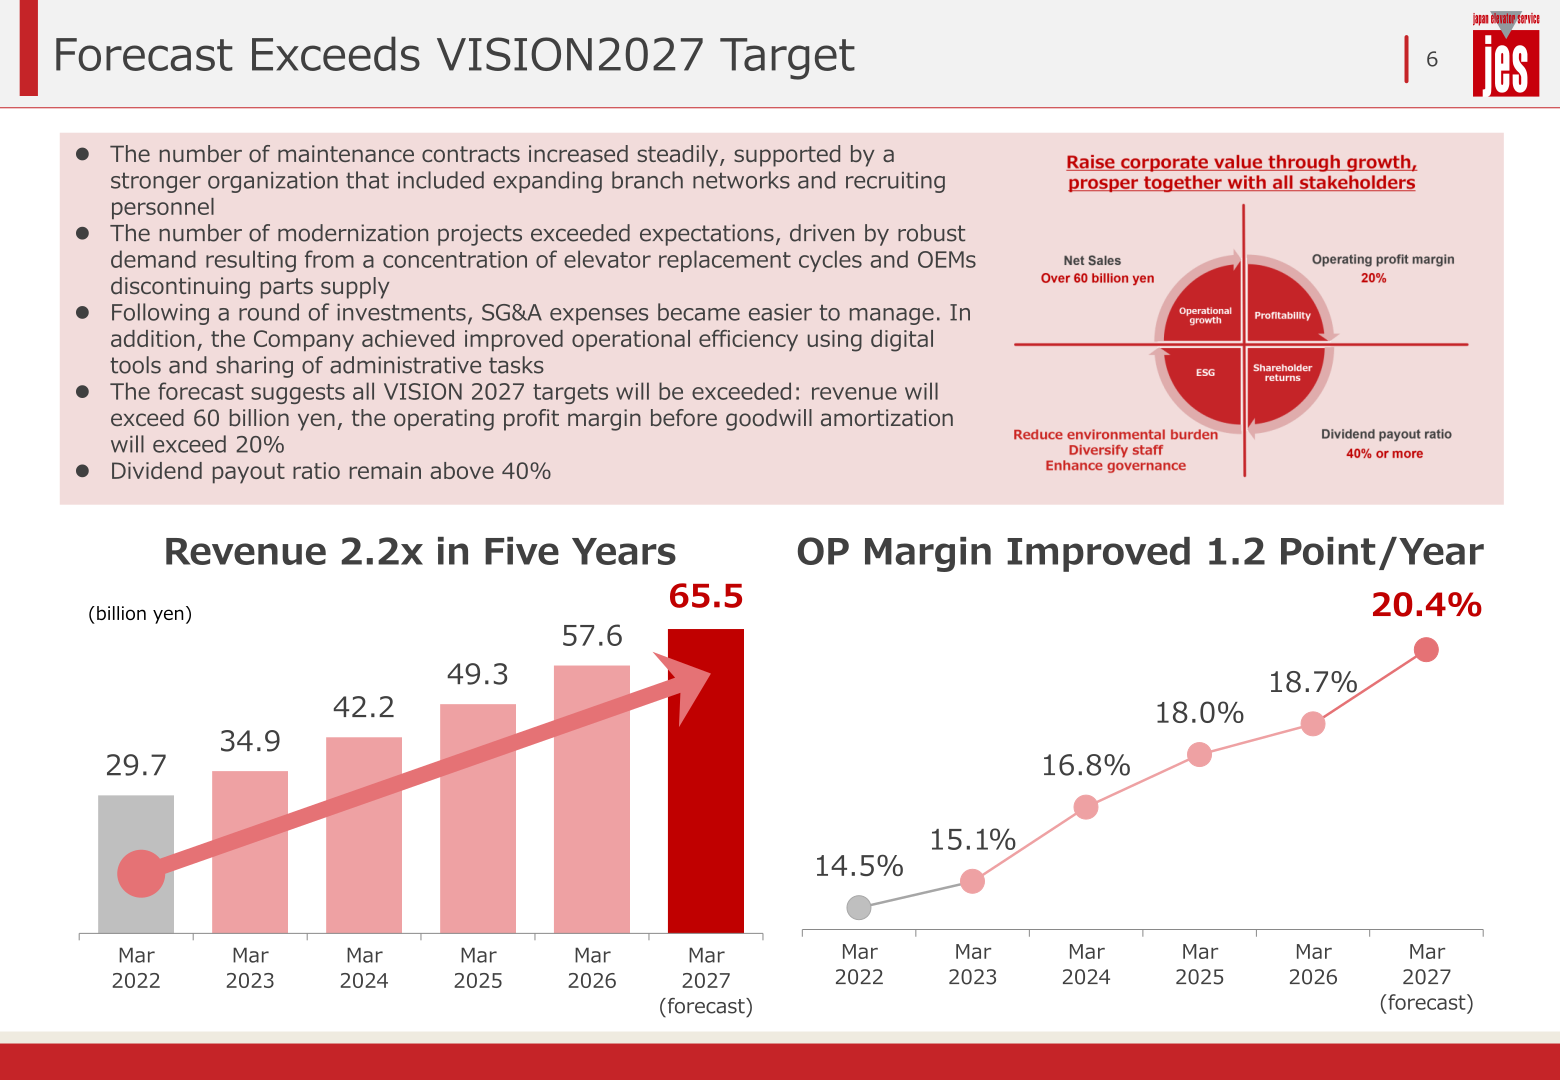
The medium-term management plan VISION2027 sets key indicators to be met by FY Mar 2027 of net sales of over 60 billion yen, an operating profit margin of 20% (before goodwill amortization) and a dividend payout ratio of 40% or more. The materials state that the forecast suggests all VISION2027 targets will be exceeded: revenue will exceed 60 billion yen and the operating profit margin before goodwill amortization will exceed 20%, with the payout ratio remaining above 40%. Net sales have grown from 29.7 billion yen (March 2022) to 57.6 billion yen (March 2026) and a forecast 65.5 billion yen (March 2027), described as revenue 2.2x in five years, while the OP margin before amortization has improved from 14.5% to 18.7% and a forecast 20.4%, or 1.2 points per year. In Japan’s elevator maintenance market, the number of contracts grew to 1.18 million units as of March 2026 from 1.10 million as of March 2022; independents’ share grew to 24% against 76% at OEMs, and JES’s share stood at 11%, by far the largest among independents, with the company expecting to reach 12 to 13% by March 2027 (market 1.20 M units). Capital expenditure and domestic M&A have peaked, and EBITDA and free cash flow are expected to trend upward in parallel going forward. In ESG, the group received SBTi certification on September 11, 2025, targeting a 54.6% reduction in SCOPE1+2 emissions and a 32.5% reduction in SCOPE3 from the FY 2023 level by FY 2033, and net zero across the value chain by the 2050 fiscal year.
This article is an analysis based on publicly available information and is not a recommendation to buy or sell any specific securities. Investment decisions are your own responsibility.
![[Obayashi] Investors’ Guide 2026 — The Complete 24-Article Breakdown](https://japan-equity.com/wp-content/uploads/2026/07/hub_cover-1024x1024.png)
![[Obayashi] IR & SR Policy — Feeding Dialogue Back into Management](https://japan-equity.com/wp-content/uploads/2026/07/p32_sq-1024x1024.jpg)
![[Obayashi] Domestic Civil Engineering — Resilience Spending Supports 9.6% Margin](https://japan-equity.com/wp-content/uploads/2026/07/p11_sq-1024x1024.jpg)
![[Obayashi] Overseas Construction — Orders Reach ¥1.2tn](https://japan-equity.com/wp-content/uploads/2026/07/p15_sq-1024x1024.jpg)
![[Obayashi] Share Price & External Ratings — vs TOPIX, ESG Index Inclusion](https://japan-equity.com/wp-content/uploads/2026/07/p40_sq-1024x1024.jpg)
![[Construction] ¥75.5tn Investment, Shrinking Workforce — Big-5 Market Share](https://japan-equity.com/wp-content/uploads/2026/07/p12_sq-1024x1024.jpg)



![[Obayashi] Capital Policy & Shareholder Returns — ROE 10%+, DOE ~5%, ¥100bn Buyback](https://japan-equity.com/wp-content/uploads/2026/07/p27_sq-1024x1024.jpg)
![[Obayashi] Reducing Cross-Shareholdings — ¥285.2bn Sold in Five Years](https://japan-equity.com/wp-content/uploads/2026/07/p29_sq-1024x1024.jpg)
![[Obayashi] ¥750bn Investment Plan — ¥300bn to Development, ¥190bn to Tech/DX](https://japan-equity.com/wp-content/uploads/2026/07/p30_sq-1024x1024.jpg)
![[Obayashi] MTP2022 KPIs — Operating Profit ~2x Target, ROE 14.4%](https://japan-equity.com/wp-content/uploads/2026/07/p25_sq-1024x1024.jpg)
![[Obayashi] Cash Allocation — ¥420bn Investment CF Over Five Years](https://japan-equity.com/wp-content/uploads/2026/07/p26_sq-1024x1024.jpg)
![[Obayashi] Green Energy — 44 Plants, 344MW, and the Green Hydrogen Challenge](https://japan-equity.com/wp-content/uploads/2026/07/p21_sq-1024x1024.jpg)
![[Obayashi] Tackling the Labor Shortage — Robotics Construction®](https://japan-equity.com/wp-content/uploads/2026/07/p14_sq-1024x1024.jpg)
