
This article is based on publicly available IR materials and is not a recommendation to buy or sell any specific securities.
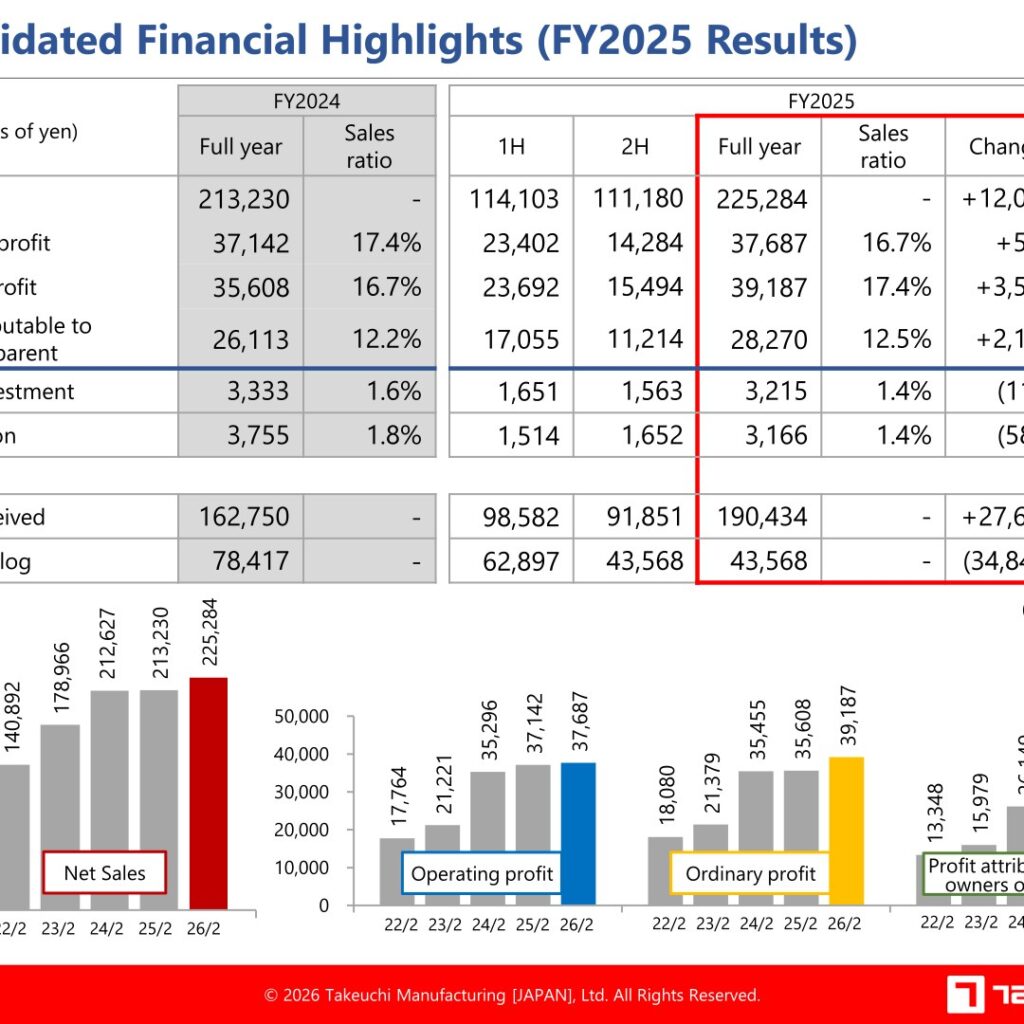
Note: Takeuchi’s accounting period ends in February; in the company’s materials, FY2025 refers to the fiscal year ended February 2026. TAKEUCHI MFG. CO., LTD. (Securities code: 6432) develops, manufactures, and sells compact construction machinery — compact excavators, hydraulic excavators, and track loaders — with North America accounting for 57.0% and Europe 39.7% of net sales. In FY2025 the company posted record highs in both sales and profits: net sales of 225,284 million yen (up 5.7% year on year) and operating profit of 37,687 million yen (up 1.5%), as increased net sales and a reduction in the write-down that occurred in the previous fiscal year offset the impacts of tariffs and foreign exchange rates.
Consolidated Results (Full-Year Actual)
Sales volume increased in both North America (up 1.5% YoY) and Europe (up 1.5% YoY), with total sales volume up 2.4%. In North America, underlying demand for housing remained solid despite a slowdown in home purchases caused by continuously elevated housing prices, and sales of track loaders were strong due to steady demand for lifeline infrastructure work such as water and gas pipes. In Europe, the sluggish product demand bottomed out and gradually recovered, with strong excavator sales at the UK sales subsidiary and European distributors. Ordinary profit rose 10.1% to 39,187 million yen and profit attributable to owners of parent rose 8.3% to 28,270 million yen. Orders received increased 17.0% to 190,434 million yen, while the order backlog declined 44.4% to 43,568 million yen. The company states it will end the disclosure of orders received and order backlogs, with the final figures to be for the fiscal year ending February 2027.
| Item (Millions of yen) | FY2025 | FY2024 | Change | Change (%) |
|---|---|---|---|---|
| Net sales | 225,284 | 213,230 | +12,054 | +5.7% |
| Operating profit | 37,687 | 37,142 | +544 | +1.5% |
| Ordinary profit | 39,187 | 35,608 | +3,578 | +10.1% |
| Profit attributable to owners of parent | 28,270 | 26,113 | +2,156 | +8.3% |
| Orders received | 190,434 | 162,750 | +27,683 | +17.0% |
| Order backlog | 43,568 | 78,417 | (34,849) | (44.4)% |
Sales by Region
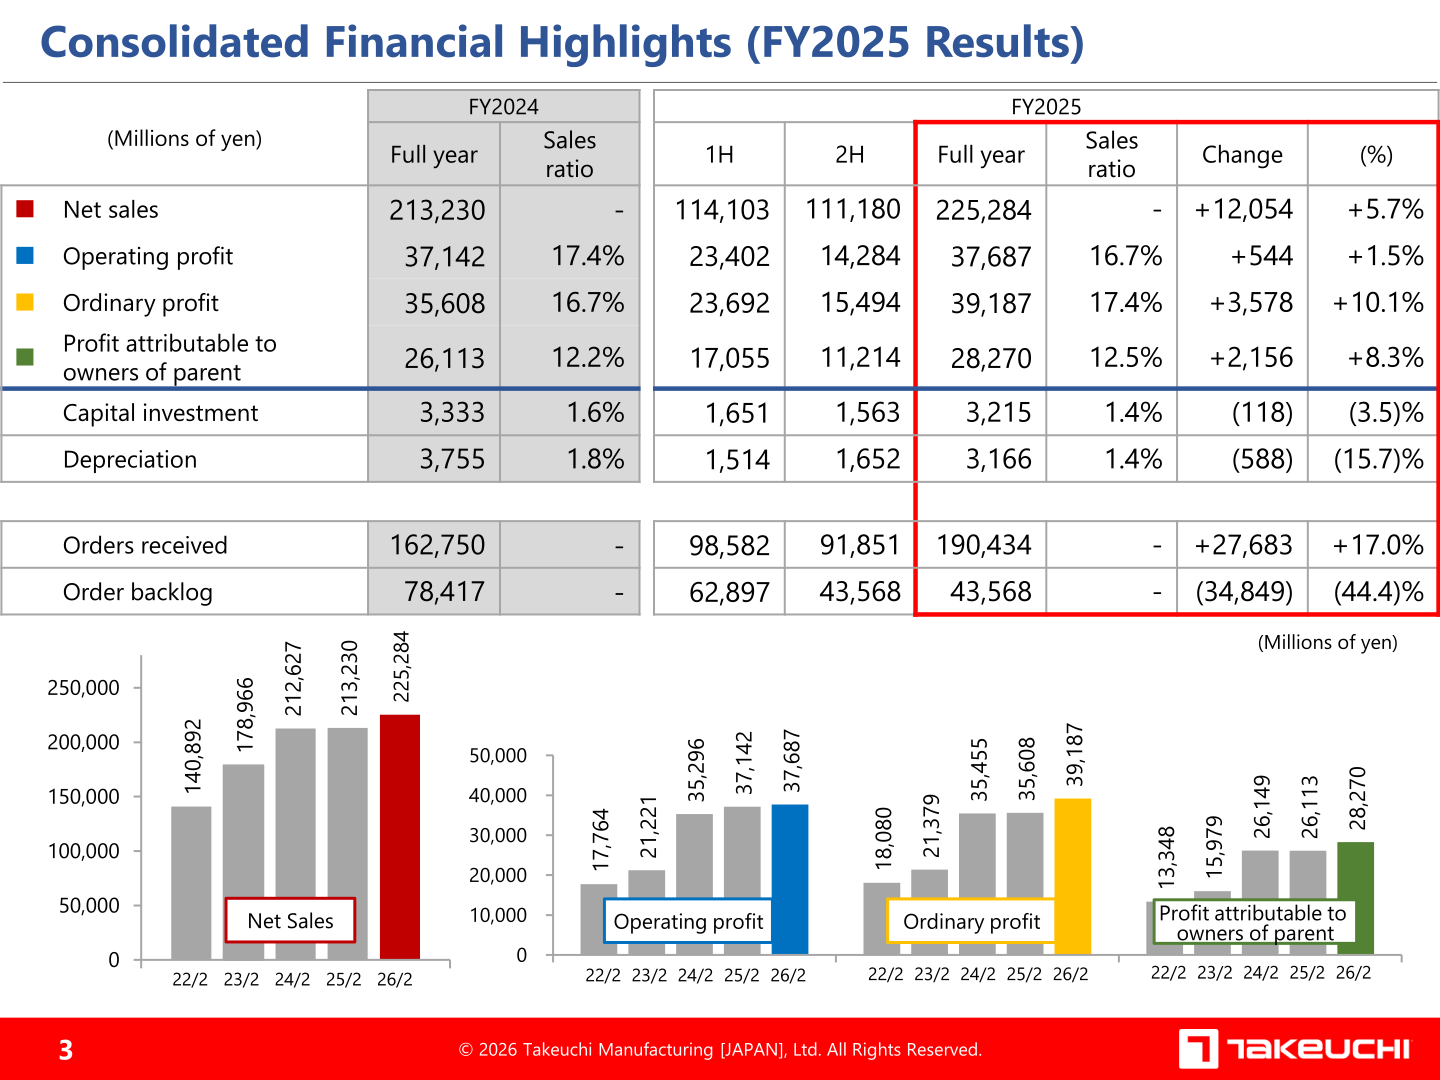
By destination, North America sales rose 7.0% to 128,483 million yen (57.0% of net sales) and Europe rose 2.2% to 89,487 million yen (39.7%). Asia/Oceania grew 42.0% to 4,041 million yen and Others rose 119.6% to 1,896 million yen, while Japan declined 26.7% to 1,376 million yen. Parts sales increased 7.0% to 18,573 million yen (8.2% of net sales). Full-year average exchange rates were 149.97 yen to the US dollar, 200.58 yen to the British pound, and 169.63 yen to the euro.
| Region (Millions of yen) | FY2025 | Sales ratio | FY2024 | Change (%) |
|---|---|---|---|---|
| Japan | 1,376 | 0.6% | 1,878 | (26.7)% |
| North America | 128,483 | 57.0% | 120,064 | +7.0% |
| Europe | 89,487 | 39.7% | 87,578 | +2.2% |
| Asia/Oceania | 4,041 | 1.8% | 2,845 | +42.0% |
| Others | 1,896 | 0.8% | 863 | +119.6% |
| Total net sales | 225,284 | 100.0% | 213,230 | +5.7% |
| Parts sales | 18,573 | 8.2% | 17,362 | +7.0% |
Segment Results
Takeuchi reports geographic segments corresponding to its group companies. The Japan segment (TAKEUCHI MFG. CO., LTD., which develops and manufactures construction machinery and sells to distributors in Europe and Asia/Oceania) posted net sales of 67,812 million yen (up 1.0%) but segment profit fell 8.6% to 31,363 million yen. The US segment (Takeuchi Mfg. (U.S.), Ltd.) grew net sales 7.2% to 128,711 million yen while segment profit declined 38.3% to 6,735 million yen. The UK segment increased net sales 23.6% to 17,976 million yen with segment profit up 147.7% to 1,238 million yen, while the France segment saw net sales decline 4.8% to 10,776 million yen with segment profit down 29.2% to 578 million yen.
| Segment | Item (Millions of yen) | FY2025 | FY2024 | Change (%) |
|---|---|---|---|---|
| Japan | Net sales | 67,812 | 67,133 | +1.0% |
| Japan | Segment profit | 31,363 | 34,305 | (8.6)% |
| US | Net sales | 128,711 | 120,103 | +7.2% |
| US | Segment profit | 6,735 | 10,911 | (38.3)% |
| UK | Net sales | 17,976 | 14,547 | +23.6% |
| UK | Segment profit | 1,238 | 499 | +147.7% |
| France | Net sales | 10,776 | 11,325 | (4.8)% |
| France | Segment profit | 578 | 816 | (29.2)% |
| China | Net sales | 6 | 120 | (94.4)% |
| China | Segment profit | 254 | 297 | (14.4)% |
FY2026 Forecast
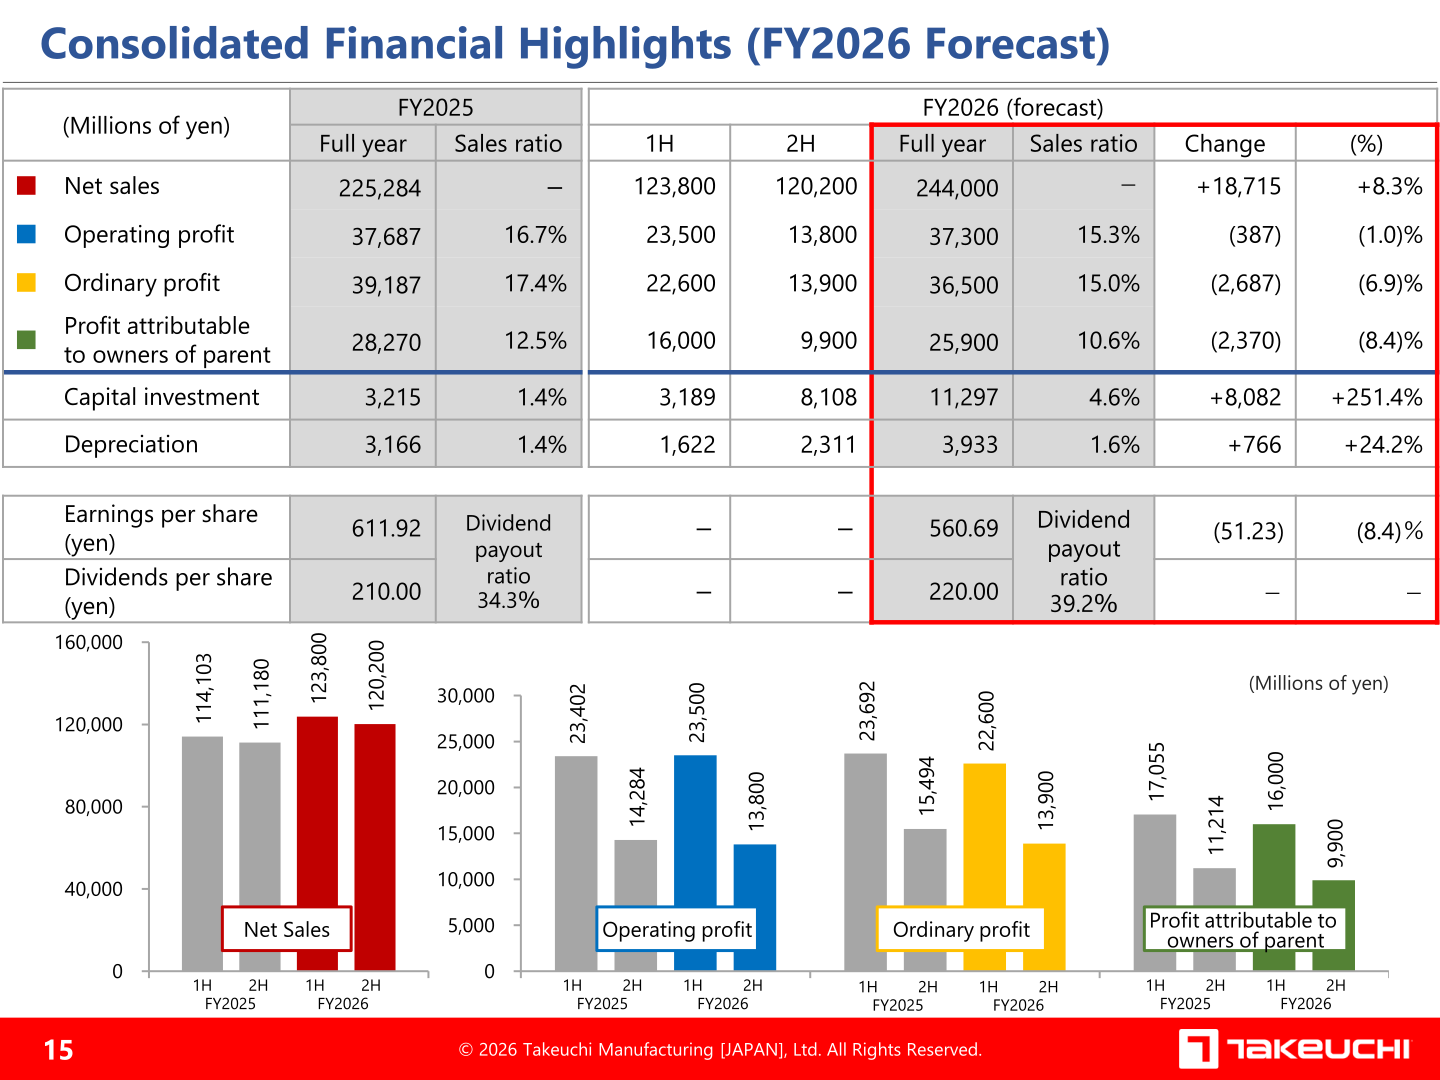
For FY2026 the company expects sales volume to increase in both the North American market (up 3.9% YoY) and the European market (up 6.1% YoY), with total sales volume up 5.7%, and net sales are expected to reach a record high. Operating profit is forecast to decline 1.0%, with growing sales volume and sales price increases in Europe and North America offset by tariff impacts, fuel surcharges, rising parts prices, and human capital investments. Ordinary profit is forecast to decline 6.9%, reflecting expected exchange rate losses under the assumption of a stronger yen. US tariff costs are estimated at 18.69 billion yen for FY2026 (versus 5.14 billion yen in FY2025), with an impact on operating profit of (11.20 billion yen), partly offset by tariff-related price pass-through of 7.49 billion yen. Assumed exchange rates are 147.00 yen to the US dollar, 200.00 yen to the British pound, and 174.00 yen to the euro. Capital investment is planned at 11,297 million yen (up 251.4%), including 6.0 billion yen for the new Aoki factory.
| Item (Millions of yen) | FY2026 (Forecast) | FY2025 (Actual) | Change (%) |
|---|---|---|---|
| Net sales | 244,000 | 225,284 | +8.3% |
| Operating profit | 37,300 | 37,687 | (1.0)% |
| Ordinary profit | 36,500 | 39,187 | (6.9)% |
| Profit attributable to owners of parent | 25,900 | 28,270 | (8.4)% |
| Earnings per share (yen) | 560.69 | 611.92 | (8.4)% |
| Dividends per share (yen) | 220.00 | 210.00 | – |
Shareholder Returns
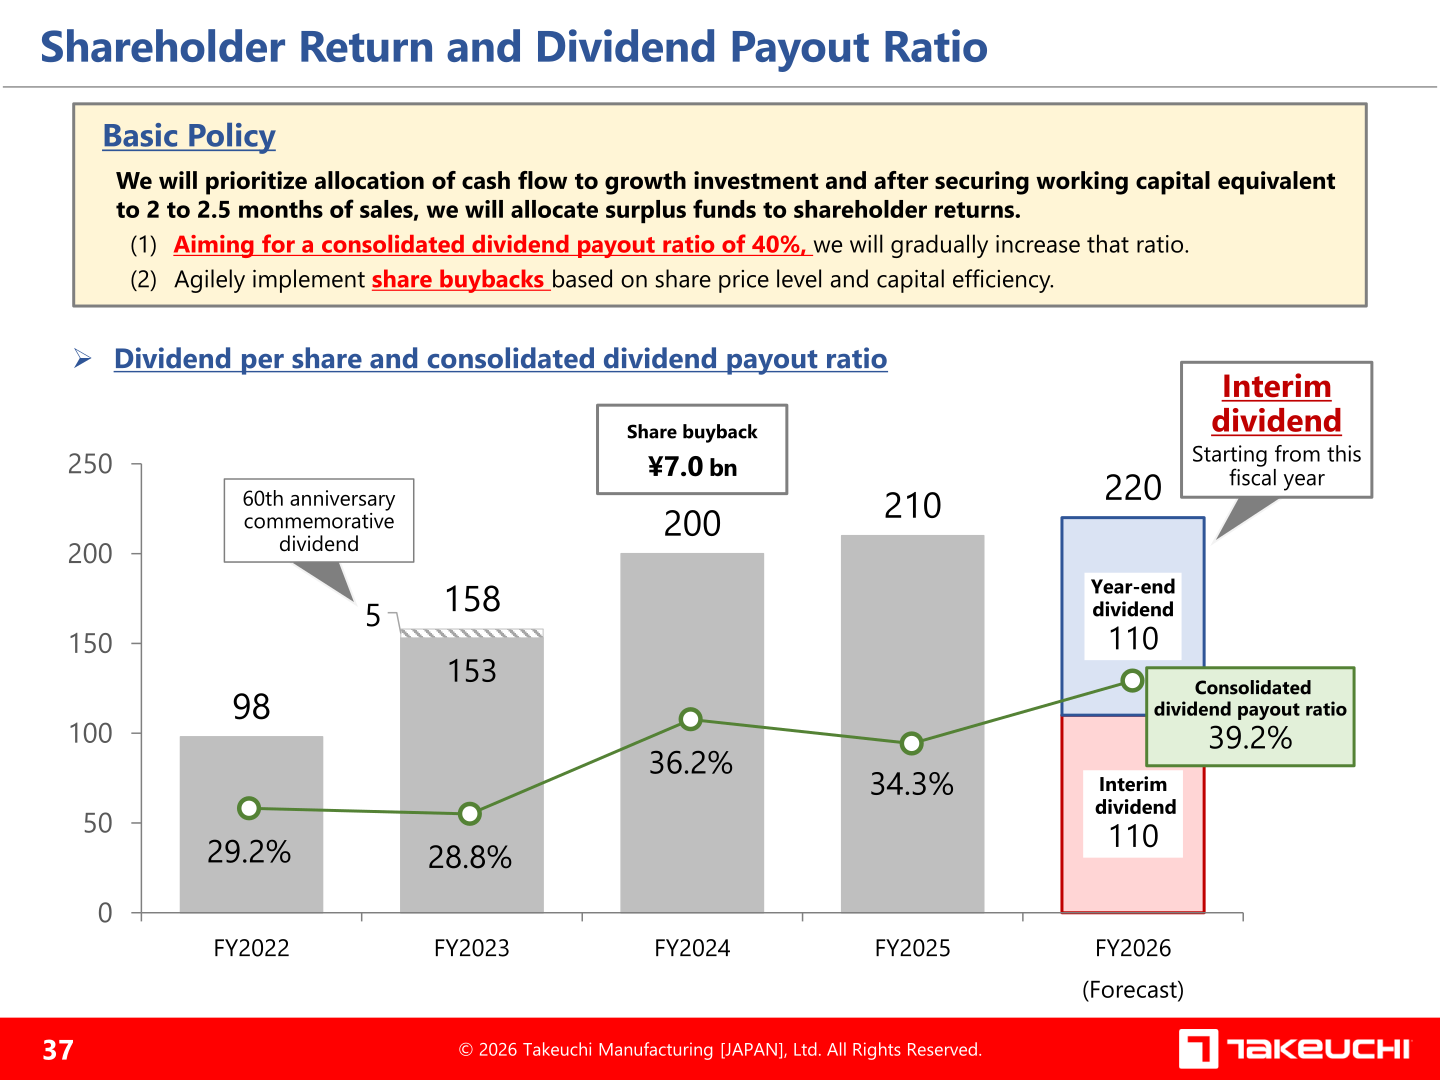
The basic policy is to prioritize allocation of cash flow to growth investment and, after securing working capital equivalent to 2 to 2.5 months of sales, allocate surplus funds to shareholder returns. The company aims for a consolidated dividend payout ratio of 40%, gradually increasing the ratio, and will agilely implement share buybacks based on share price level and capital efficiency. The FY2025 dividend was 210 yen per share (consolidated payout ratio 34.3%), and the FY2026 forecast is 220 yen per share (payout ratio 39.2%), consisting of an interim dividend of 110 yen — introduced starting from this fiscal year — and a year-end dividend of 110 yen.
Medium-Term Plan
Under the Fourth Medium-term Business Plan (FY2025–FY2027) with the slogan “Building Excellence,” Takeuchi targets consolidated net sales of 300 billion yen (a 50% increase in consolidated sales volume), operating profit of 52.0 billion yen (17.3% ratio), EPS of 800 yen, and ROE of 17% or more in FY2027. By region, FY2027 targets are North America net sales of 178.4 billion yen (sales volume up 60%) and Europe net sales of 108.7 billion yen (up 30%). Cash allocation for FY2025–FY2027 comprises growth investment of 36.0 billion yen and total dividends of 36.5 billion yen over the three years. The company states there are no changes to its medium- to long-term business strategy amid challenging and uncertain conditions stemming from US tariffs and the situation in the Middle East. Construction of a new track loader factory next to the Aoki Factory — total investment of 18.0 billion yen, raising production capacity 30% versus February 2025 — has been postponed by approximately one year, with the start of operations now expected around February 2029. In the US, the dealer network expanded to 307 locations as of December 31, 2025, toward a target of 360 locations in 2027. The company recognizes its cost of equity as 10% and targets a long-term ROE range of 15-18%.
This article is an analysis based on publicly available information and is not a recommendation to buy or sell any specific securities. Investment decisions are your own responsibility.
![[Obayashi] Investors’ Guide 2026 — The Complete 24-Article Breakdown](https://japan-equity.com/wp-content/uploads/2026/07/hub_cover-1024x1024.png)
![[Obayashi] IR & SR Policy — Feeding Dialogue Back into Management](https://japan-equity.com/wp-content/uploads/2026/07/p32_sq-1024x1024.jpg)
![[Obayashi] Domestic Civil Engineering — Resilience Spending Supports 9.6% Margin](https://japan-equity.com/wp-content/uploads/2026/07/p11_sq-1024x1024.jpg)
![[Obayashi] Overseas Construction — Orders Reach ¥1.2tn](https://japan-equity.com/wp-content/uploads/2026/07/p15_sq-1024x1024.jpg)
![[Obayashi] Share Price & External Ratings — vs TOPIX, ESG Index Inclusion](https://japan-equity.com/wp-content/uploads/2026/07/p40_sq-1024x1024.jpg)
![[Construction] ¥75.5tn Investment, Shrinking Workforce — Big-5 Market Share](https://japan-equity.com/wp-content/uploads/2026/07/p12_sq-1024x1024.jpg)



![[Obayashi] Capital Policy & Shareholder Returns — ROE 10%+, DOE ~5%, ¥100bn Buyback](https://japan-equity.com/wp-content/uploads/2026/07/p27_sq-1024x1024.jpg)
![[Obayashi] Reducing Cross-Shareholdings — ¥285.2bn Sold in Five Years](https://japan-equity.com/wp-content/uploads/2026/07/p29_sq-1024x1024.jpg)
![[Obayashi] ¥750bn Investment Plan — ¥300bn to Development, ¥190bn to Tech/DX](https://japan-equity.com/wp-content/uploads/2026/07/p30_sq-1024x1024.jpg)
![[Obayashi] MTP2022 KPIs — Operating Profit ~2x Target, ROE 14.4%](https://japan-equity.com/wp-content/uploads/2026/07/p25_sq-1024x1024.jpg)
![[Obayashi] Cash Allocation — ¥420bn Investment CF Over Five Years](https://japan-equity.com/wp-content/uploads/2026/07/p26_sq-1024x1024.jpg)
![[Obayashi] Green Energy — 44 Plants, 344MW, and the Green Hydrogen Challenge](https://japan-equity.com/wp-content/uploads/2026/07/p21_sq-1024x1024.jpg)
![[Obayashi] Tackling the Labor Shortage — Robotics Construction®](https://japan-equity.com/wp-content/uploads/2026/07/p14_sq-1024x1024.jpg)
