
This article is based on publicly available IR materials and is not a recommendation to buy or sell any specific securities.
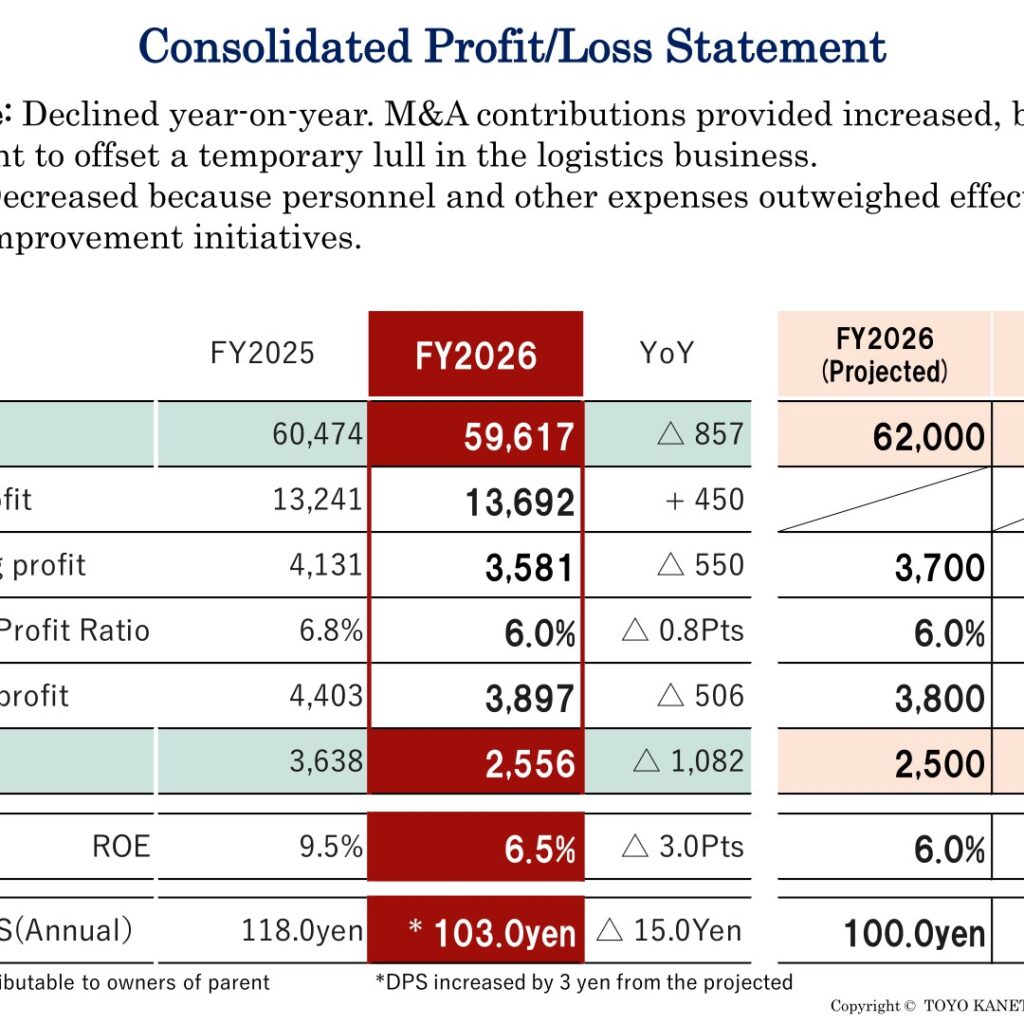
Note: this site classifies the most recently completed fiscal year as FY2025, while the company’s materials label the year ended March 2026 as “FY2026” (the deck states “FY2026: Ended March 2026”); all tables, segment labels and figures below keep the company’s own notation. For FY2026, TOYO KANETSU K.K. (6369) reported net sales of 59,617 million yen (△ 857 million yen year on year), operating profit of 3,581 million yen (△ 550 million yen), ordinary profit of 3,897 million yen (△ 506 million yen) and profit attributable to owners of parent of 2,556 million yen (△ 1,082 million yen). Revenue declined year-on-year because increased M&A contributions were insufficient to offset a temporary lull in the logistics business, and profit decreased because personnel and other expenses outweighed effective cost-of-sales improvement initiatives. Consolidated order backlog nevertheless rose to 46,082 million yen, and the company describes itself as carrying a substantial order backlog entering the next period.
Consolidated Results (Full-Year Actual)
Net sales came in 2,382 million yen below the company’s 62,000 million yen projection and operating profit 118 million yen below the 3,700 million yen projection, while ordinary profit exceeded its projection by 97 million yen and profit attributable to owners of parent exceeded its projection by 56 million yen. The operating profit ratio was 6.0%, down 0.8 points year on year and in line with the 6.0% projection. ROE was 6.5%, down 3.0 points year on year but 0.5 points above the 6.0% projection. The annual dividend per share was 103.0 yen, 15.0 yen lower than the previous year but 3.0 yen above the projected 100.0 yen. Unit: million yen.
| Item | FY2025 | FY2026 | YoY | FY2026 (Projected) | Actual − Projected |
|---|---|---|---|---|---|
| Net sales | 60,474 | 59,617 | △ 857 | 62,000 | △ 2,382 |
| Gross profit | 13,241 | 13,692 | + 450 | — | — |
| Operating profit | 4,131 | 3,581 | △ 550 | 3,700 | △ 118 |
| Op. Profit Ratio | 6.8% | 6.0% | △ 0.8Pts | 6.0% | + 0.0Pts |
| Ordinary profit | 4,403 | 3,897 | △ 506 | 3,800 | + 97 |
| Profit (attributable to owners of parent) | 3,638 | 2,556 | △ 1,082 | 2,500 | + 56 |
| ROE | 9.5% | 6.5% | △ 3.0Pts | 6.0% | + 0.5Pts |
| DPS (Annual) | 118.0yen | 103.0yen | △ 15.0Yen | 100.0yen | + 3.0Yen |
Segment Results
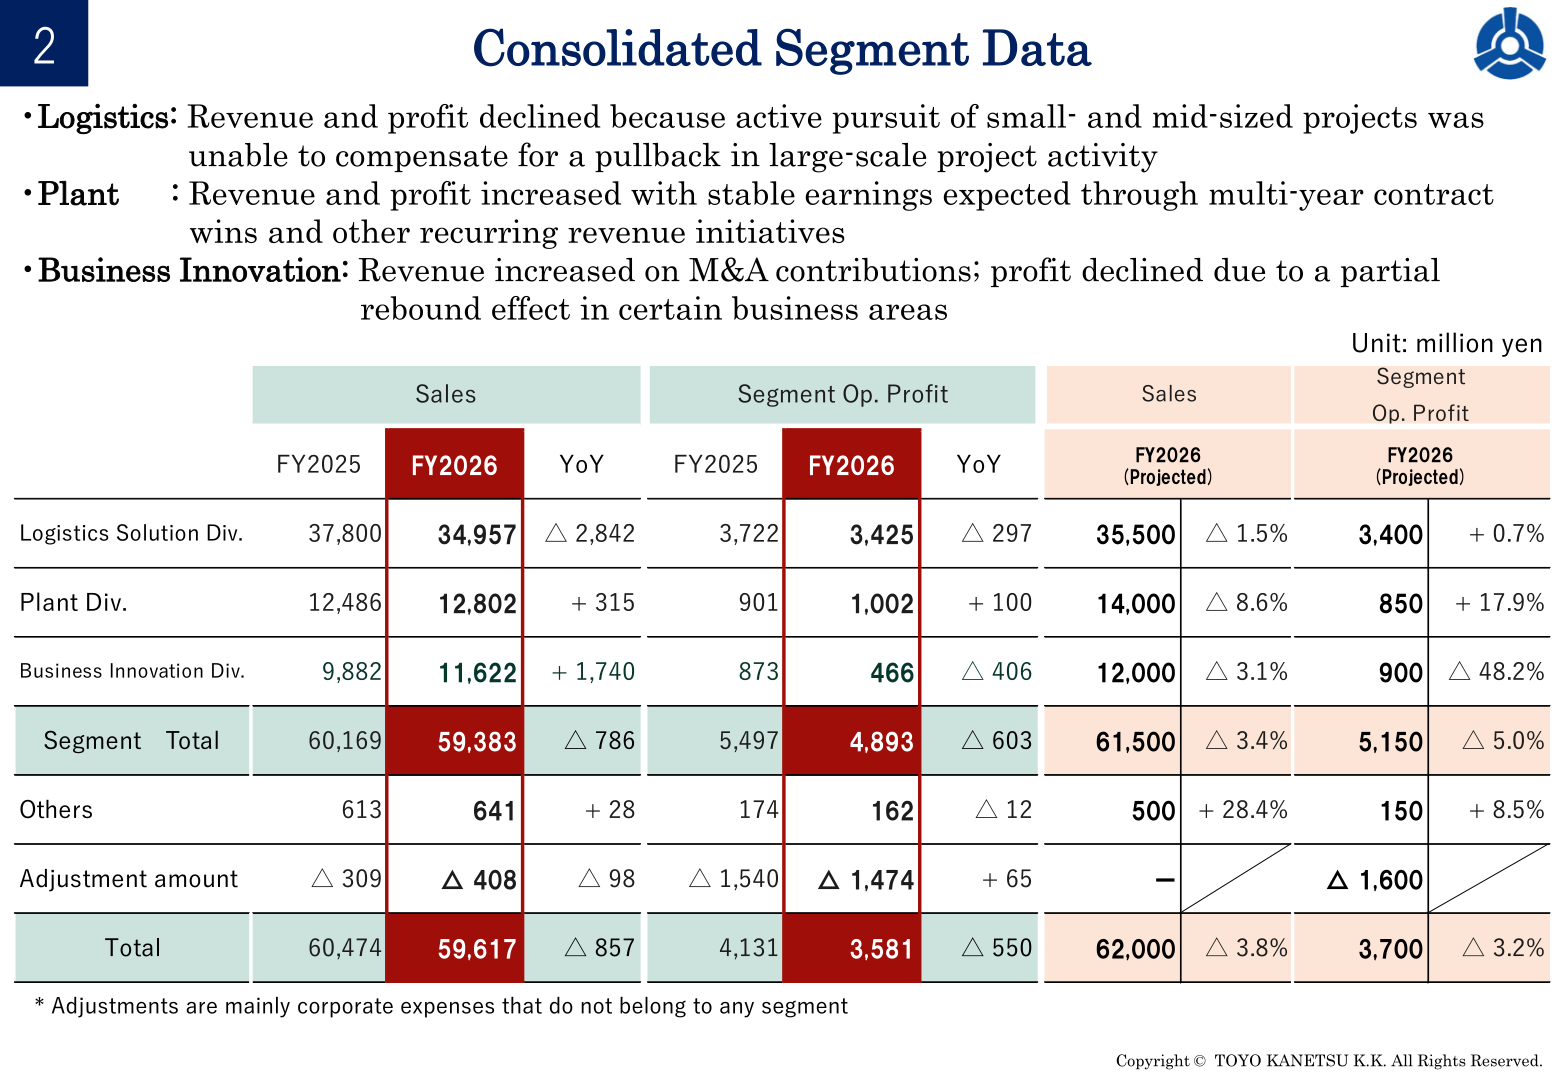
In the Logistics Solution Div., revenue and profit declined because active pursuit of small- and mid-sized projects was unable to compensate for a pullback in large-scale project activity. In the Plant Div., revenue and profit increased with stable earnings expected through multi-year contract wins and other recurring revenue initiatives. In the Business Innovation Div., revenue increased on M&A contributions while profit declined due to a partial rebound effect in certain business areas. Against the FY2026 projections, Logistics Solution Div. sales came in 1.5% lower and Plant Div. sales 8.6% lower, while Plant Div. segment operating profit was 17.9% above projection and Business Innovation Div. segment operating profit was 48.2% below projection. Adjustments are mainly corporate expenses that do not belong to any segment. Unit: million yen.
| Segment | Sales FY2025 | Sales FY2026 | Sales YoY | Segment Op. Profit FY2025 | Segment Op. Profit FY2026 | Segment Op. Profit YoY |
|---|---|---|---|---|---|---|
| Logistics Solution Div. | 37,800 | 34,957 | △ 2,842 | 3,722 | 3,425 | △ 297 |
| Plant Div. | 12,486 | 12,802 | + 315 | 901 | 1,002 | + 100 |
| Business Innovation Div. | 9,882 | 11,622 | + 1,740 | 873 | 466 | △ 406 |
| Segment Total | 60,169 | 59,383 | △ 786 | 5,497 | 4,893 | △ 603 |
| Others | 613 | 641 | + 28 | 174 | 162 | △ 12 |
| Adjustment amount | △ 309 | △ 408 | △ 98 | △ 1,540 | △ 1,474 | + 65 |
| Total | 60,474 | 59,617 | △ 857 | 4,131 | 3,581 | △ 550 |
Order Intake and Backlog
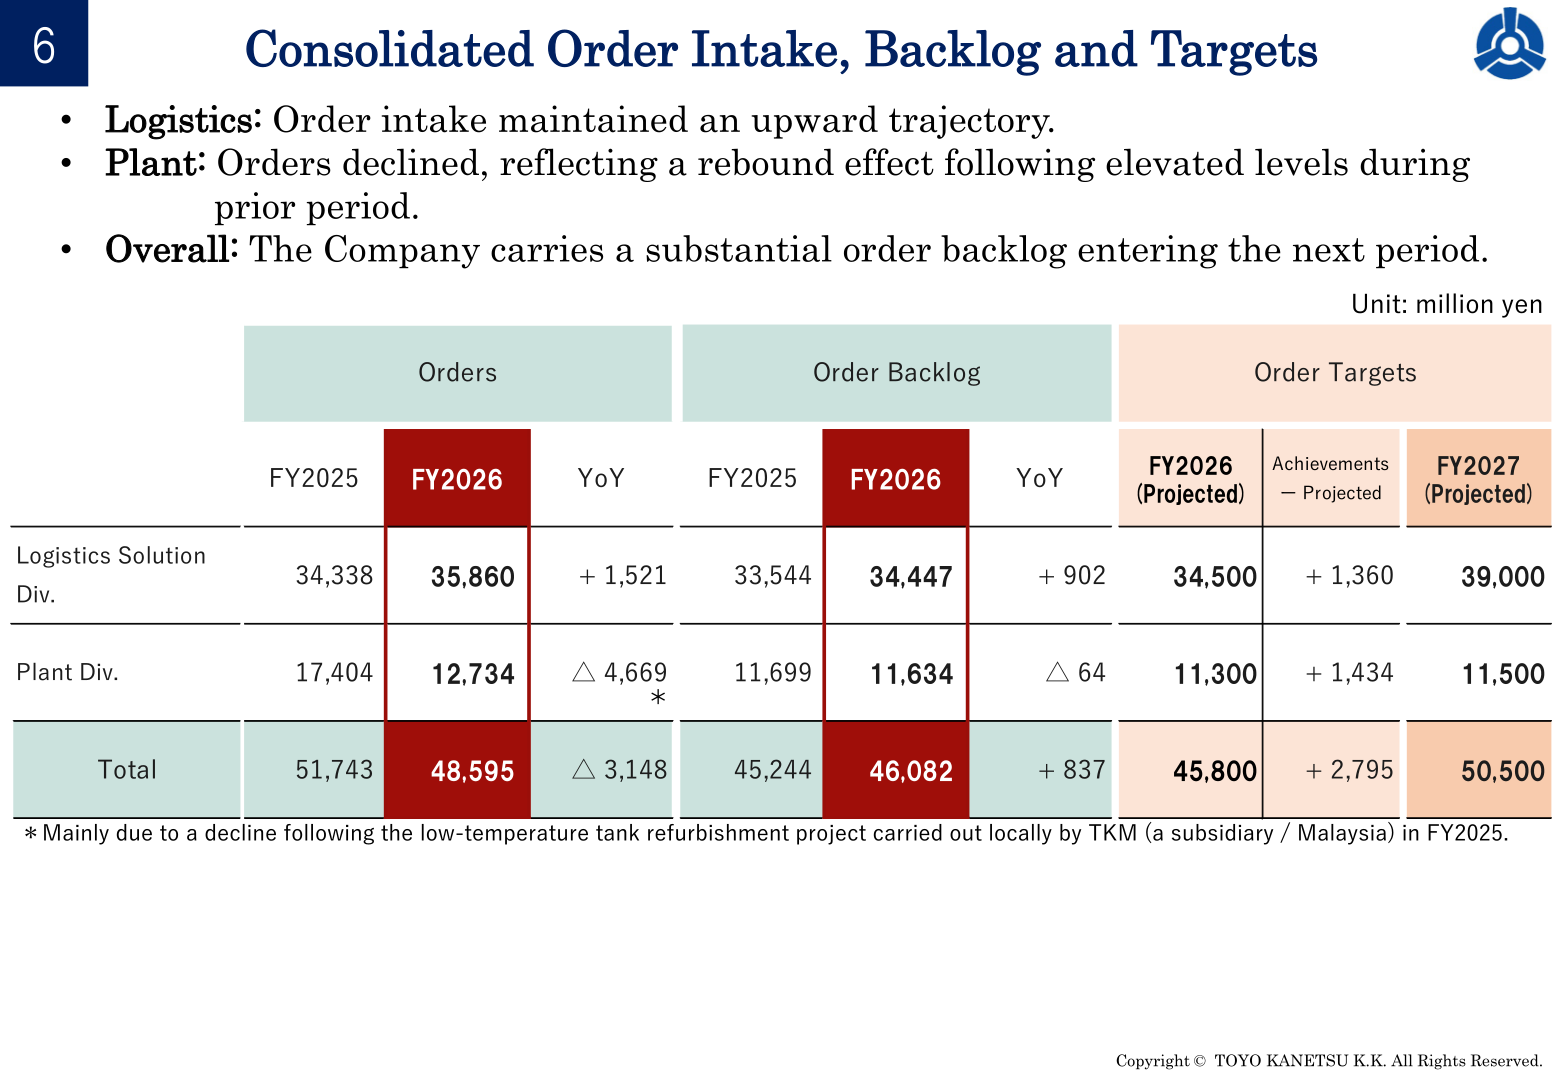
Consolidated order intake was 48,595 million yen, down 3,148 million yen year on year, while order backlog rose 837 million yen to 46,082 million yen. Logistics Solution Div. order intake maintained an upward trajectory at 35,860 million yen (+ 1,521 million yen). Plant Div. orders declined to 12,734 million yen (△ 4,669 million yen), reflecting a rebound effect following elevated levels during the prior period; the company notes this was mainly due to a decline following the low-temperature tank refurbishment project carried out locally by TKM (a subsidiary / Malaysia) in FY2025. Total order intake exceeded the FY2026 order target of 45,800 million yen by 2,795 million yen, and the FY2027 order target is 50,500 million yen. Unit: million yen.
| Division | Orders FY2025 | Orders FY2026 | Orders YoY | Order Backlog FY2025 | Order Backlog FY2026 | Order Backlog YoY | FY2026 Order Target (Projected) | FY2027 Order Target (Projected) |
|---|---|---|---|---|---|---|---|---|
| Logistics Solution Div. | 34,338 | 35,860 | + 1,521 | 33,544 | 34,447 | + 902 | 34,500 | 39,000 |
| Plant Div. | 17,404 | 12,734 | △ 4,669 | 11,699 | 11,634 | △ 64 | 11,300 | 11,500 |
| Total | 51,743 | 48,595 | △ 3,148 | 45,244 | 46,082 | + 837 | 45,800 | 50,500 |
FY2027 Forecast
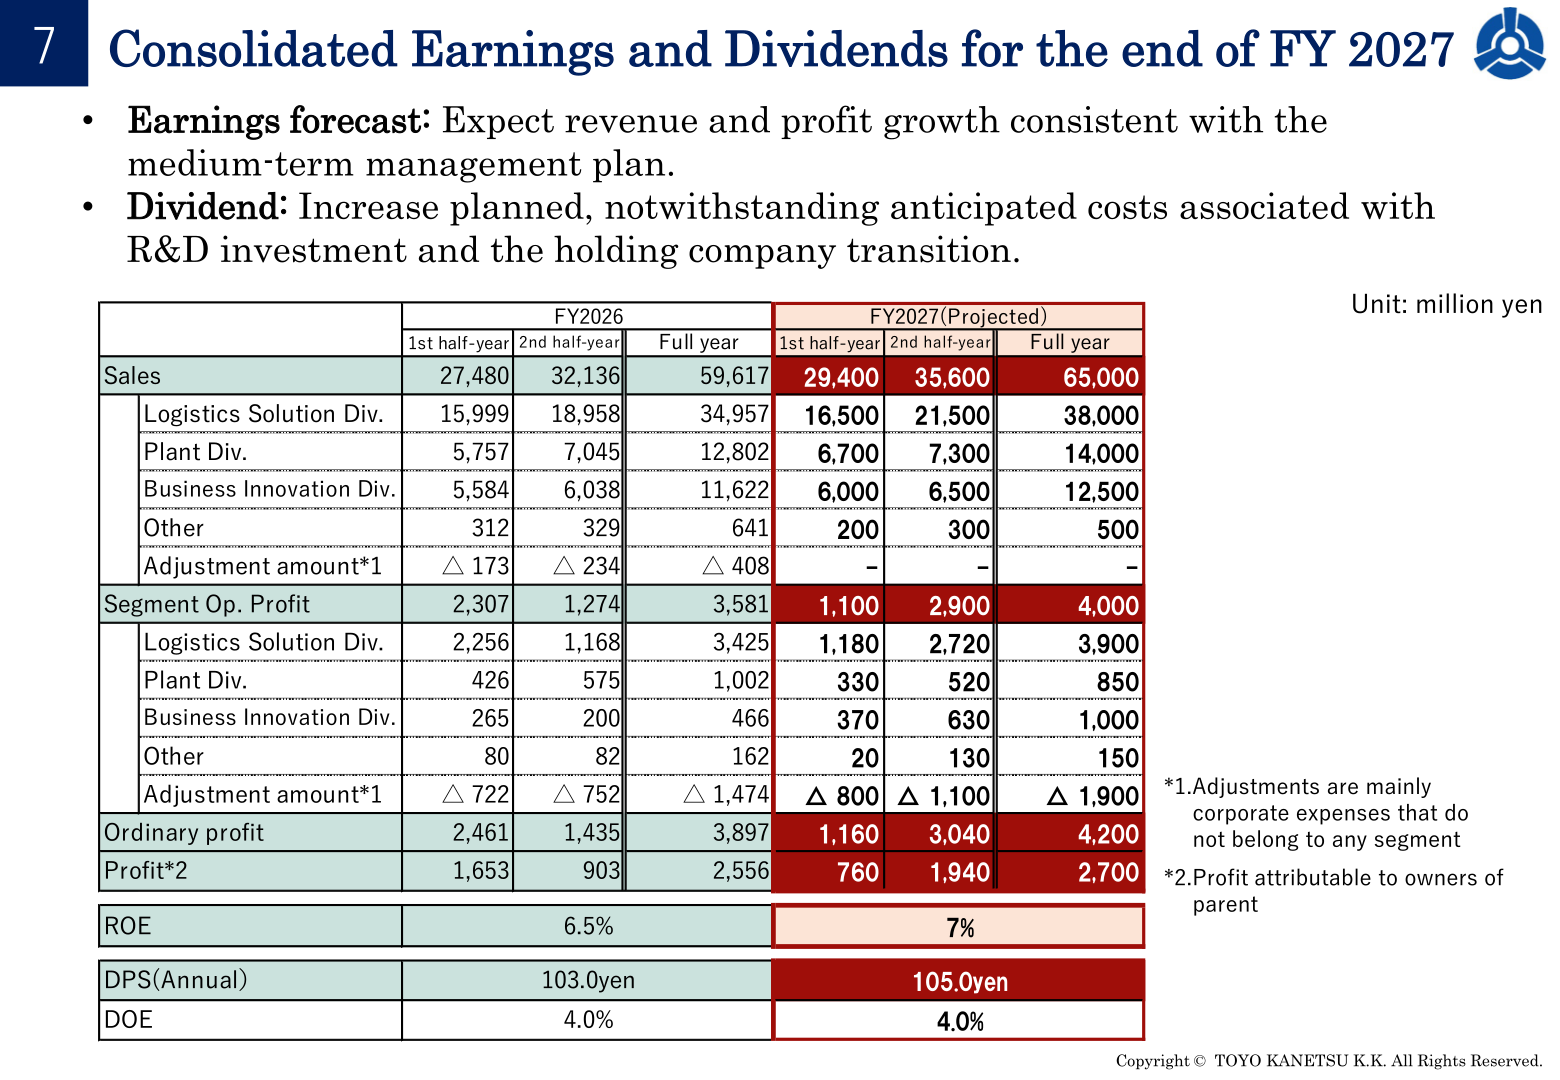
For FY2027 the company expects revenue and profit growth consistent with the medium-term management plan, projecting sales of 65,000 million yen, segment operating profit of 4,000 million yen, ordinary profit of 4,200 million yen and profit attributable to owners of parent of 2,700 million yen, with ROE of 7%. By half-year, first-half sales of 29,400 million yen and second-half sales of 35,600 million yen are projected, with segment operating profit of 1,100 million yen and 2,900 million yen respectively. Unit: million yen.
| Item | FY2026 (Full year) | FY2027 (Projected, Full year) |
|---|---|---|
| Sales | 59,617 | 65,000 |
| Logistics Solution Div. (Sales) | 34,957 | 38,000 |
| Plant Div. (Sales) | 12,802 | 14,000 |
| Business Innovation Div. (Sales) | 11,622 | 12,500 |
| Other (Sales) | 641 | 500 |
| Adjustment amount (Sales) | △ 408 | − |
| Segment Op. Profit | 3,581 | 4,000 |
| Logistics Solution Div. (Segment Op. Profit) | 3,425 | 3,900 |
| Plant Div. (Segment Op. Profit) | 1,002 | 850 |
| Business Innovation Div. (Segment Op. Profit) | 466 | 1,000 |
| Other (Segment Op. Profit) | 162 | 150 |
| Adjustment amount (Segment Op. Profit) | △ 1,474 | △ 1,900 |
| Ordinary profit | 3,897 | 4,200 |
| Profit (attributable to owners of parent) | 2,556 | 2,700 |
| ROE | 6.5% | 7% |
| DPS (Annual) | 103.0yen | 105.0yen |
| DOE | 4.0% | 4.0% |
Shareholder Returns
The annual dividend per share for FY2026 was 103.0 yen, 3.0 yen above the projected 100.0 yen and 15.0 yen below the 118.0 yen paid in FY2025. DOE (dividend on equity ratio) was 4.0% and DPR (dividend payout ratio) was 62.6%, against 4.8% and 50.0% respectively in FY2025. For FY2027 the company plans an annual dividend of 105.0 yen with DOE of 4.0%, describing the increase as planned notwithstanding anticipated costs associated with R&D investment and the holding company transition.
Management Indicators and Financial Position
EPS was 164.52 yen and BPS 2,585.25 yen, with an equity ratio of 58.0%. The period-end closing share price was 2,753.0 yen, giving a PER of 16.73x and a PBR of 1.06x, against 0.73x in FY2025. Through the practice of “management conscious of capital costs and share price,” the company aims to achieve a price-to-book ratio exceeding 1.0x. Total assets increased 2,084 million yen to 69,521 million yen and total net assets increased 1,391 million yen to 40,301 million yen; short-term borrowings were reduced through group-wide cash management initiatives and improved receivables collection, while fixed assets increased due to the consolidation of Sakata Denki and facility expansion at Eco Analysis Corporation. Cash flows from operating activities were 6,567 million yen (+ 1,266 million yen), investing activities △ 2,072 million yen and financing activities △ 3,877 million yen, leaving cash and cash equivalents at end of year of 7,071 million yen (+ 620 million yen).
This article is an analysis based on publicly available information and is not a recommendation to buy or sell any specific securities. Investment decisions are your own responsibility.
![[Obayashi] Investors’ Guide 2026 — The Complete 24-Article Breakdown](https://japan-equity.com/wp-content/uploads/2026/07/hub_cover-1024x1024.png)
![[Obayashi] IR & SR Policy — Feeding Dialogue Back into Management](https://japan-equity.com/wp-content/uploads/2026/07/p32_sq-1024x1024.jpg)
![[Obayashi] Real Estate Development — 18.7% Margin, ¥287.7bn Unrealized Gains](https://japan-equity.com/wp-content/uploads/2026/07/p20_sq-1024x1024.jpg)
![[Obayashi] Domestic Civil Engineering — Resilience Spending Supports 9.6% Margin](https://japan-equity.com/wp-content/uploads/2026/07/p11_sq-1024x1024.jpg)
![[Obayashi] Share Price & External Ratings — vs TOPIX, ESG Index Inclusion](https://japan-equity.com/wp-content/uploads/2026/07/p40_sq-1024x1024.jpg)
![[Construction] ¥75.5tn Investment, Shrinking Workforce — Big-5 Market Share](https://japan-equity.com/wp-content/uploads/2026/07/p12_sq-1024x1024.jpg)



![[Obayashi] Capital Policy & Shareholder Returns — ROE 10%+, DOE ~5%, ¥100bn Buyback](https://japan-equity.com/wp-content/uploads/2026/07/p27_sq-1024x1024.jpg)
![[Obayashi] Reducing Cross-Shareholdings — ¥285.2bn Sold in Five Years](https://japan-equity.com/wp-content/uploads/2026/07/p29_sq-1024x1024.jpg)
![[Obayashi] ¥750bn Investment Plan — ¥300bn to Development, ¥190bn to Tech/DX](https://japan-equity.com/wp-content/uploads/2026/07/p30_sq-1024x1024.jpg)
![[Obayashi] MTP2022 KPIs — Operating Profit ~2x Target, ROE 14.4%](https://japan-equity.com/wp-content/uploads/2026/07/p25_sq-1024x1024.jpg)
![[Obayashi] Cash Allocation — ¥420bn Investment CF Over Five Years](https://japan-equity.com/wp-content/uploads/2026/07/p26_sq-1024x1024.jpg)
![[Obayashi] Green Energy — 44 Plants, 344MW, and the Green Hydrogen Challenge](https://japan-equity.com/wp-content/uploads/2026/07/p21_sq-1024x1024.jpg)
![[Obayashi] Tackling the Labor Shortage — Robotics Construction®](https://japan-equity.com/wp-content/uploads/2026/07/p14_sq-1024x1024.jpg)
