
This article is based on publicly available IR materials and is not a recommendation to buy or sell any specific securities.
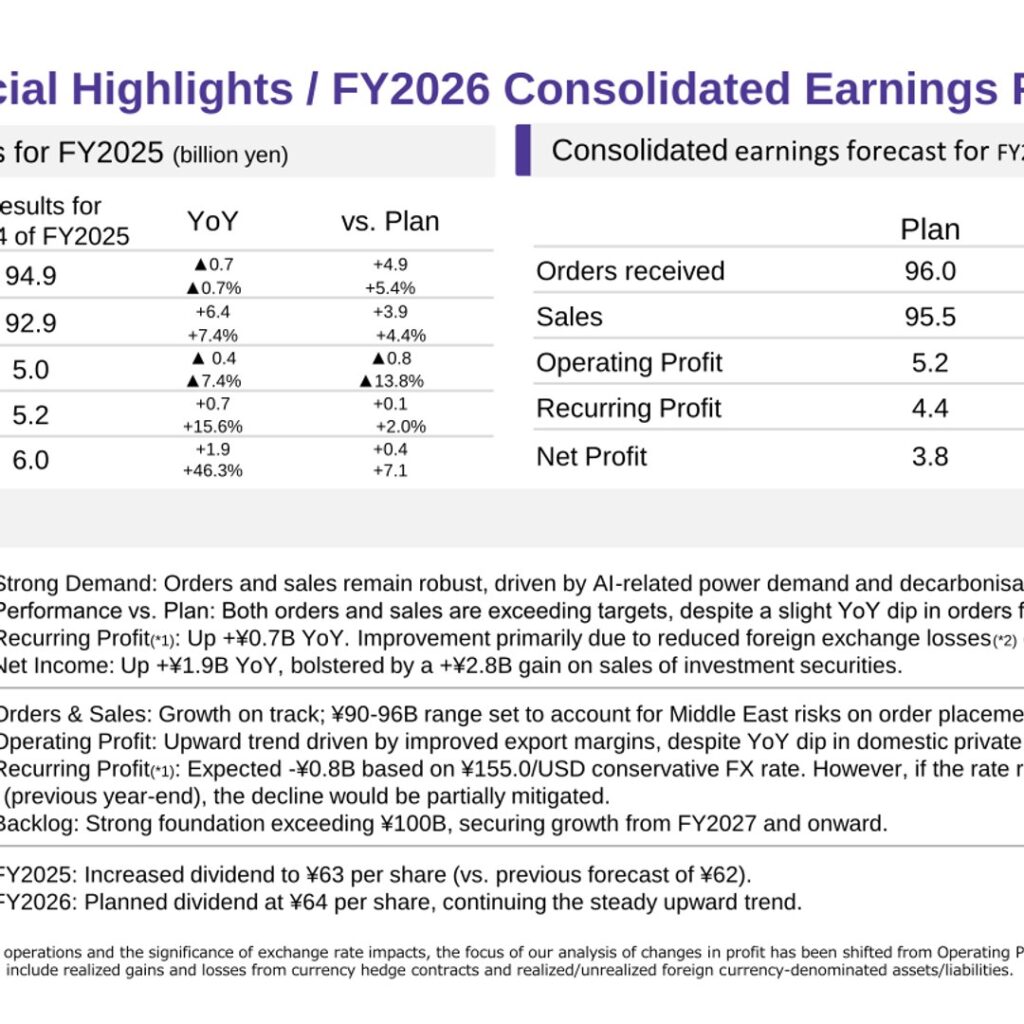
Torishima Manufacturing Co., Ltd. (Torishima Pump Mfg. Co., Ltd., 6363) reported consolidated sales of 92.9 billion yen for Fiscal Year 2025 (ending March 2026), up 6.4 billion yen or 7.4% year on year and 3.9 billion yen above its 89.0 billion yen plan. Orders received came to 94.9 billion yen, down 0.7 billion yen (▲0.7%) from the prior year’s record but 4.9 billion yen above plan, while the order backlog rose to 106.2 billion yen. Operating profit fell 7.4% to 5.0 billion yen, but ordinary profit rose 15.6% to 5.2 billion yen on reduced foreign exchange losses, and net profit rose 46.3% to 6.0 billion yen, helped by a gain on sales of investment securities. The company describes the year as one of “Record Revenues,” with a slower desalination market “fully replaced by a focus on the power market.”
Consolidated Results (Full-Year Actual)
Gross profit rose 3.4% to 24.3 billion yen, though the gross profit margin declined 1.0 point to 26.2%. SG&A expenses increased 6.6% to 19.3 billion yen, leaving operating profit at 5.0 billion yen (margin 5.4%, ▲0.8 point). Non-operating profit or loss swung from ▲0.9 billion yen to +0.2 billion yen; the company notes that foreign exchange losses narrowed from -1.4 billion yen to -0.5 billion yen. Extraordinary profit of 2.8 billion yen included a 2.8 billion yen gain on sales of investment securities. ROE improved 2.7 points to 10.2%. The closing USD rate moved from 149.52 yen to 159.88 yen, while the average rate moved from 151.46 yen to 149.14 yen. From this period the company states that the focus of its analysis of changes in profit has been shifted from operating profit to recurring (ordinary) profit.
| Item (billions of yen) | FY2024 | FY2025 | YoY | FY2025 Plan | vs. Plan |
|---|---|---|---|---|---|
| Orders Received | 95.6 | 94.9 | ▲0.7 / ▲0.7% | 90.0 | +4.9 / +5.4% |
| Sales | 86.5 | 92.9 | +6.4 / +7.4% | 89.0 | +3.9 / +4.4% |
| Gross Profit (margin) | 23.5 (27.2%) | 24.3 (26.2%) | +0.8 (▲1.0) / +3.4% | 23.9 (26.9%) | +0.4 (▲0.7pt) / +1.7% |
| SG&A Expense | 18.1 | 19.3 | +1.2 / +6.6% | 18.1 | +1.2 / +6.6% |
| Operating Profit (margin) | 5.4 (6.2%) | 5.0 (5.4%) | ▲0.4 (▲0.8pt) / ▲7.4% | 5.8 (6.5%) | ▲0.8 (▲1.1pt) / ▲13.8% |
| Non-operating Profit or loss | ▲0.9 | 0.2 | +1.1 | – | – |
| Ordinary Profit | 4.5 | 5.2 | +0.7 / +15.6% | 5.1 | +0.1 / +2.0% |
| Extraordinary Profit or Loss | 1.4 | 2.8 | +1.4 / +100% | – | – |
| Net Profit | 4.1 | 6.0 | +1.9 / +46.3% | 5.6 | +0.4 / +7.1% |
| ROE | 7.5% | 10.2% | +2.7pt | – | – |
| Exchange Rate (1USD / Closing) | ¥149.52 | ¥159.88 | +¥10.36 | – | – |
| Exchange Rate (1USD / Average) | ¥151.46 | ¥149.14 | ▲¥2.32 | – | – |
Orders, Sales and Order Backlog by Segment and Market
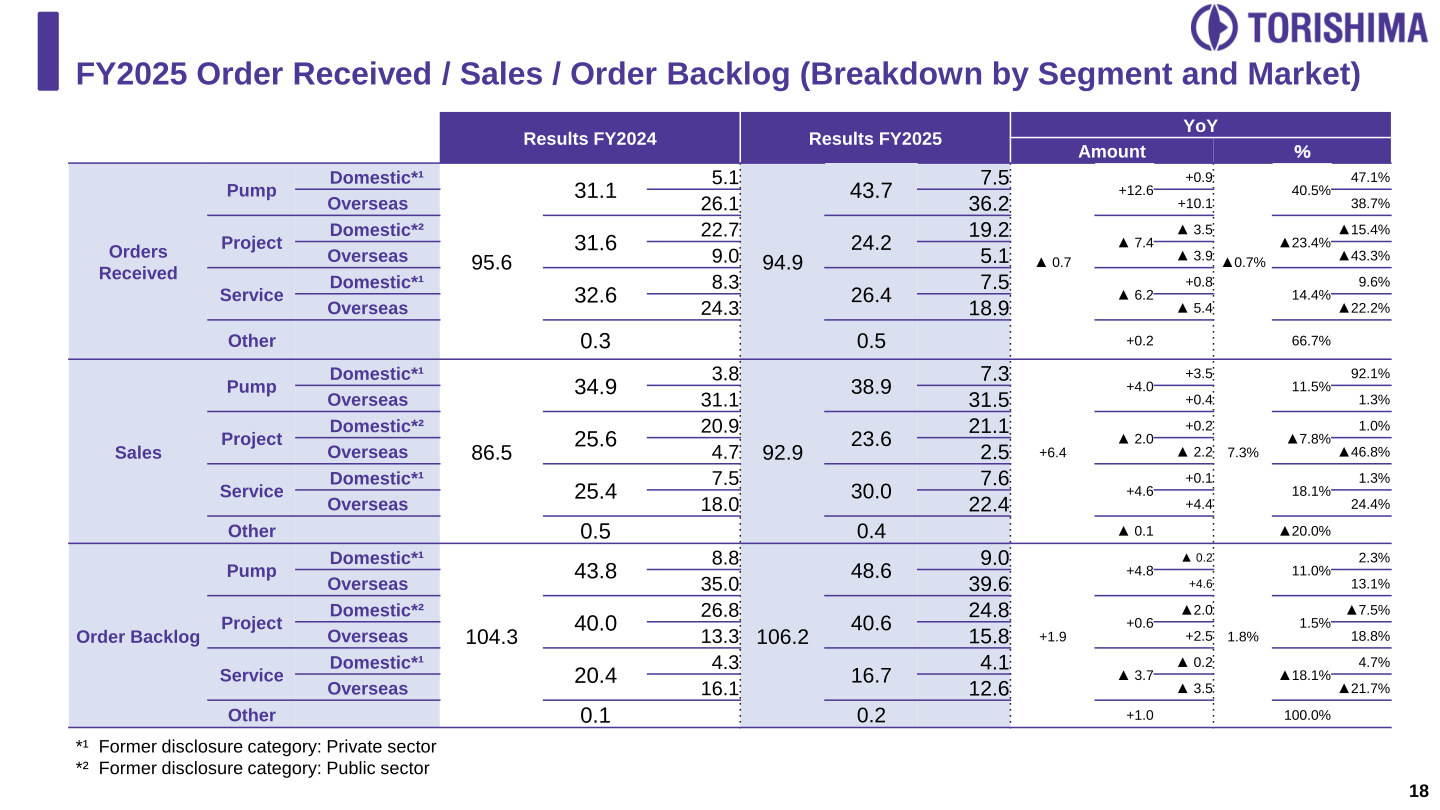
Torishima reports Orders Received, Sales and Order Backlog across the Pump, Project, Service and Other segments, each split into Domestic and Overseas (the former disclosure categories were “Private sector” for Pump and Service, and “Public sector” for Project). Pump orders rose 12.6 billion yen to 43.7 billion yen, with the overseas portion up 10.1 billion yen to 36.2 billion yen, while Project orders fell 7.4 billion yen to 24.2 billion yen and Service orders fell 6.2 billion yen to 26.4 billion yen. On the sales side, Pump sales rose 4.0 billion yen to 38.9 billion yen and Service sales rose 4.6 billion yen to 30.0 billion yen. The total order backlog of 106.2 billion yen exceeds 100 billion yen, which the company says secures growth from FY2027 and onward.
| Segment (billions of yen) | Orders FY2024 | Orders FY2025 | Sales FY2024 | Sales FY2025 | Backlog FY2024 | Backlog FY2025 |
|---|---|---|---|---|---|---|
| Pump | 31.1 | 43.7 | 34.9 | 38.9 | 43.8 | 48.6 |
| Domestic | 5.1 | 7.5 | 3.8 | 7.3 | 8.8 | 9.0 |
| Overseas | 26.1 | 36.2 | 31.1 | 31.5 | 35.0 | 39.6 |
| Project | 31.6 | 24.2 | 25.6 | 23.6 | 40.0 | 40.6 |
| Domestic | 22.7 | 19.2 | 20.9 | 21.1 | 26.8 | 24.8 |
| Overseas | 9.0 | 5.1 | 4.7 | 2.5 | 13.3 | 15.8 |
| Service | 32.6 | 26.4 | 25.4 | 30.0 | 20.4 | 16.7 |
| Domestic | 8.3 | 7.5 | 7.5 | 7.6 | 4.3 | 4.1 |
| Overseas | 24.3 | 18.9 | 18.0 | 22.4 | 16.1 | 12.6 |
| Other | 0.3 | 0.5 | 0.5 | 0.4 | 0.1 | 0.2 |
| Total | 95.6 | 94.9 | 86.5 | 92.9 | 104.3 | 106.2 |
Regional Breakdown and Overseas Order Mix
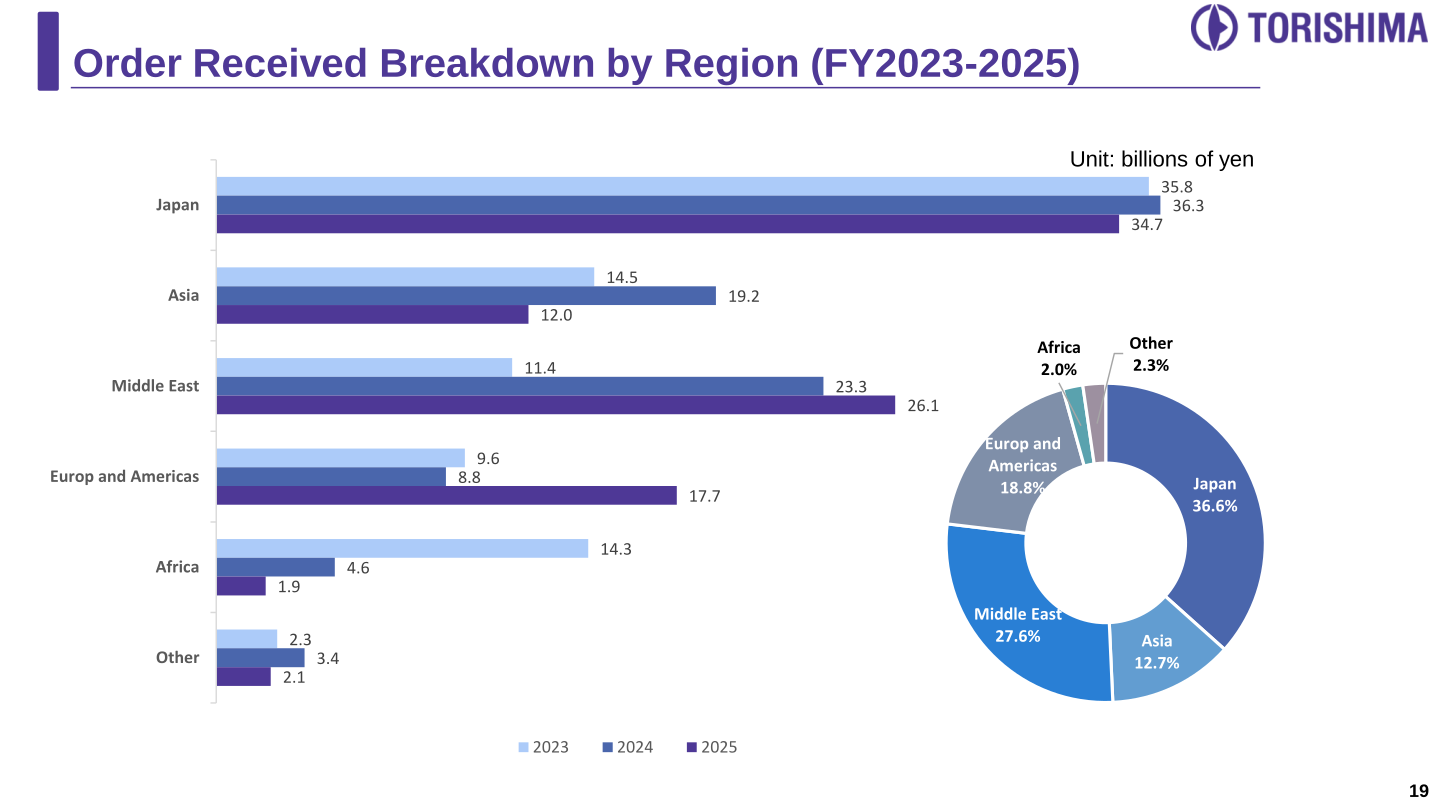
By region, FY2025 orders received were led by Japan at 34.7 billion yen (36.6% of the total), followed by the Middle East at 26.1 billion yen (27.6%) and Europe and the Americas at 17.7 billion yen (18.8%). Sales were led by Japan at 36.4 billion yen (39.2%) and the Middle East at 24.8 billion yen (26.7%). Within overseas markets, the delivery-sector mix of orders shifted decisively: Power generation rose to 47% in 2025 (+20 points), Water supply to 25% (+8 points), while Desalination fell to 19% (▲19 points). The company attributes the power-generation growth to “massive thermal power investments in the US, India, and China driven by the AI data center boom,” and states that it remains the “Global #1 Pump Manufacturer for Large RO Desalination Market.”
| Region (billions of yen) | Orders FY2024 | Orders FY2025 | Orders FY2025 share | Sales FY2024 | Sales FY2025 | Sales FY2025 share |
|---|---|---|---|---|---|---|
| Japan | 36.3 | 34.7 | 36.6% | 32.6 | 36.4 | 39.2% |
| Asia | 19.2 | 12.0 | 12.7% | 14.3 | 11.9 | 12.9% |
| Middle East | 23.3 | 26.1 | 27.6% | 15.8 | 24.8 | 26.7% |
| Europe and Americas | 8.8 | 17.7 | 18.8% | 6.7 | 8.5 | 9.1% |
| Africa | 4.6 | 1.9 | 2.0% | 14.8 | 7.3 | 8.0% |
| Other | 3.4 | 2.1 | 2.3% | 2.4 | 3.8 | 4.1% |
The company also addressed the impacts of the Middle East conflict, stating that the overall impact is limited at this stage, that Q1 performance is expected to remain in line with the FY26 plan, and that project and service execution for power and desalination plants in the region continues. It disclosed 288 staff in the region as of April 26, eight operating locations across the UAE, KSA and Qatar, and FY2026 planned revenue for the region of JPY 21.8bn.
FY2026 Forecast
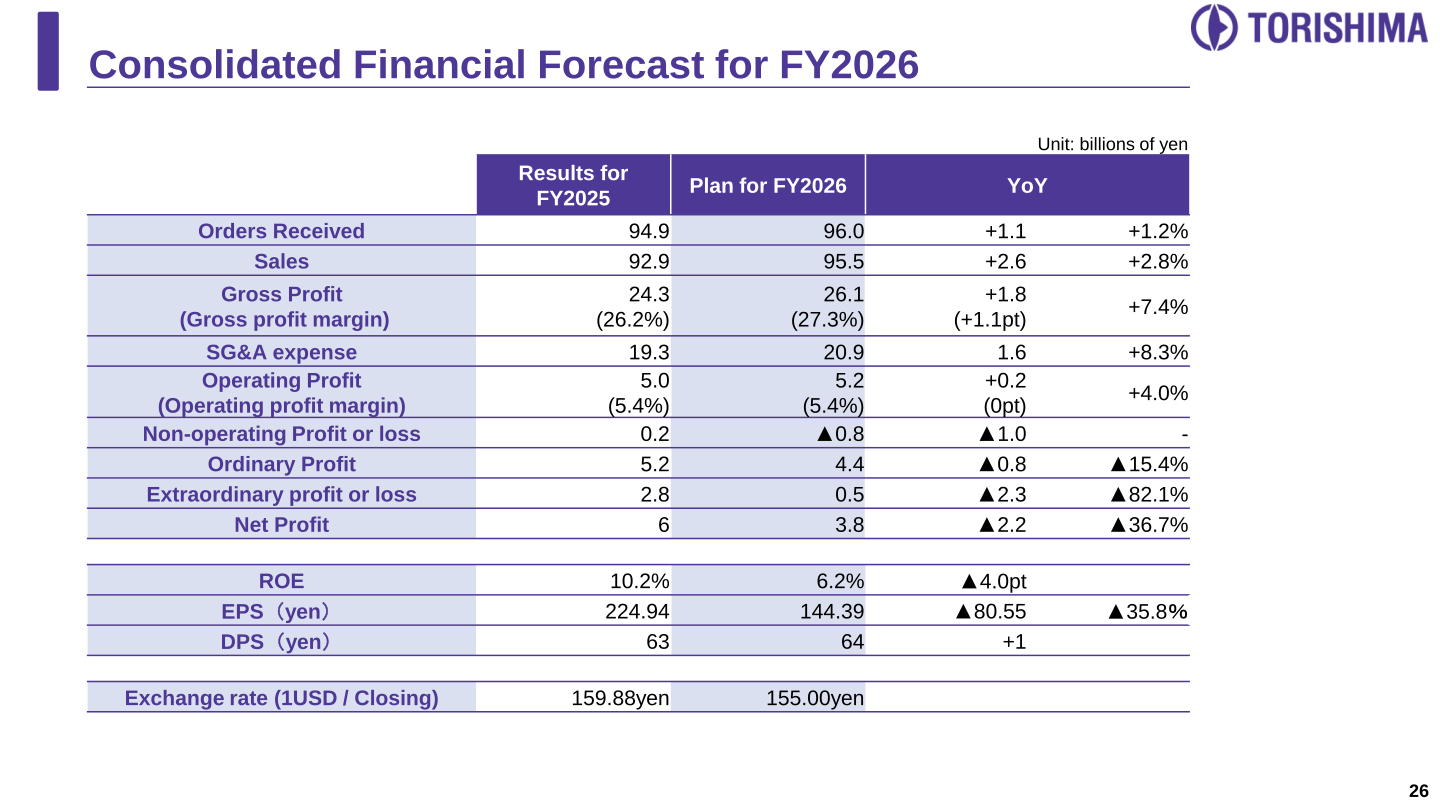
For FY2026 Torishima plans orders received of 96.0 billion yen (+1.2%) and sales of 95.5 billion yen (+2.8%), with operating profit rising 4.0% to 5.2 billion yen on a gross profit margin improving 1.1 points to 27.3%. Ordinary profit is planned to decline 15.4% to 4.4 billion yen and net profit to fall 36.7% to 3.8 billion yen, reflecting a swing in non-operating profit or loss to ▲0.8 billion yen and a smaller extraordinary item. The plan assumes a conservative closing rate of 155.00 yen per USD; the company notes that if the rate remains at ¥159.9/USD (the previous year-end level), the decline would be partially mitigated. The 90-96 billion yen order range is set to account for Middle East risks on order placement timing.
| Item (billions of yen) | FY2025 Results | FY2026 Plan | YoY |
|---|---|---|---|
| Orders Received | 94.9 | 96.0 | +1.1 / +1.2% |
| Sales | 92.9 | 95.5 | +2.6 / +2.8% |
| Gross Profit (margin) | 24.3 (26.2%) | 26.1 (27.3%) | +1.8 (+1.1pt) / +7.4% |
| SG&A expense | 19.3 | 20.9 | 1.6 / +8.3% |
| Operating Profit (margin) | 5.0 (5.4%) | 5.2 (5.4%) | +0.2 (0pt) / +4.0% |
| Non-operating Profit or loss | 0.2 | ▲0.8 | ▲1.0 |
| Ordinary Profit | 5.2 | 4.4 | ▲0.8 / ▲15.4% |
| Extraordinary profit or loss | 2.8 | 0.5 | ▲2.3 / ▲82.1% |
| Net Profit | 6.0 | 3.8 | ▲2.2 / ▲36.7% |
| ROE | 10.2% | 6.2% | ▲4.0pt |
| EPS (yen) | 224.94 | 144.39 | ▲80.55 / ▲35.8% |
| DPS (yen) | 63 | 64 | +1 |
| Exchange rate (1USD / Closing) | 159.88yen | 155.00yen | – |
Shareholder Returns
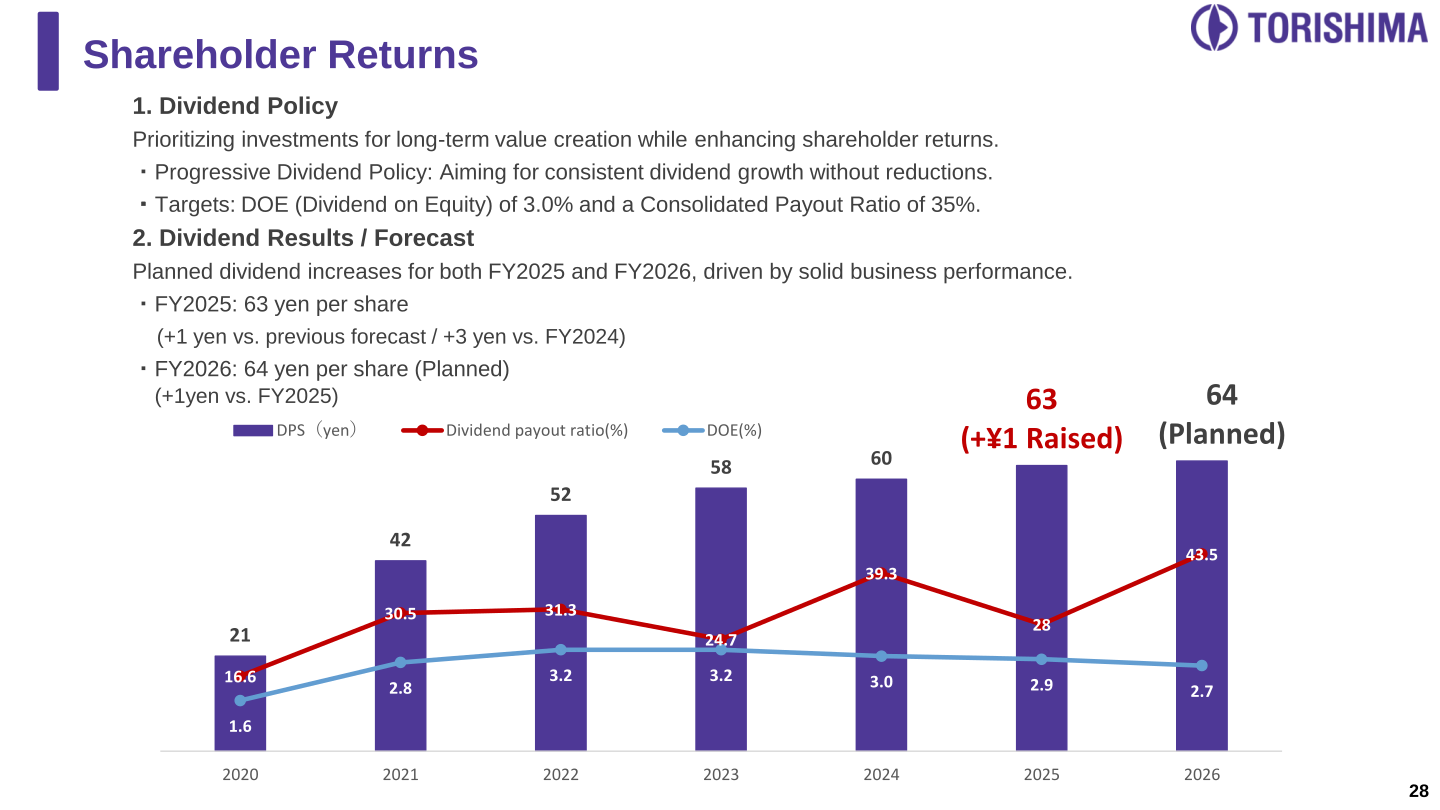
Torishima’s dividend policy prioritizes investments for long-term value creation while enhancing shareholder returns. It states a progressive dividend policy “aiming for consistent dividend growth without reductions,” with targets of a DOE (Dividend on Equity) of 3.0% and a consolidated payout ratio of 35%. The FY2025 dividend was raised to 63 yen per share, 1 yen above the previous forecast and 3 yen above FY2024, and the FY2026 dividend is planned at 64 yen per share. The company also notes that its TSR, indexed from the end of FY2020, has consistently outperformed both TOPIX and the TSE machinery sector average.
| Item | FY2024 | FY2025 | FY2026 (Planned) |
|---|---|---|---|
| DPS (yen) | 60 | 63 | 64 |
| Dividend payout ratio (%) | 39.3 | 28 | 43.5 |
| DOE (%) | 3.0 | 2.9 | 2.7 |
Medium-Term Plan and Topics
Under the medium-term management plan “Beyond 110” (formulated in May 2021), Phase 1 covered FY2021-2024 and Phase 2 covers FY2025-2029. Against the FY2025 result of 92.9 billion yen in sales, 5.0 billion yen in operating profit (5.4% margin) and 10.2% ROE, the FY2029 targets are 100 billion-yen in sales, 10 billion-yen in operating profit (10%) and 10% ROE. The company notes that these FY2029 targets are based on organic growth and that, following completion of the acquisition of Shin Nippon Machinery Co., Ltd., it will promptly announce a revised plan incorporating growth from this M&A. A separate service-expansion target calls for service revenue of 35.0 billion yen by FY2029, versus 30.0 billion yen in FY2025.
Torishima agreed on February 10, 2026 to acquire 100% of Shin Nippon Machinery Co., Ltd. (“SNM”) from Sumitomo Heavy Industries, with the share transfer scheduled for July 1, 2026. SNM is engaged in the manufacture and sale of steam turbines and process pumps, has capital of 2,408 million yen, was established on November 1, 1973, and recorded consolidated net sales of 19,167 million yen (Dec 2025). Other topics highlighted in the materials include the world-first order for a large-flow liquefied hydrogen pump from Kawasaki Heavy Industries in January 2026, developed with Kyoto University, and the Grand Prize for the Immersible Motor Pump at the 12th Japan Resilience Awards 2026.
This article is an analysis based on publicly available information and is not a recommendation to buy or sell any specific securities. Investment decisions are your own responsibility.
![[Obayashi] Investors’ Guide 2026 — The Complete 24-Article Breakdown](https://japan-equity.com/wp-content/uploads/2026/07/hub_cover-1024x1024.png)
![[Obayashi] IR & SR Policy — Feeding Dialogue Back into Management](https://japan-equity.com/wp-content/uploads/2026/07/p32_sq-1024x1024.jpg)
![[Obayashi] Real Estate Development — 18.7% Margin, ¥287.7bn Unrealized Gains](https://japan-equity.com/wp-content/uploads/2026/07/p20_sq-1024x1024.jpg)
![[Obayashi] Domestic Civil Engineering — Resilience Spending Supports 9.6% Margin](https://japan-equity.com/wp-content/uploads/2026/07/p11_sq-1024x1024.jpg)
![[Obayashi] Share Price & External Ratings — vs TOPIX, ESG Index Inclusion](https://japan-equity.com/wp-content/uploads/2026/07/p40_sq-1024x1024.jpg)
![[Construction] ¥75.5tn Investment, Shrinking Workforce — Big-5 Market Share](https://japan-equity.com/wp-content/uploads/2026/07/p12_sq-1024x1024.jpg)



![[Obayashi] Capital Policy & Shareholder Returns — ROE 10%+, DOE ~5%, ¥100bn Buyback](https://japan-equity.com/wp-content/uploads/2026/07/p27_sq-1024x1024.jpg)
![[Obayashi] Reducing Cross-Shareholdings — ¥285.2bn Sold in Five Years](https://japan-equity.com/wp-content/uploads/2026/07/p29_sq-1024x1024.jpg)
![[Obayashi] ¥750bn Investment Plan — ¥300bn to Development, ¥190bn to Tech/DX](https://japan-equity.com/wp-content/uploads/2026/07/p30_sq-1024x1024.jpg)
![[Obayashi] MTP2022 KPIs — Operating Profit ~2x Target, ROE 14.4%](https://japan-equity.com/wp-content/uploads/2026/07/p25_sq-1024x1024.jpg)
![[Obayashi] Cash Allocation — ¥420bn Investment CF Over Five Years](https://japan-equity.com/wp-content/uploads/2026/07/p26_sq-1024x1024.jpg)
![[Obayashi] Green Energy — 44 Plants, 344MW, and the Green Hydrogen Challenge](https://japan-equity.com/wp-content/uploads/2026/07/p21_sq-1024x1024.jpg)
![[Obayashi] Tackling the Labor Shortage — Robotics Construction®](https://japan-equity.com/wp-content/uploads/2026/07/p14_sq-1024x1024.jpg)
