
This article is based on publicly available IR materials and is not a recommendation to buy or sell any specific securities.
Note: Tsurumi Manufacturing’s most recently completed fiscal year ended March 31, 2026, and the company’s materials label it “FY3/26”. The labels used in the text, tables and figures below follow the presentation. Tsurumi Manufacturing Co., Ltd. (TSE: 6351), a submersible pump specialist, reported FY3/26 net sales of 77,227 million yen and operating profit of 10,715 million yen. The presentation states that the company “Achieved record highs for both sales and operating profit”. Ordinary profit rose to 13,603 million yen, while profit attributable to owners of parent fell to 5,160 million yen after extraordinary losses of 4,623 million yen, which include impairment losses recorded at ZENIT INTERNATIONAL S.P.A.
Consolidated Results (Full-Year Actual)
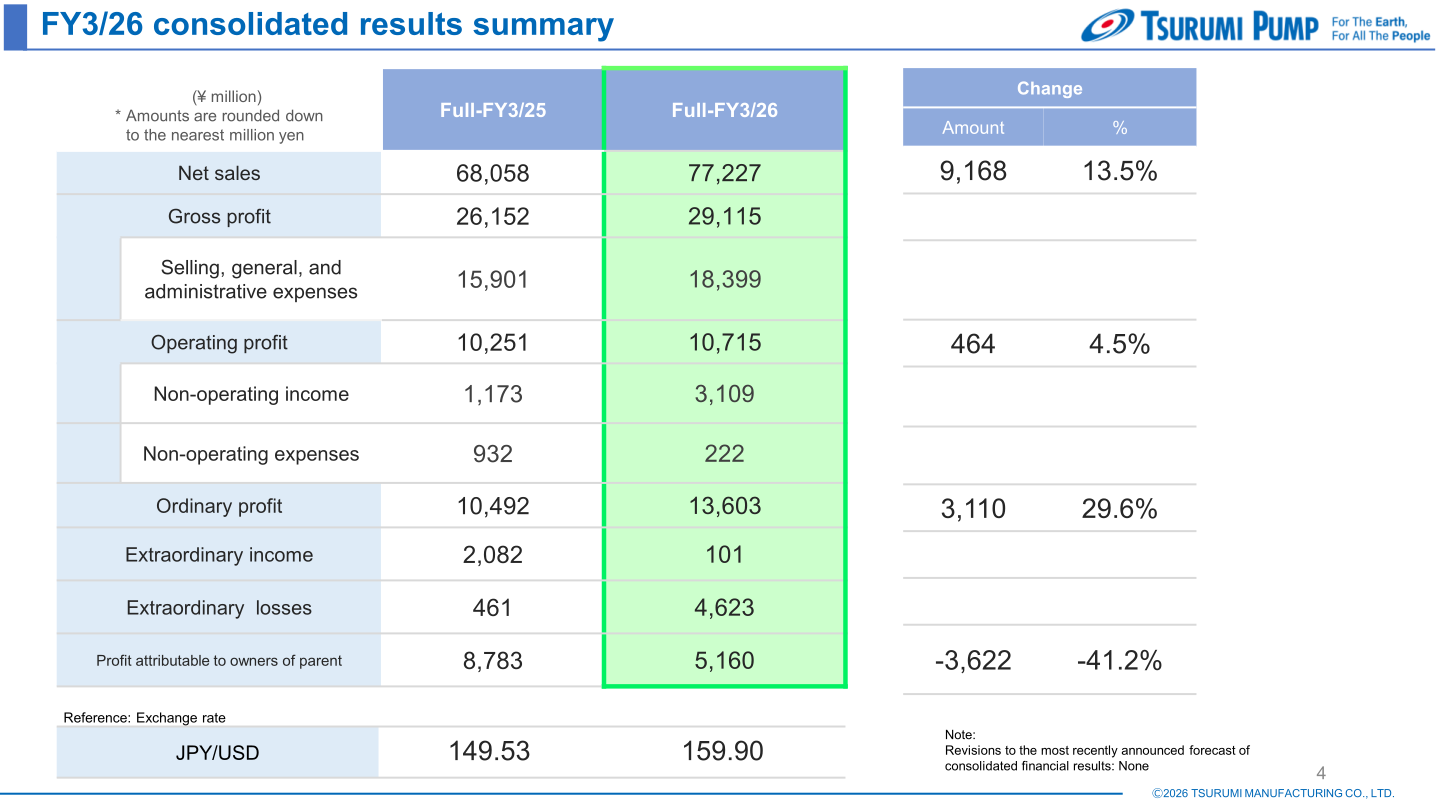
Net sales increased 9,168 million yen, or 13.5%, to 77,227 million yen. Operating profit rose 464 million yen, or 4.5%, to 10,715 million yen, and ordinary profit rose 3,110 million yen, or 29.6%, to 13,603 million yen, helped by an increase in non-operating income to 3,109 million yen and a decrease in non-operating expenses to 222 million yen. Profit attributable to owners of parent decreased 3,622 million yen, or 41.2%, to 5,160 million yen. The reference exchange rate was 159.90 yen per US dollar for FY3/26 versus 149.53 yen for FY3/25. The presentation notes: “Revisions to the most recently announced forecast of consolidated financial results: None”.
| Item (¥ million) | Full-FY3/25 | Full-FY3/26 | Change (Amount) | Change (%) |
|---|---|---|---|---|
| Net sales | 68,058 | 77,227 | 9,168 | 13.5% |
| Gross profit | 26,152 | 29,115 | – | – |
| Selling, general, and administrative expenses | 15,901 | 18,399 | – | – |
| Operating profit | 10,251 | 10,715 | 464 | 4.5% |
| Non-operating income | 1,173 | 3,109 | – | – |
| Non-operating expenses | 932 | 222 | – | – |
| Ordinary profit | 10,492 | 13,603 | 3,110 | 29.6% |
| Extraordinary income | 2,082 | 101 | – | – |
| Extraordinary losses | 461 | 4,623 | – | – |
| Profit attributable to owners of parent | 8,783 | 5,160 | -3,622 | -41.2% |
| Reference: Exchange rate (JPY/USD) | 149.53 | 159.90 | – | – |
The presentation devotes a dedicated slide to the extraordinary losses related to ZENIT INTERNATIONAL S.P.A. It cites a worsening external environment, including the prolonged Ukraine war and a slowdown in the Chinese market, together with a changed outlook for future profitability following a business plan revision and additional capital investment. Goodwill of 3,117 million yen and customer-related intangible assets of 899 million yen, totalling 4,017 million yen, were recorded in FY3/26. As countermeasures, the company cites a change in CEO and, under the new structure, a review of the business plan and structural reforms to restore profitability, plus market expansion through technology and product synergies, including the expansion of CTG pumps that use the company’s unique smashing mechanism into Europe and elsewhere.
On the balance sheet as of March 31, 2026, total assets were 138,273 million yen (a change of +6,764 million yen from the end of FY3/25), liabilities were 34,698 million yen (-959 million yen) and net assets were 103,575 million yen (+7,723 million yen). The equity-to-asset ratio was 73.8%.
Segment Results
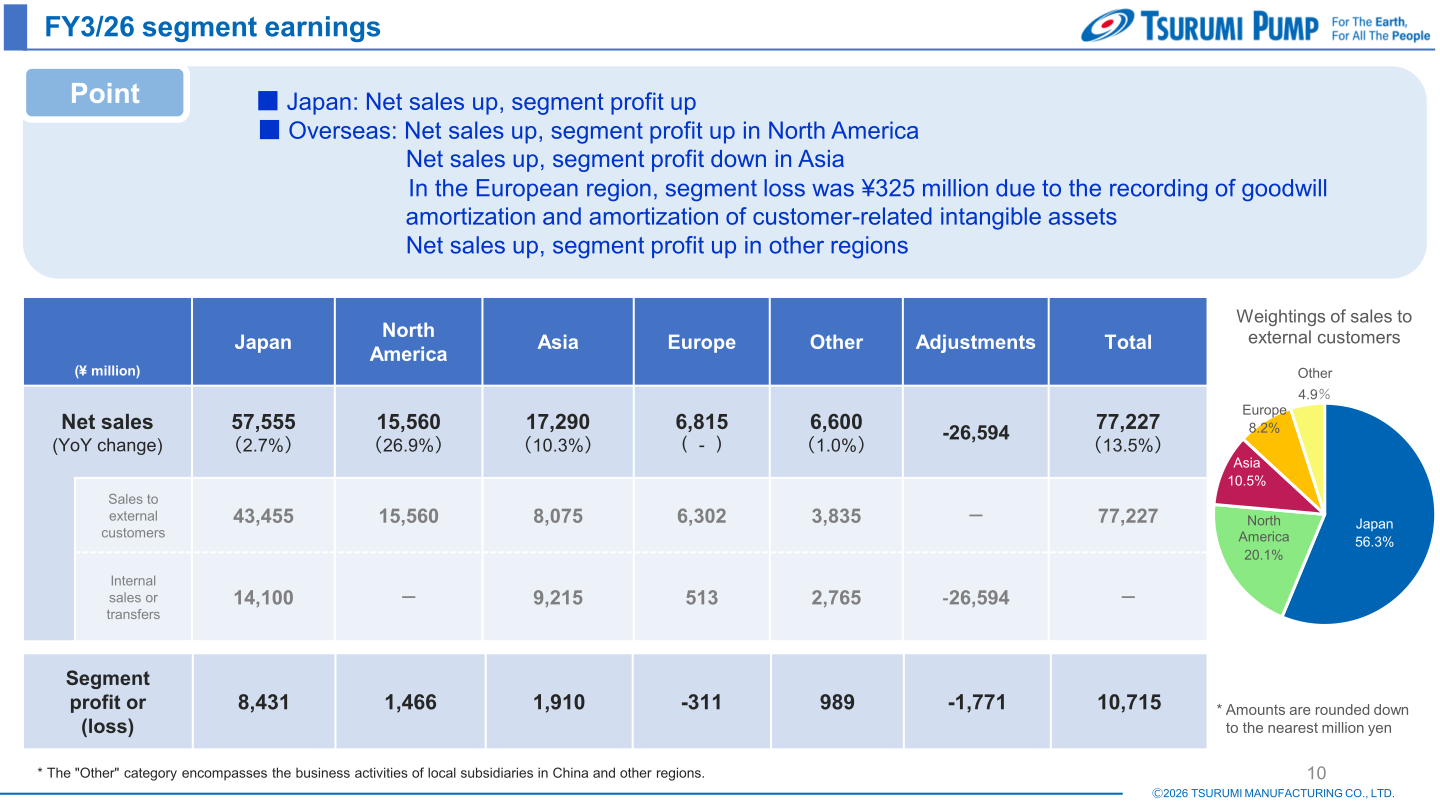
The presentation summarises the segment picture as follows: “Japan: Net sales up, segment profit up” and “Overseas: Net sales up, segment profit up in North America / Net sales up, segment profit down in Asia / Net sales up, segment profit up in other regions.” The European region posted a segment loss, which the presentation attributes to the recording of goodwill amortization and amortization of customer-related intangible assets. By weighting of sales to external customers, Japan accounted for 56.3%, North America 20.1%, Asia 10.5%, Europe 8.2% and Other 4.9%. The Europe segment was added to the scope of consolidation from FY3/25 3Q, when ZENIT INTERNATIONAL S.P.A. and its four subsidiaries were consolidated.
| Segment | Net sales (¥ million) | YoY change | Sales to external customers | Internal sales or transfers | Segment profit or (loss) |
|---|---|---|---|---|---|
| Japan | 57,555 | 2.7% | 43,455 | 14,100 | 8,431 |
| North America | 15,560 | 26.9% | 15,560 | — | 1,466 |
| Asia | 17,290 | 10.3% | 8,075 | 9,215 | 1,910 |
| Europe | 6,815 | ( – ) | 6,302 | 513 | -311 |
| Other | 6,600 | 1.0% | 3,835 | 2,765 | 989 |
| Adjustments | -26,594 | — | — | -26,594 | -1,771 |
| Total | 77,227 | 13.5% | 77,227 | — | 10,715 |
The presentation also splits net sales two ways — by customer region and by business division. On a customer-region basis, overseas sales reached 38,651 million yen (50.0%) in FY3/26 against domestic sales of 38,576 million yen (50.0%), compared with 30,172 million yen (44.4%) and 37,886 million yen (55.6%) respectively in FY3/25. On a business-division basis, overseas was 33,772 million yen (43.7%) and Japan 43,455 million yen (56.3%) in FY3/26.
| Category | Full-FY3/25 (customer region) | Full-FY3/25 (business division) | Full-FY3/26 (customer region) | Full-FY3/26 (business division) |
|---|---|---|---|---|
| Overseas | 30,172 (44.4%) | 25,140 (37.0%) | 38,651 (50.0%) | 33,772 (43.7%) |
| Japan | 37,886 (55.6%) | 42,918 (63.0%) | 38,576 (50.0%) | 43,455 (56.3%) |
| Total Sales | 68,058 | 68,058 | 77,227 | 77,227 |
FY3/27 Forecast
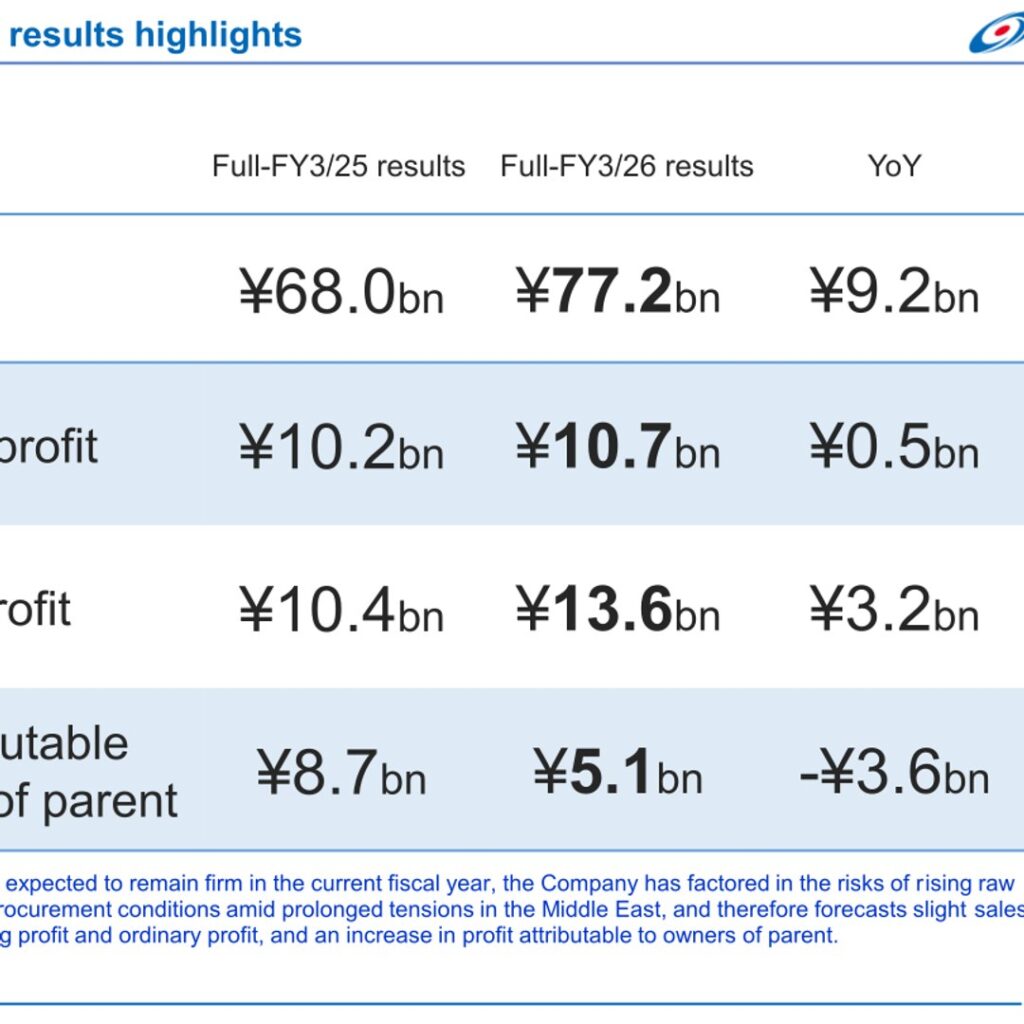
For FY3/27 the company forecasts net sales of ¥77.8bn, operating profit of ¥7.3bn, ordinary profit of ¥8.2bn and profit attributable to owners of parent of ¥5.6bn. The presentation explains: “While existing businesses are expected to remain firm in the current fiscal year, the Company has factored in the risks of rising raw material costs and unstable procurement conditions amid prolonged tensions in the Middle East, and therefore forecasts slight sales growth, decreases in operating profit and ordinary profit, and an increase in profit attributable to owners of parent.” Amounts on this slide are rounded down to the nearest ¥100 million. A segment-level forecast is not disclosed in these materials.
| Item | Full-FY3/25 results | Full-FY3/26 results | YoY | FY3/27 forecasts |
|---|---|---|---|---|
| Net sales | ¥68.0bn | ¥77.2bn | ¥9.2bn | ¥77.8bn |
| Operating profit | ¥10.2bn | ¥10.7bn | ¥0.5bn | ¥7.3bn |
| Ordinary profit | ¥10.4bn | ¥13.6bn | ¥3.2bn | ¥8.2bn |
| Profit attributable to owners of parent | ¥8.7bn | ¥5.1bn | -¥3.6bn | ¥5.6bn |
Shareholder Returns
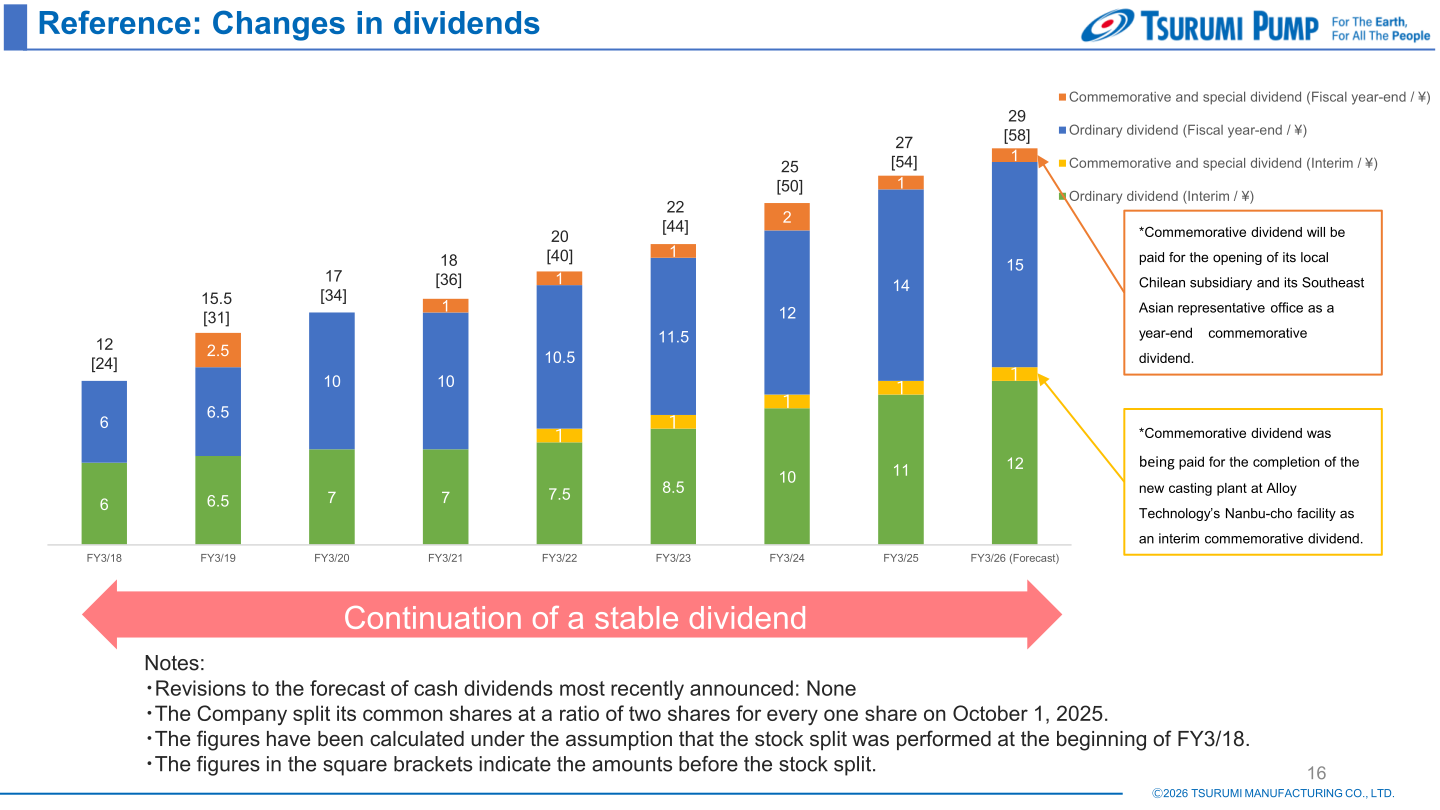
The company split its common shares two-for-one on October 1, 2025. On the dividend slide, figures are calculated on the assumption that the stock split was performed at the beginning of FY3/18, and the figures in square brackets indicate the amounts before the stock split. The annual dividend for FY3/26 (Forecast) is ¥29 [¥58], up from ¥27 [¥54] in FY3/25, under the theme “Continuation of a stable dividend”. The presentation states that the company “Paid 2 yen in the interim dividend to commemorate the completion of the new casting plant at Alloy Technology’s Nanbu-cho facility at the end of 2Q and 1 yen in the year-end dividend to commemorate the establishment of a local subsidiary in the Republic of Chile and the Southeast Asia Representative Office at the end of the period to increase the annual dividend by 3 yen as commemorative dividends (increase of 4 yen without taking the stock split into account)”. It also notes: “Revisions to the forecast of cash dividends most recently announced: None”. A dividend forecast for FY3/27 cannot be confirmed from the materials.
| Fiscal Year | Interim: ordinary / commemorative & special (¥) | Fiscal year-end: ordinary / commemorative & special (¥) | Annual total (¥) | Before stock split (¥) |
|---|---|---|---|---|
| FY3/24 | 10 / 1 | 12 / 2 | 25 | 50 |
| FY3/25 | 11 / 1 | 14 / 1 | 27 | 54 |
| FY3/26 (Forecast) | 12 / 1 | 15 / 1 | 29 | 58 |
Under the capital allocation policy, the company aims to “Secure sources of funds for proactive growth investments looking ahead to the medium- to long-term and BCP investments to connect to the next 100 years while providing shareholder returns based on flexible acquisition of treasury stock and reliable progressive dividend measures to improve capital profitability.” The stated shareholder return measures are the flexible acquisition of treasury stock while monitoring stock market trends and taking into account liquidity, and the continuation of progressive dividend measures with a target dividend payout ratio of 30%.
Medium-Term Plan and Capital Profitability
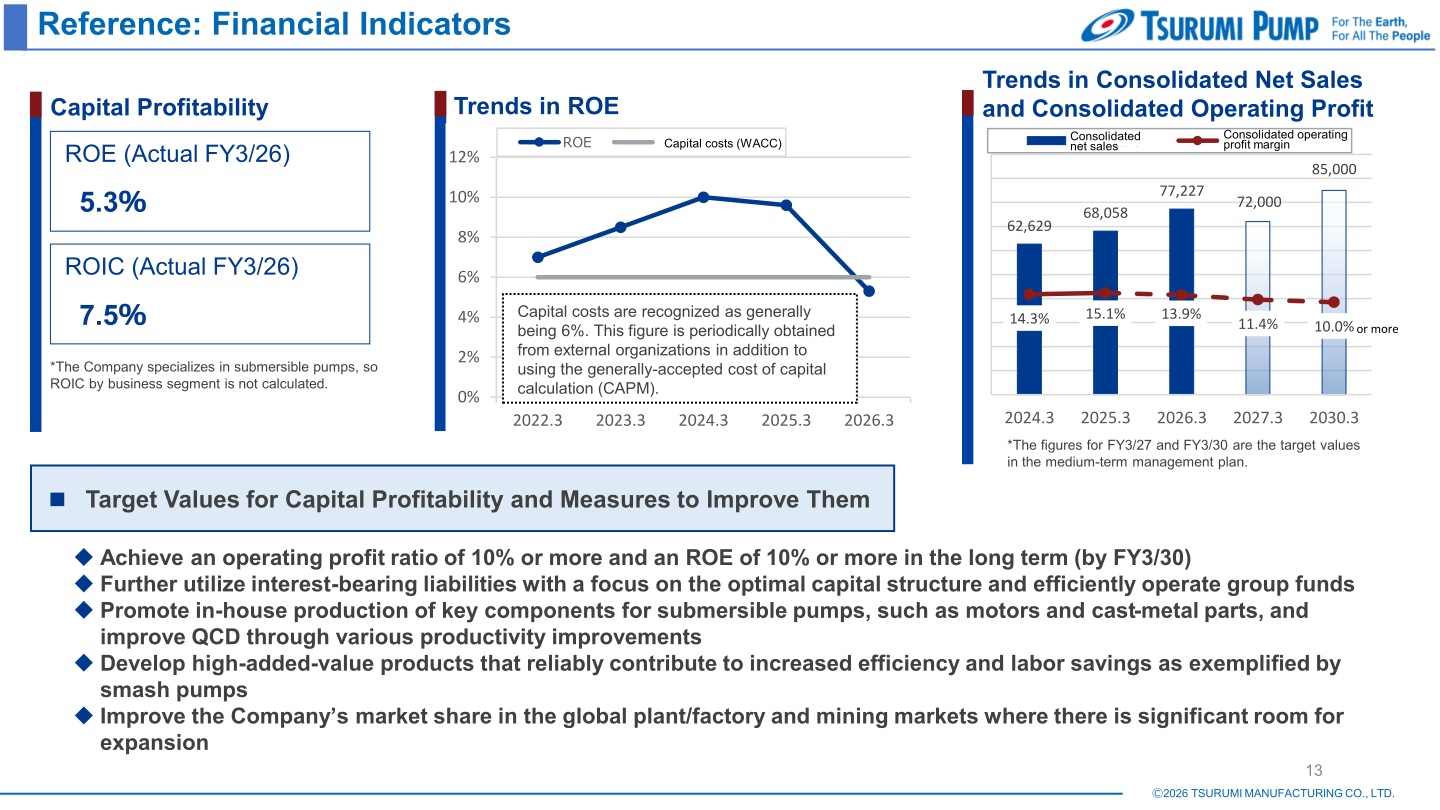
ROE for FY3/26 was 5.3% and ROIC 7.5%; the company notes that because it specializes in submersible pumps, ROIC by business segment is not calculated. Capital costs (WACC) are recognized as generally being 6%. The long-term target is to “Achieve an operating profit ratio of 10% or more and an ROE of 10% or more in the long term (by FY3/30)”, supported by further utilization of interest-bearing liabilities with a focus on the optimal capital structure, in-house production of key components such as motors and cast-metal parts, development of high-added-value products such as smash pumps, and improvement of market share in the global plant/factory and mining markets. In the medium-term management plan, consolidated net sales targets are 72,000 million yen for FY3/27 and 85,000 million yen for FY3/30, with consolidated operating profit margins of 11.4% and 10.0% or more respectively.
Growth investments and BCP investments over the next five years are expected to total about ¥18.5 bn, broken down as ¥8.0 bn for in-house production of key components using new manufacturing methods and BCP investments including preparations for large-scale disasters such as a Nankai Trough earthquake, ¥2.5 bn for technological research and product development addressing climate change countermeasures and labor-saving measures, ¥1.0 bn for solar power generation and renewable energies as part of ESG management, ¥5.0 bn for capturing the global plant/factory and mining markets and expanding market share through M&As and business partnerships, and ¥2.0 bn for rebuilding the group’s core systems. During FY3/26 the company established TSURUMI PUMP LATIN AMERICA and a Southeast Asia Representative Office under the “Deepening: Expanding Existing Businesses” theme of the Transformation 2027 medium-term management plan.
This article is an analysis based on publicly available information and is not a recommendation to buy or sell any specific securities. Investment decisions are your own responsibility.
![[Obayashi] Investors’ Guide 2026 — The Complete 24-Article Breakdown](https://japan-equity.com/wp-content/uploads/2026/07/hub_cover-1024x1024.png)
![[Obayashi] IR & SR Policy — Feeding Dialogue Back into Management](https://japan-equity.com/wp-content/uploads/2026/07/p32_sq-1024x1024.jpg)
![[Obayashi] Real Estate Development — 18.7% Margin, ¥287.7bn Unrealized Gains](https://japan-equity.com/wp-content/uploads/2026/07/p20_sq-1024x1024.jpg)
![[Obayashi] Domestic Civil Engineering — Resilience Spending Supports 9.6% Margin](https://japan-equity.com/wp-content/uploads/2026/07/p11_sq-1024x1024.jpg)
![[Obayashi] Share Price & External Ratings — vs TOPIX, ESG Index Inclusion](https://japan-equity.com/wp-content/uploads/2026/07/p40_sq-1024x1024.jpg)
![[Construction] ¥75.5tn Investment, Shrinking Workforce — Big-5 Market Share](https://japan-equity.com/wp-content/uploads/2026/07/p12_sq-1024x1024.jpg)



![[Obayashi] Capital Policy & Shareholder Returns — ROE 10%+, DOE ~5%, ¥100bn Buyback](https://japan-equity.com/wp-content/uploads/2026/07/p27_sq-1024x1024.jpg)
![[Obayashi] Reducing Cross-Shareholdings — ¥285.2bn Sold in Five Years](https://japan-equity.com/wp-content/uploads/2026/07/p29_sq-1024x1024.jpg)
![[Obayashi] ¥750bn Investment Plan — ¥300bn to Development, ¥190bn to Tech/DX](https://japan-equity.com/wp-content/uploads/2026/07/p30_sq-1024x1024.jpg)
![[Obayashi] MTP2022 KPIs — Operating Profit ~2x Target, ROE 14.4%](https://japan-equity.com/wp-content/uploads/2026/07/p25_sq-1024x1024.jpg)
![[Obayashi] Cash Allocation — ¥420bn Investment CF Over Five Years](https://japan-equity.com/wp-content/uploads/2026/07/p26_sq-1024x1024.jpg)
![[Obayashi] Green Energy — 44 Plants, 344MW, and the Green Hydrogen Challenge](https://japan-equity.com/wp-content/uploads/2026/07/p21_sq-1024x1024.jpg)
![[Obayashi] Tackling the Labor Shortage — Robotics Construction®](https://japan-equity.com/wp-content/uploads/2026/07/p14_sq-1024x1024.jpg)
