
This article is based on publicly available IR materials and is not a recommendation to buy or sell any specific securities.
Note: the presentation labels the fiscal year ended March 31, 2026 as “FY 2026/3” (and as “FY 2025” in its medium-term plan charts); this article follows this site’s convention of calling the most recent completed fiscal year FY2025, while all labels in the text, tables and segment data are kept exactly as they appear in the materials.
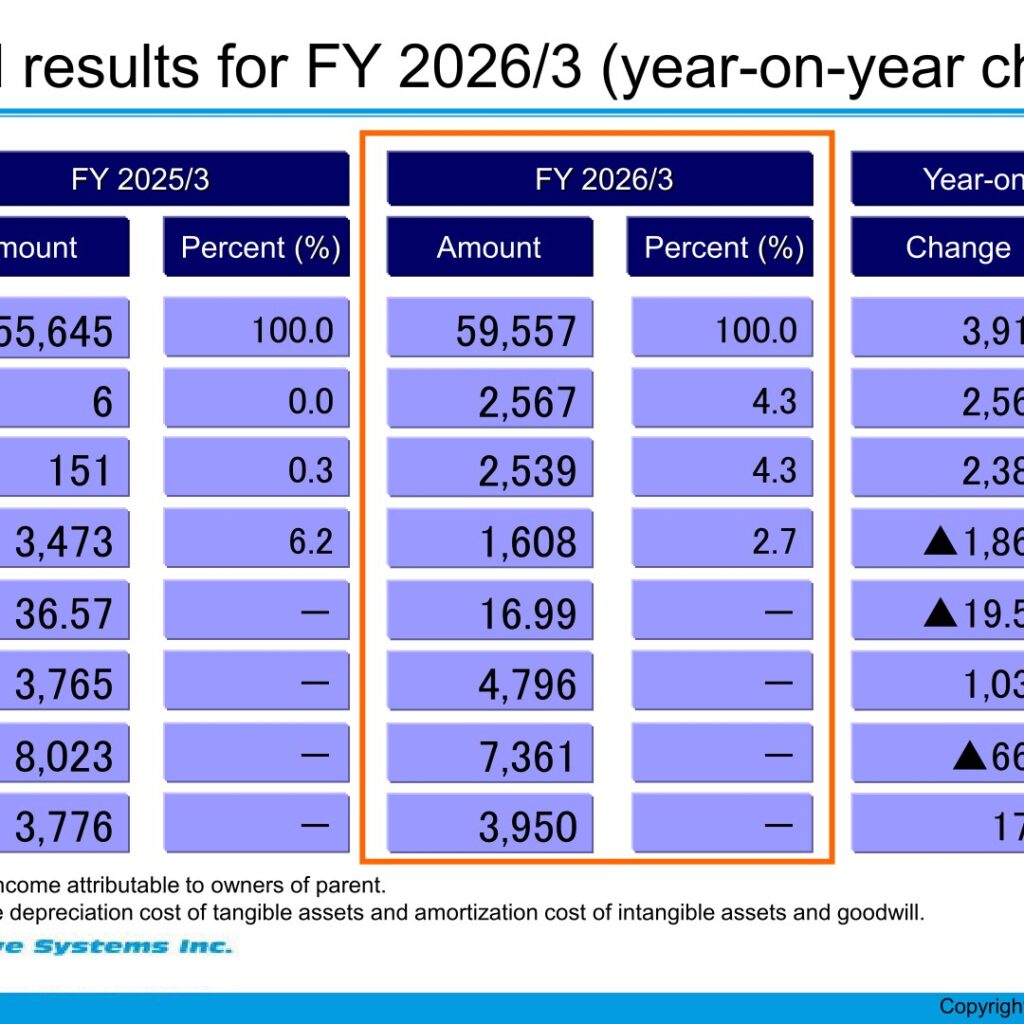
Harmonic Drive Systems reported consolidated net sales of ¥59,557 million for FY 2026/3, up 7.0% year on year, with operating income of ¥2,567 million against ¥6 million in FY 2025/3. Ordinary income was ¥2,539 million and net income attributable to owners of parent was ¥1,608 million, down 53.7% year on year. All four headline items came in slightly above the forecast announced on April 24, 2026. Alongside the results, the company disclosed a new Medium-Term Management Plan covering FY 2026 to FY 2030 and guided for a sharp profit recovery in FY 2027/3.
Consolidated Results (Full-Year Actual)
Net sales rose ¥3,911 million (7.0%) year on year and operating income improved by ¥2,560 million. Net income fell ¥1,864 million (53.7%), and EPS declined from ¥36.57 to ¥16.99. Capital investment increased 27.4% to ¥4,796 million while depreciation costs fell 8.3% to ¥7,361 million and R&D costs rose 4.6% to ¥3,950 million. Net income refers to net income attributable to owners of parent, and depreciation costs include depreciation of tangible assets and amortization of intangible assets and goodwill.
| Item (millions of yen) | FY 2025/3 | FY 2026/3 | Change | Rate (%) |
|---|---|---|---|---|
| Net sales | 55,645 | 59,557 | 3,911 | 7.0 |
| Operating income | 6 | 2,567 | 2,560 | — |
| Ordinary income | 151 | 2,539 | 2,388 | — |
| Net income | 3,473 | 1,608 | ▲1,864 | ▲53.7 |
| EPS (yen) | 36.57 | 16.99 | ▲19.58 | — |
| Capital investment | 3,765 | 4,796 | 1,030 | 27.4 |
| Depreciation costs | 8,023 | 7,361 | ▲661 | ▲8.3 |
| R&D costs | 3,776 | 3,950 | 173 | 4.6 |
Against the forecast announced on April 24, 2026 (net sales ¥59,500 million, operating income ¥2,500 million, ordinary income ¥2,500 million, net income ¥1,580 million, EPS ¥16.69), actual net sales exceeded the plan by ¥57 million (0.1%), operating income by ¥67 million (2.7%), ordinary income by ¥39 million (1.6%) and net income by ¥28 million (1.8%).
The company attributes the year-on-year change in consolidated operating income, from ¥6 million to ¥2,567 million, to higher income of +¥2,575 million, a higher marginal profit ratio and other factors of +¥61 million, and lower fixed manufacturing costs and other factors of +¥652 million, offset by higher SG&A costs of ▲¥705 million and an impact of exchange rates of ▲¥22 million.
On a non-consolidated basis, net sales were ¥33,438 million (up 9.5%), operating income was ¥983 million against ▲¥187 million a year earlier, ordinary income was ¥1,065 million (up 469.9%) and net income was ¥719 million (down 82.8%), with EPS of ¥7.60.
Total assets stood at ¥111,400 million at the end of FY 2026/3 versus ¥113,621 million a year earlier, while owned capital rose to ¥80,390 million from ¥78,943 million and the equity ratio improved to 72.2% from 69.5%. Cash flow from operating activities was ¥6,425 million, cash flow from investing activities was ▲¥4,941 million, free cash flow was ¥1,483 million, cash flow from financing activities was ▲¥5,874 million, and cash and cash equivalents at the end of the year were ¥19,091 million.
Group Company Results
The presentation discloses net sales and operating income for the main group companies. For overseas subsidiaries the fiscal year ends December 31. Applicable exchange rates were 1USD = 151.58 yen for FY 24/12 and 149.71 yen for FY 25/12; 1CNY = 21.02 yen and 20.82 yen; 1EUR = 163.95 yen and 169.00 yen respectively.
| Company (millions of yen) | Equity stake | Net sales | YoY change (%) | Operating income | YoY change (%) |
|---|---|---|---|---|---|
| HD Systems, Inc. (Harmonic Drive L.L.C.) (U.S.A) | 100% (100%) | 12,141 | 4.3 | 553 | ▲3.1 |
| Harmonic AD, Inc | 100% | 2,264 | 9.9 | 14 | — |
| Harmonic Precision Inc | 100% | 3,333 | 7.2 | 332 | — |
| Harmonic Drive Systems (Shanghai) Co., Ltd. | 100% | 4,056 | ▲27.9 | 473 | ▲7.0 |
| Harmonic Drive SE (Germany) | 100% | 16,881 | 0.5 | 1,475 | 151.2 |
Consolidated Bookings by Region
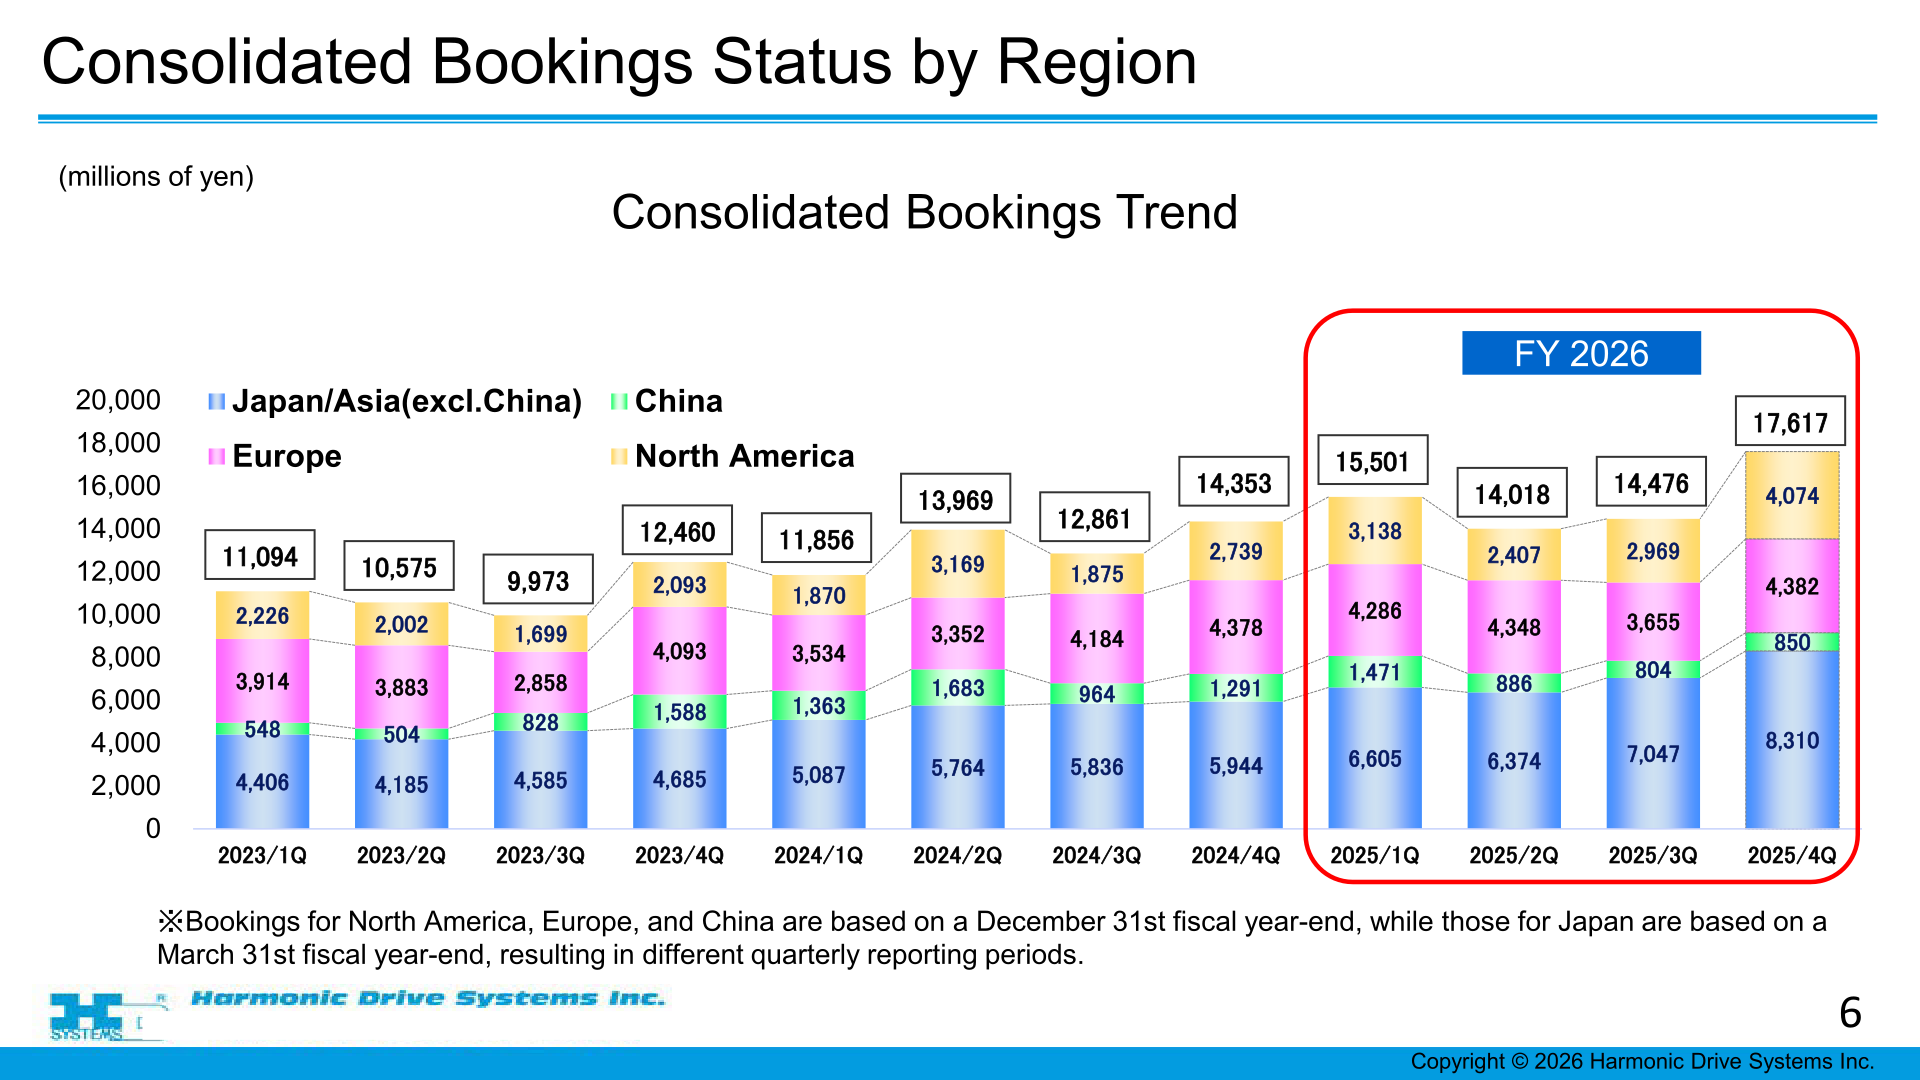
Consolidated bookings are disclosed quarterly by region. Bookings for North America, Europe and China are based on a December 31 fiscal year-end while those for Japan are based on a March 31 fiscal year-end, resulting in different quarterly reporting periods. The four quarters shown below are the quarters the presentation highlights as FY 2026. Bookings are a separate indicator from net sales.
| Quarter (millions of yen) | Japan/Asia (excl. China) | China | Europe | North America | Total |
|---|---|---|---|---|---|
| 2025/1Q | 6,605 | 1,471 | 4,286 | 3,138 | 15,501 |
| 2025/2Q | 6,374 | 886 | 4,348 | 2,407 | 14,018 |
| 2025/3Q | 7,047 | 804 | 3,655 | 2,969 | 14,476 |
| 2025/4Q | 8,310 | 850 | 4,382 | 4,074 | 17,617 |
FY 2027/3 Forecast
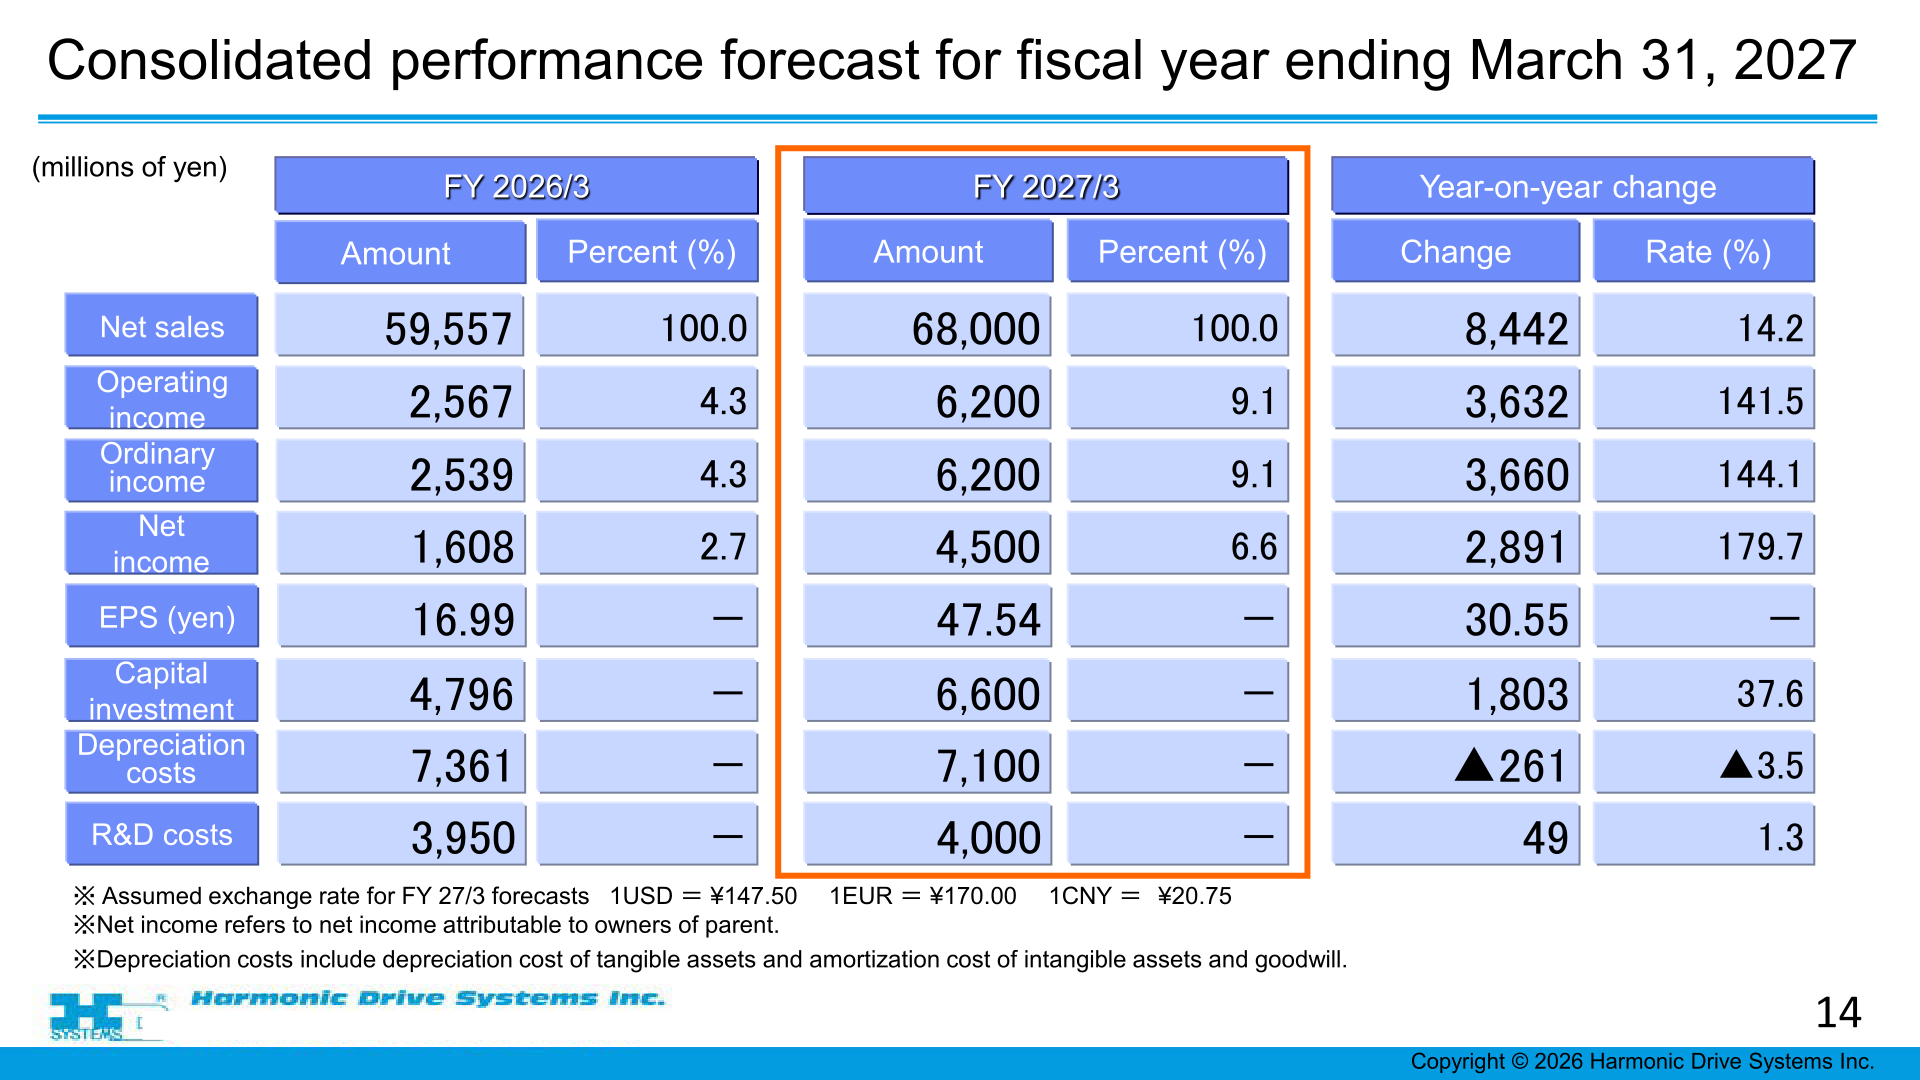
For the fiscal year ending March 31, 2027 the company forecasts net sales of ¥68,000 million (up 14.2%), operating income of ¥6,200 million (up 141.5%), ordinary income of ¥6,200 million (up 144.1%) and net income of ¥4,500 million (up 179.7%), with EPS of ¥47.54. The assumed exchange rates for the FY 27/3 forecasts are 1USD = ¥147.50, 1EUR = ¥170.00 and 1CNY = ¥20.75.
| Item (millions of yen) | FY 2026/3 | FY 2027/3 (forecast) | Change | Rate (%) |
|---|---|---|---|---|
| Net sales | 59,557 | 68,000 | 8,442 | 14.2 |
| Operating income | 2,567 | 6,200 | 3,632 | 141.5 |
| Ordinary income | 2,539 | 6,200 | 3,660 | 144.1 |
| Net income | 1,608 | 4,500 | 2,891 | 179.7 |
| EPS (yen) | 16.99 | 47.54 | 30.55 | — |
| Capital investment | 4,796 | 6,600 | 1,803 | 37.6 |
| Depreciation costs | 7,361 | 7,100 | ▲261 | ▲3.5 |
| R&D costs | 3,950 | 4,000 | 49 | 1.3 |
The bridge for the forecast operating income increase from ¥2,567 million to ¥6,200 million comprises higher income of +¥5,999 million and a higher marginal profit ratio and other factors of +¥915 million, offset by higher fixed manufacturing costs and other factors of ▲¥1,570 million, higher SG&A costs of ▲¥1,665 million and an impact of exchange rates of ▲¥46 million.
Forecasts for the main group companies for the fiscal year ending March 31, 2027 are net sales of ¥13,550 million (up 11.6%) and operating income of ¥1,200 million (up 116.9%) at HD Systems, Inc.; ¥2,500 million (up 10.4%) and ¥100 million (up 598.3%) at Harmonic AD, Inc.; ¥4,300 million (up 29.0%) and ¥440 million (up 32.2%) at Harmonic Precision Inc.; ¥4,500 million (up 10.9%) and ¥500 million (up 5.5%) at Harmonic Drive Systems (Shanghai) Co., Ltd.; and ¥18,150 million (up 7.5%) and ¥1,600 million (up 8.5%) at Harmonic Drive SE.
Shareholder Returns
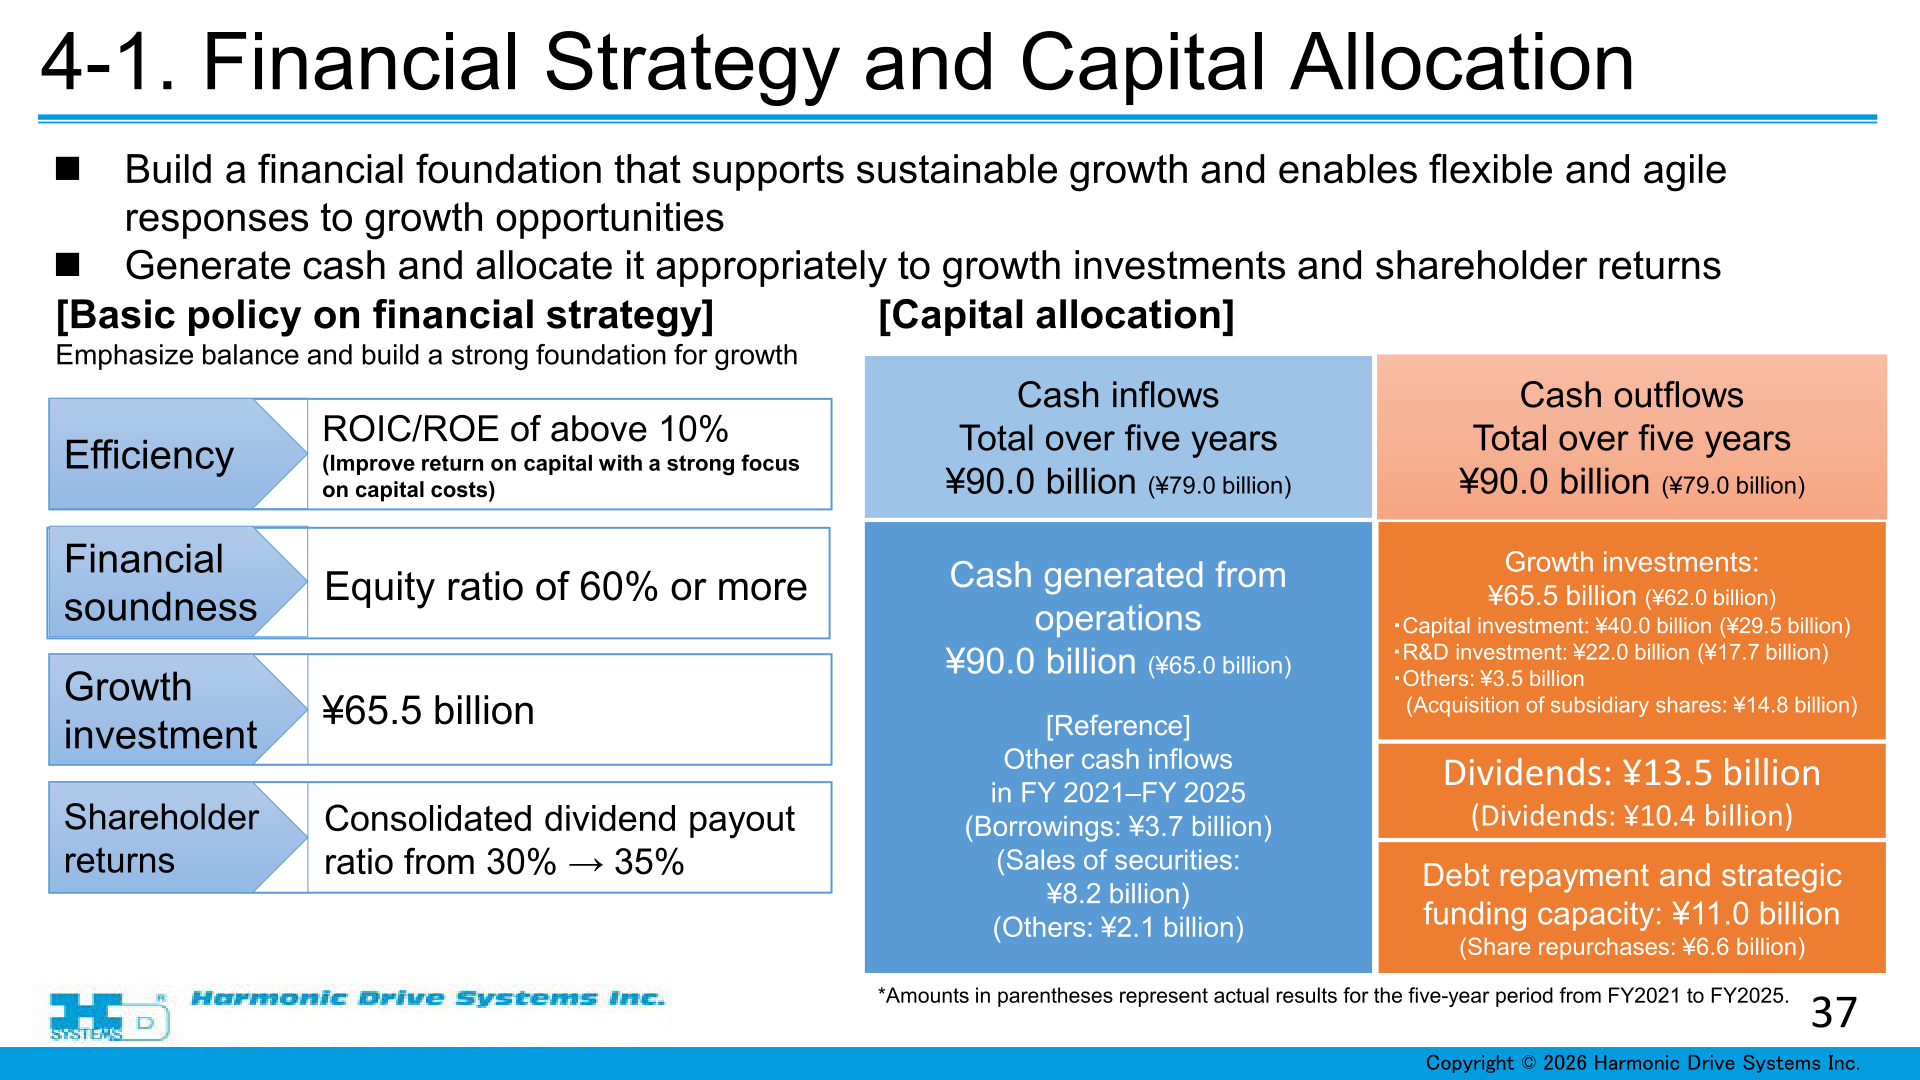
Under the financial strategy of the new Medium-Term Management Plan, the shareholder return policy is to raise the consolidated dividend payout ratio from 30% to 35%. Within the five-year capital allocation plan, cash outflows totaling ¥90.0 billion include dividends of ¥13.5 billion, against dividends of ¥10.4 billion actually paid in the five-year period from FY2021 to FY2025 (which also included share repurchases of ¥6.6 billion). A per-share dividend amount for FY 2026/3 or FY 2027/3 cannot be confirmed from the materials.
New Medium-Term Management Plan (FY 2026–FY 2030)
The company presented a new Medium-Term Management Plan covering FY 2026 to FY 2030, keeping the basic policy unchanged: sustainable growth of all businesses with an emphasis on profitability; strengthening management resources (people, things, money, information) that can adapt to changes in the environment; and initiatives to enhance corporate value that will continue into the future.
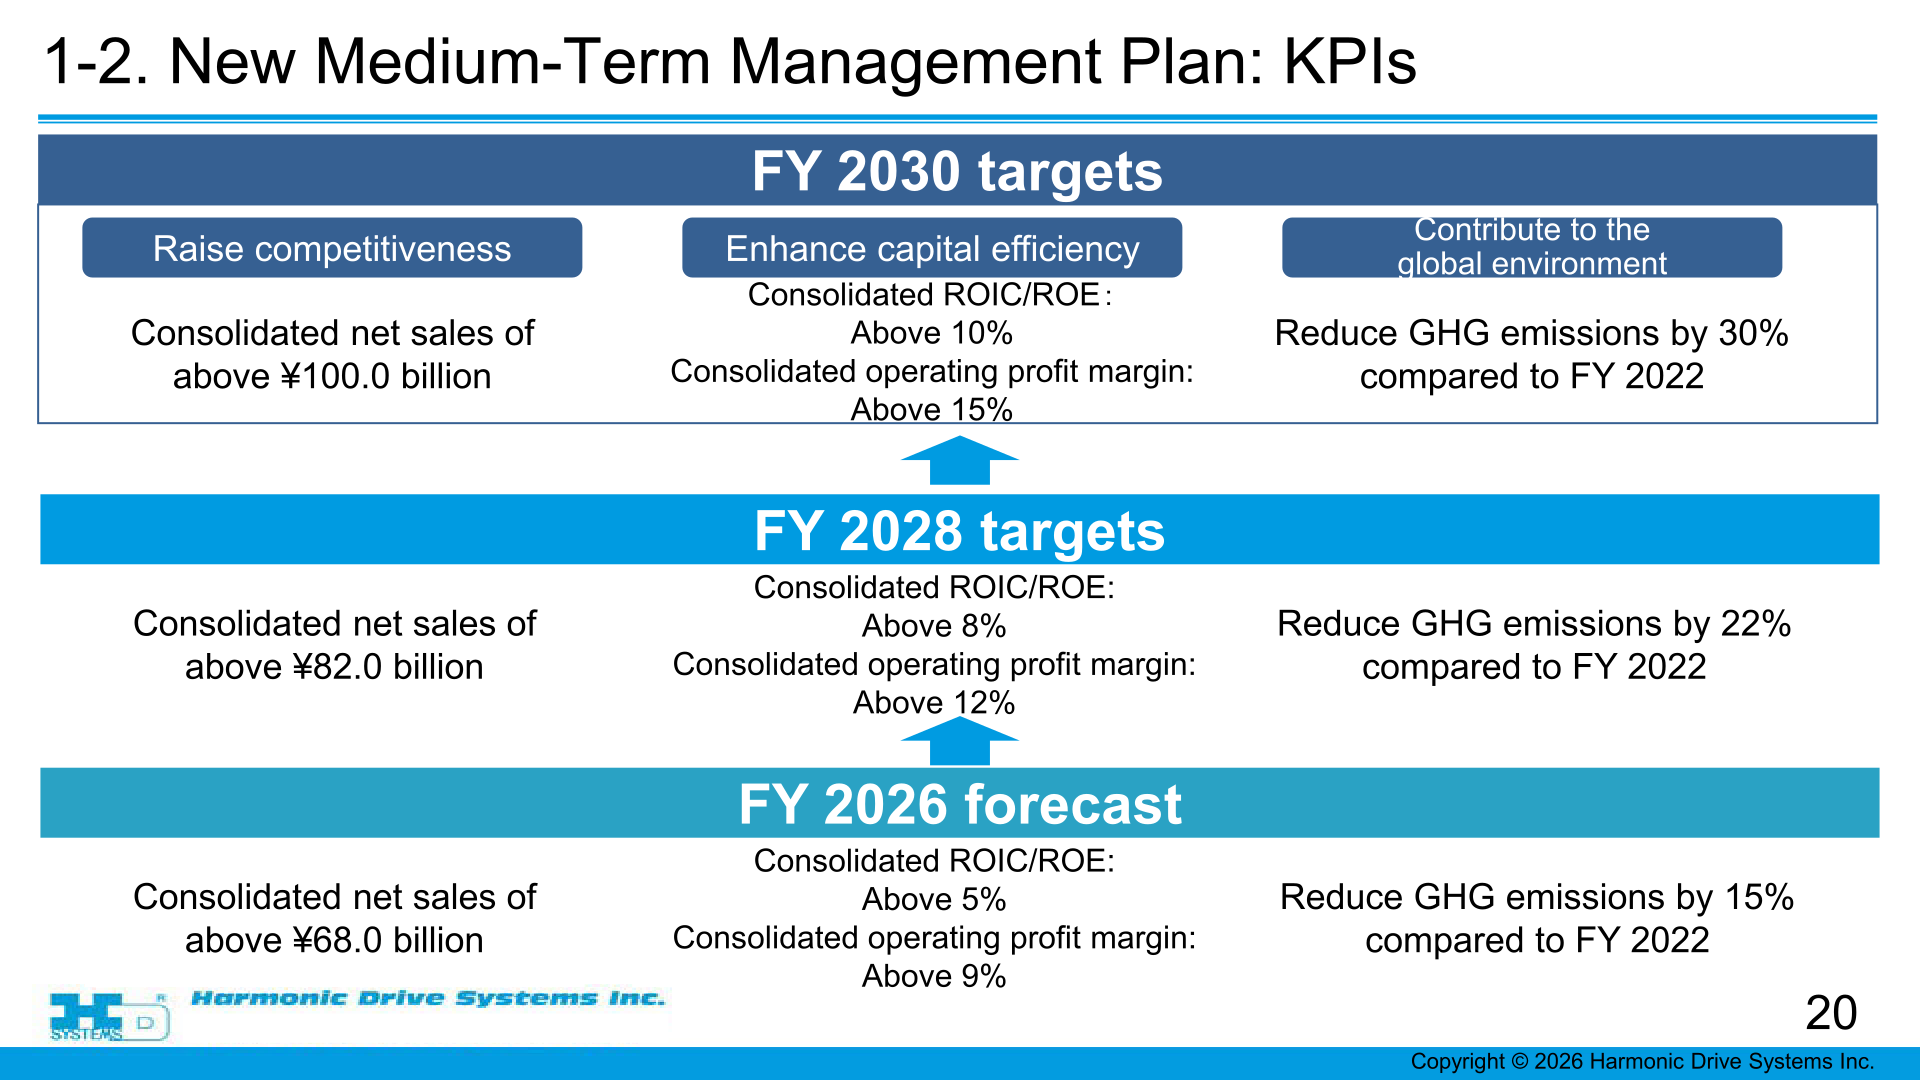
| KPI | FY 2026 forecast | FY 2028 targets | FY 2030 targets |
|---|---|---|---|
| Consolidated net sales | above ¥68.0 billion | above ¥82.0 billion | above ¥100.0 billion |
| Consolidated ROIC/ROE | Above 5% | Above 8% | Above 10% |
| Consolidated operating profit margin | Above 9% | Above 12% | Above 15% |
| GHG emissions (vs FY 2022) | Reduce by 15% | Reduce by 22% | Reduce by 30% |
Under the plan the financial strategy targets ROIC/ROE of above 10%, an equity ratio of 60% or more and growth investment of ¥65.5 billion, funded by cash generated from operations of ¥90.0 billion over five years (against ¥65.0 billion in the FY2021–FY2025 reference period). Growth investments of ¥65.5 billion break down into capital investment of ¥40.0 billion, R&D investment of ¥22.0 billion and others of ¥3.5 billion; a further ¥11.0 billion is earmarked for debt repayment and strategic funding capacity.
The consolidated sales-by-application chart shows total sales of ¥595 hundred million in 2025 rising to ¥680 hundred million in 2026, ¥820 hundred million in 2028 and ¥1,000 hundred million in 2030, with industrial robots at 196, 232, 253 and 273, semiconductor manufacturing equipment at 82, 97, 113 and 132, AI robots at 19, 23, 71 and 133, and aviation, space and defense at 58, 79, 104 and 148 over the same four years.
Growth Areas and Review of the Previous Plan
Three focus areas for growth are identified: AI and humanoid robots (highest priority, growth potential and alignment rated high), aviation, space and defense (strategic development, rated medium to high) and e-mobility (new business development, rated medium). In the AI and humanoid robot market the company reports that technical discussions are progressing with robot and module manufacturers in Japan and overseas, that it has begun expanding production capacity in the U.S. with a plan to increase monthly production capacity from 10,000 units to 15,000 units by the end of FY2026, and that it jointly developed a robot hand with MinebeaMitsumi Inc. and co-exhibited at CES 2026.
Reviewing the previous Medium-Term Management Plan for FY 2024 to FY 2026, the company cites sales price revisions of ¥450 million and cost reductions of ¥720 million on a cumulative basis for FY 2024 to FY 2025 under its company-wide cost innovation project, its listing on the Tokyo Stock Exchange Prime Market, establishment of DX infrastructure such as SAP HANA and MES, and implementation of a new HR system. Sustainability results cited include a CDP Supplier Engagement Rating of A, CDP Climate Change and Water Security ratings of A-, and a Rookie Award at the Nikkei Integrated Report Award for the FY 2025 Integrated Report.
This article is an analysis based on publicly available information and is not a recommendation to buy or sell any specific securities. Investment decisions are your own responsibility.
![[Obayashi] Investors’ Guide 2026 — The Complete 24-Article Breakdown](https://japan-equity.com/wp-content/uploads/2026/07/hub_cover-1024x1024.png)
![[Obayashi] IR & SR Policy — Feeding Dialogue Back into Management](https://japan-equity.com/wp-content/uploads/2026/07/p32_sq-1024x1024.jpg)
![[Obayashi] Real Estate Development — 18.7% Margin, ¥287.7bn Unrealized Gains](https://japan-equity.com/wp-content/uploads/2026/07/p20_sq-1024x1024.jpg)
![[Obayashi] Domestic Civil Engineering — Resilience Spending Supports 9.6% Margin](https://japan-equity.com/wp-content/uploads/2026/07/p11_sq-1024x1024.jpg)
![[Obayashi] Share Price & External Ratings — vs TOPIX, ESG Index Inclusion](https://japan-equity.com/wp-content/uploads/2026/07/p40_sq-1024x1024.jpg)
![[Construction] ¥75.5tn Investment, Shrinking Workforce — Big-5 Market Share](https://japan-equity.com/wp-content/uploads/2026/07/p12_sq-1024x1024.jpg)



![[Obayashi] Capital Policy & Shareholder Returns — ROE 10%+, DOE ~5%, ¥100bn Buyback](https://japan-equity.com/wp-content/uploads/2026/07/p27_sq-1024x1024.jpg)
![[Obayashi] Reducing Cross-Shareholdings — ¥285.2bn Sold in Five Years](https://japan-equity.com/wp-content/uploads/2026/07/p29_sq-1024x1024.jpg)
![[Obayashi] ¥750bn Investment Plan — ¥300bn to Development, ¥190bn to Tech/DX](https://japan-equity.com/wp-content/uploads/2026/07/p30_sq-1024x1024.jpg)
![[Obayashi] MTP2022 KPIs — Operating Profit ~2x Target, ROE 14.4%](https://japan-equity.com/wp-content/uploads/2026/07/p25_sq-1024x1024.jpg)
![[Obayashi] Cash Allocation — ¥420bn Investment CF Over Five Years](https://japan-equity.com/wp-content/uploads/2026/07/p26_sq-1024x1024.jpg)
![[Obayashi] Green Energy — 44 Plants, 344MW, and the Green Hydrogen Challenge](https://japan-equity.com/wp-content/uploads/2026/07/p21_sq-1024x1024.jpg)
![[Obayashi] Tackling the Labor Shortage — Robotics Construction®](https://japan-equity.com/wp-content/uploads/2026/07/p14_sq-1024x1024.jpg)
