
This article is based on publicly available IR materials and is not a recommendation to buy or sell any specific securities.
Hitachi Construction Machinery Co., Ltd. (6305) held its “Explanatory Meeting for Business Results for the Fiscal Year ended March 31, 2026 and Mid-term Management Plan” on April 24, 2026. For FY2025 (April 1, 2025 – March 31, 2026), consolidated revenue increased 2% year on year to 1,405.5 billion yen, while adjusted operating income decreased 8% to 133.0 billion yen (adjusted operating income margin 9.5%) due to the impact of the region and model mix and US tariffs, despite an increase in sales volume. Net income attributable to owners of the parent decreased 10% to 73.2 billion yen. For FY2026, the company forecasts revenue of 1,430.0 billion yen (+2%), adjusted operating income of 140.0 billion yen (+5%) and net income attributable to owners of the parent of 80.0 billion yen (+9%), with the annual cash dividend per share raised to 190 yen from 175 yen. The company also announced its new Mid-term Management Plan “LANDCROS 2028”.
Consolidated Results (Full-Year Actual)
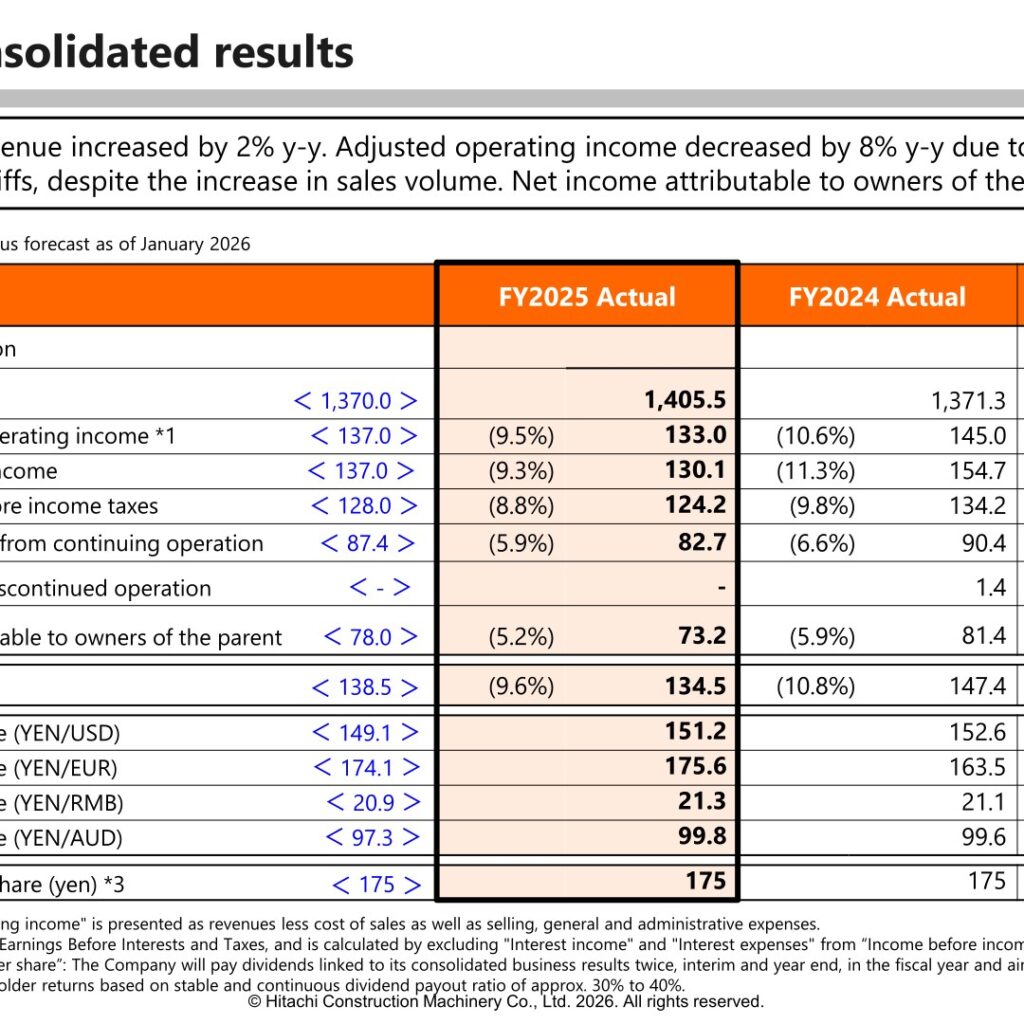
Revenue for FY2025 was 1,405.5 billion yen, up 2% from 1,371.3 billion yen in FY2024 and above the previous forecast of 1,370.0 billion yen as of January 2026. Adjusted operating income was 133.0 billion yen (margin 9.5%), down 8% from 145.0 billion yen (margin 10.6%) and below the previous forecast of 137.0 billion yen. Operating income was 130.1 billion yen, down 16% from 154.7 billion yen, and income before income taxes was 124.2 billion yen, down 7% from 134.2 billion yen. Net income from continuing operation was 82.7 billion yen (down 8% from 90.4 billion yen), and net income attributable to owners of the parent was 73.2 billion yen, down 10% from 81.4 billion yen. EBIT was 134.5 billion yen, down 9%. According to the presentation, while revenue declined year on year in the Americas OEM business and Oceania, Europe and the company’s own developing business in the Americas remained solid, and revenue increased supported by selling price increases; adjusted operating income decreased due to higher costs associated with US tariffs and growth investments, and the unfavorable regional and product mix. The average exchange rate was 151.2 yen per US dollar (FY2024: 152.6 yen) and 175.6 yen per euro (FY2024: 163.5 yen).
| Item (Billions of Yen) | FY2025 Actual | FY2024 Actual | Change |
|---|---|---|---|
| Revenue | 1,405.5 | 1,371.3 | 2% |
| Adjusted operating income | 133.0 (9.5%) | 145.0 (10.6%) | -8% |
| Operating income | 130.1 (9.3%) | 154.7 (11.3%) | -16% |
| Income before income taxes | 124.2 (8.8%) | 134.2 (9.8%) | -7% |
| Net income from continuing operation | 82.7 (5.9%) | 90.4 (6.6%) | -8% |
| Net income attributable to owners of the parent | 73.2 (5.2%) | 81.4 (5.9%) | -10% |
| EBIT | 134.5 (9.6%) | 147.4 (10.8%) | -9% |
| Rate (YEN/USD) | 151.2 | 152.6 | -1.4 |
| Rate (YEN/EUR) | 175.6 | 163.5 | 12.1 |
| Cash dividend per share (yen) | 175 | 175 | 0 |
In the year-on-year comparison of adjusted operating income (145.0 billion yen to 133.0 billion yen), the presentation attributes the change to sales volume, model mix and others of -13.4 billion yen (sales volume +4.9, model mix of value chain business +0.7, other model mix -19.0), selling price +6.3 billion yen, material cost +0.5 billion yen, overhead -4.9 billion yen (expense linked to production and sales +0.8, general overheads -0.3, expense for sustained growth -5.4), foreign exchange rate +3.8 billion yen and US tariff impact -4.3 billion yen. Despite the sales volume increase and upswing in the selling price, adjusted operating income decreased year on year due to the impact of region and model mix.
Revenue by Region, Mining and Value Chain
By geographic region, consolidated revenue increased by 23.6 billion yen year on year excluding the impact of the yen’s depreciation, absorbing the revenue decrease in the Americas OEM business and Oceania through higher revenue in Europe, the company’s own developing business in the Americas and India. Europe revenue rose 26% to 201.9 billion yen, India rose 6% to 92.6 billion yen and Japan rose 2% to 224.0 billion yen, while Oceania fell 4% to 249.0 billion yen, North America fell 3% to 302.5 billion yen and China fell 19% to 26.4 billion yen. Revenue from the company’s own developing business in the Americas increased 9% to 229.7 billion yen. The overseas ratio was 84%, unchanged from FY2024.
| Region (Billions of Yen) | FY2025 Actual | Share | FY2024 Actual | Change (Amount) | Change (%) |
|---|---|---|---|---|---|
| Japan | 224.0 | 16% | 220.0 | 4.0 | 2% |
| Asia | 119.9 | 9% | 118.5 | 1.4 | 1% |
| India | 92.6 | 7% | 87.5 | 5.2 | 6% |
| Oceania | 249.0 | 18% | 258.9 | -9.9 | -4% |
| Europe | 201.9 | 14% | 159.7 | 42.2 | 26% |
| N. America | 302.5 | 22% | 312.4 | -9.9 | -3% |
| L. America | 42.0 | 3% | 43.8 | -1.7 | -4% |
| The Americas | 344.5 | 25% | 356.1 | -11.6 | -3% |
| (Developing own business) | (229.7) | (16%) | (210.2) | (19.4) | (9%) |
| Russia-CIS | 15.9 | 1% | 19.6 | -3.7 | -19% |
| M. East | 38.5 | 3% | 33.6 | 4.9 | 15% |
| Africa | 92.7 | 7% | 85.0 | 7.8 | 9% |
| China | 26.4 | 2% | 32.5 | -6.1 | -19% |
| Total | 1,405.5 | 100% | 1,371.3 | 34.2 | 2% |
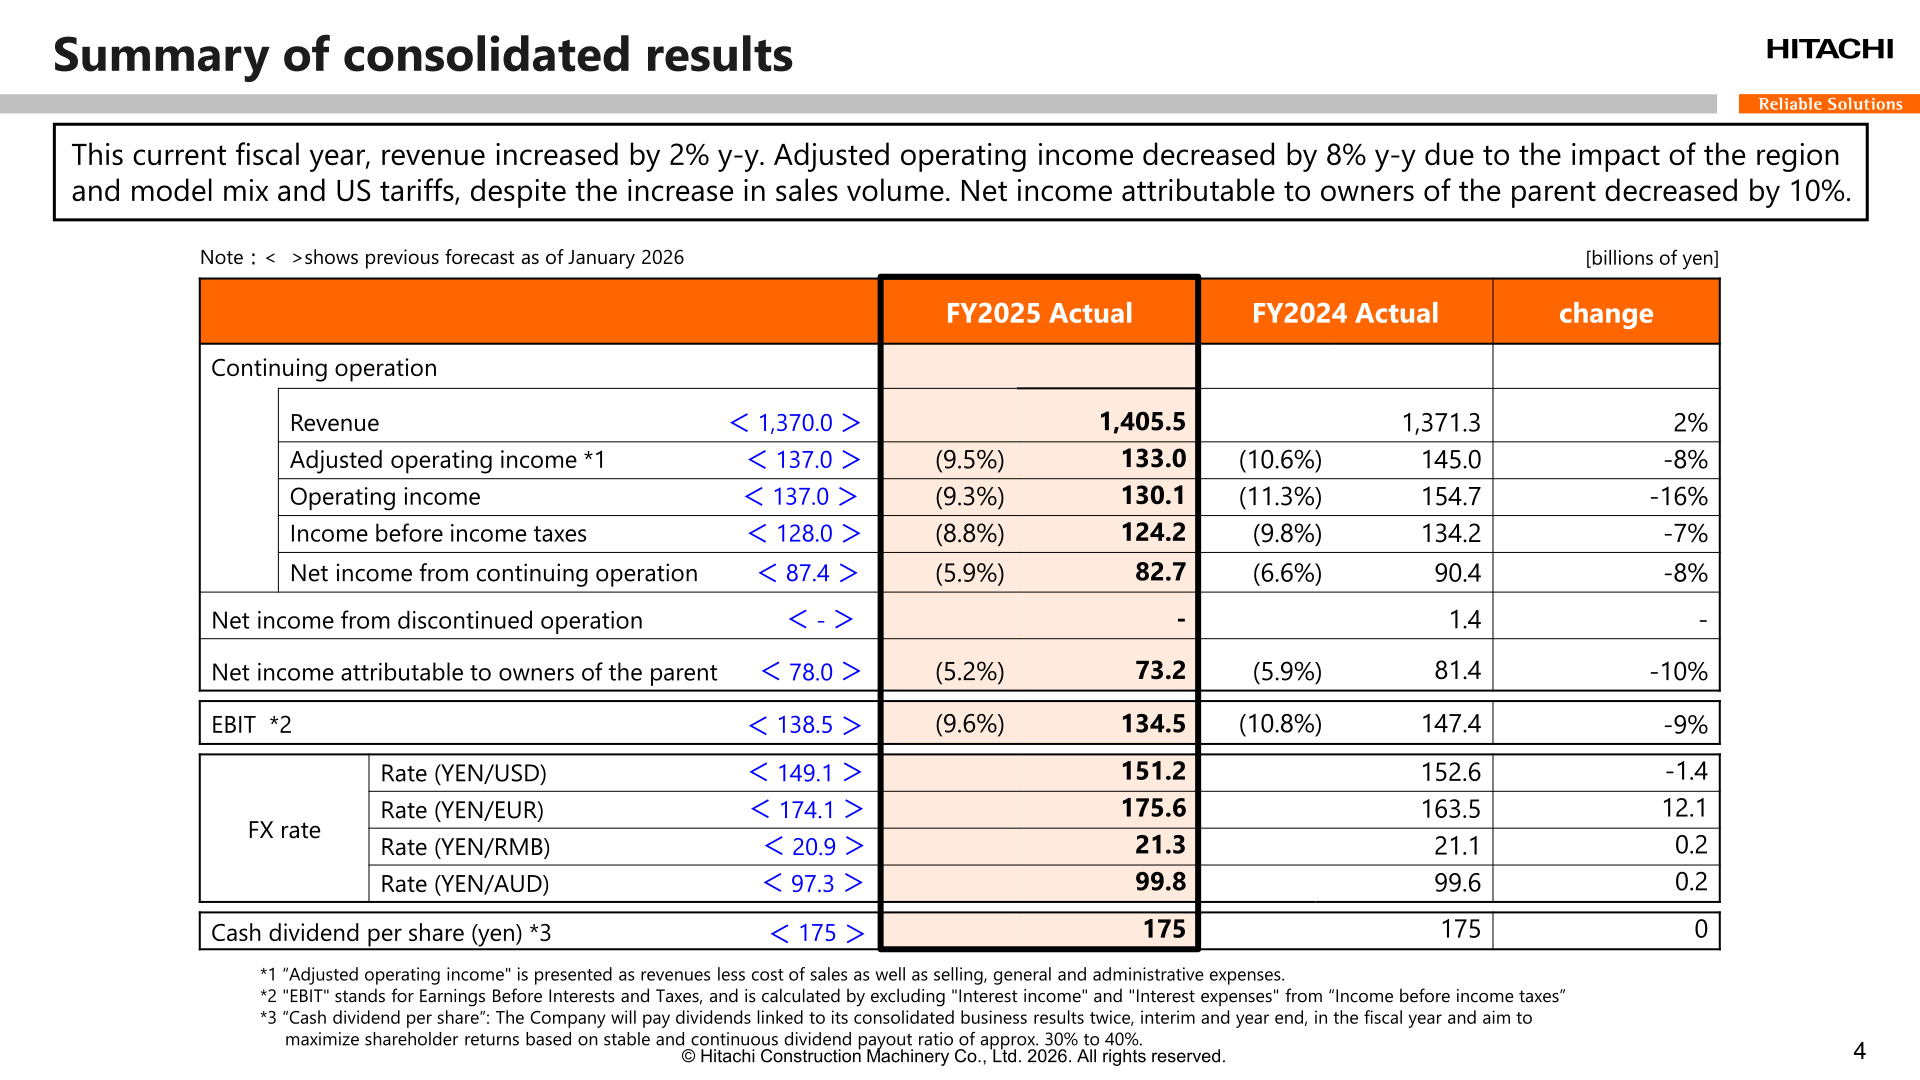
Mining revenue totaled 424.0 billion yen, down 1% year on year; despite the expansion of revenue of the specialized parts & service business, revenue of trucks and excavators decreased. Value chain revenue (parts & services, specialized parts & service business, rental and others, other than new machine sales) increased 4% year on year to 619.7 billion yen, a renewed record high; although revenue for parts & services decreased, revenue of the specialized parts & service business and rental increased. The total of parts & services was 322.2 billion yen. By reportable segment, the Construction Machinery Business recorded revenue of 1,268.6 billion yen and adjusted operating income of 121.5 billion yen (9.6%), and the Specialized Parts & Service Business recorded revenue of 145.2 billion yen and adjusted operating income of 11.5 billion yen (7.9%), with adjustments of -8.3 billion yen to revenue. The amortization of PPA included in the adjusted operating income of the Specialized Parts & Service Business was 2.0 billion yen in FY2025.
| Reportable Segment (Billions of Yen) | FY2025 Revenue | FY2025 Adjusted Operating Income | FY2026 Forecast Revenue | FY2026 Forecast Adjusted Operating Income |
|---|---|---|---|---|
| Construction Machinery Business | 1,268.6 | 121.5 (9.6%) | 1,267.6 | 121.1 (9.6%) |
| Specialized Parts & Service Business | 145.2 | 11.5 (7.9%) | 169.8 | 18.9 (11.1%) |
| Adjustments | -8.3 | – | -7.4 | – |
| Total | 1,405.5 | 133.0 (9.5%) | 1,430.0 | 140.0 (9.8%) |
Financial Position and Cash Flow
At the end of March 2026, total assets were 1,857.3 billion yen, up 66.3 billion yen year on year, mainly due to the impact of the yen’s depreciation at the fiscal year end; excluding the impact of the yen’s depreciation, total assets decreased year on year. Bonds and borrowings (interest-bearing debt) were reduced by 40.3 billion yen to 497.6 billion yen, net interest-bearing debt was 356.1 billion yen (down 34.6 billion yen), and the net D/E ratio improved to 0.40 from 0.48. Total equity was 955.7 billion yen, and the equity attributable to owners of the parent ratio was 48.5% (45.2% a year earlier). Inventories were 541.2 billion yen (up 10.0 billion yen). Net cash provided by operating activities was 164.2 billion yen (FY2024: 143.9 billion yen), and the cash flow margin for operating activities was 11.7% (10.5%), due to the continuous improvement of working capital. Net cash used in investing activities was -46.7 billion yen, free cash flows were 117.5 billion yen (FY2024: 91.1 billion yen), and net cash used in financing activities was -136.3 billion yen.
FY2026 Forecast
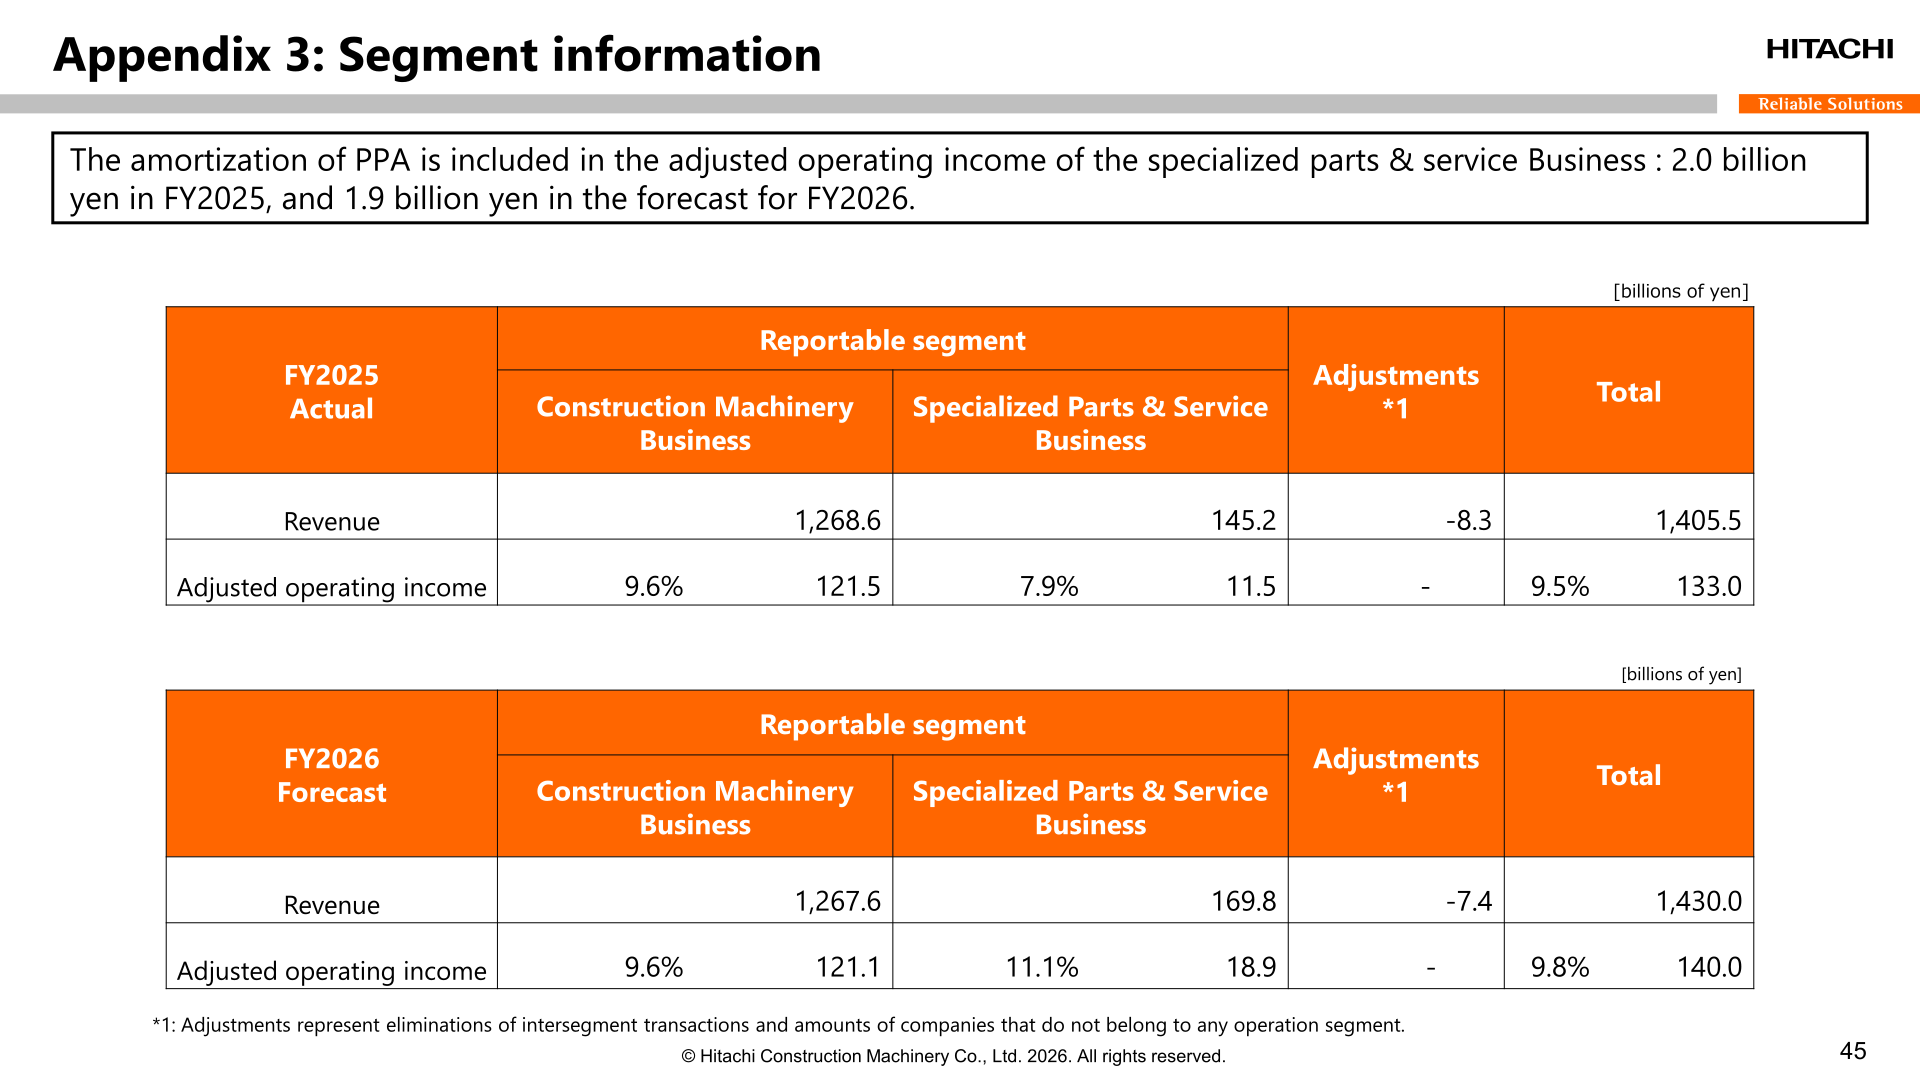
For FY2026, the company expects revenue of 1,430.0 billion yen (up 24.5 billion yen, 2%), adjusted operating income of 140.0 billion yen (9.8%; up 7.0 billion yen, 5%), operating income of 140.0 billion yen (up 9.9 billion yen, 8%), income before income taxes of 133.0 billion yen (up 8.8 billion yen, 7%), net income of 91.3 billion yen (up 8.6 billion yen, 10%) and net income attributable to owners of the parent of 80.0 billion yen (up 6.8 billion yen, 9%). Revenue and profits are expected to increase by the expansion of the company’s own developing business in the Americas, mining and value chain, despite the US tariff impact and the increase in brand change cost. Assumed exchange rates are 150.0 yen per US dollar, 178.0 yen per euro, 22.1 yen per RMB and 107.0 yen per Australian dollar. The company notes that, at this stage, the impact of heightened tensions in the Middle East has not been factored into the forecast.
| Item (Billions of Yen) | FY2026 Forecast | FY2025 Actual | Change (Amount) | Change (%) |
|---|---|---|---|---|
| Revenue | 1,430.0 | 1,405.5 | 24.5 | 2% |
| Adjusted operating income | 140.0 (9.8%) | 133.0 (9.5%) | 7.0 | 5% |
| Operating income | 140.0 (9.8%) | 130.1 (9.3%) | 9.9 | 8% |
| Income before income taxes | 133.0 (9.3%) | 124.2 (8.8%) | 8.8 | 7% |
| Net income | 91.3 | 82.7 | 8.6 | 10% |
| Net income attributable to owners of the parent | 80.0 (5.6%) | 73.2 (5.2%) | 6.8 | 9% |
| EBIT | 143.0 | 134.5 | 8.5 | – |
| Rate (YEN/USD) | 150.0 | 151.2 | -1.2 | – |
| Cash dividend per share (yen) | 190 | 175 | 15 | – |
By region, FY2026 revenue is expected to increase mainly from the company’s own developing business in the Americas (forecast 269.1 billion yen, up 17%), with North America at 316.2 billion yen (+5%), Oceania at 265.2 billion yen (+7%) and Africa at 99.1 billion yen (+7%), while the Middle East is expected to decrease 47% to 20.3 billion yen and India to decrease 7% to 86.3 billion yen. Mining revenue is expected to increase 12% year on year to 474.4 billion yen, incorporating an increase in sales of trucks, excavators and the specialized parts & service business, and value chain revenue is expected to increase 5% to 650.7 billion yen. On US tariffs, the company expects a net negative impact of 6.3 billion yen on adjusted operating income year on year in FY26, reflecting a 21.0 billion yen increase in costs and a 14.7 billion yen increase in selling prices; reciprocal tariffs have been suspended and, starting in April 2026, only a uniform tariff (25%) applies to steel and aluminum derivative products. For the company name and brand change in April 2027, the company expects a 16.8 billion yen impact on adjusted operating income for brand promotion costs and 10.0 billion yen in other operating expenses for brand switching costs. Total capital expenditures for FY2026 are expected to expand to 155.0 billion yen (FY2025: 107.7 billion yen) for investment in the value chain business in Oceania and South America, and R&D expenses are forecast at 40.0 billion yen (FY2025: 33.9 billion yen).
Shareholder Returns
The cash dividend per share for FY2025 was 175 yen, unchanged from FY2024 and in line with the previous forecast. For FY2026, the company forecasts a cash dividend per share of 190 yen, an increase of 15 yen. The company states that it pays dividends linked to its consolidated business results twice a year, interim and year end, and, for FY2026, aims to maximize shareholder returns based on a stable and continuous dividend payout ratio of approx. 40% and more (for FY2025 the stated policy was approx. 30% to 40%). The consolidated dividend payout ratio for FY2025 was 50.9%, and the new Mid-term Management Plan sets a target of 40% for FY28.
| Item | FY2025 Actual | FY2026 Forecast |
|---|---|---|
| Cash dividend per share (yen) | 175 | 190 |
| Dividend payout ratio policy | approx. 30% to 40% | approx. 40% and more |
| Consolidated dividend payout ratio | 50.9% | – |
Mid-term Management Plan: LANDCROS 2028
In reviewing the prior Mid-term Plan, the company notes that own business revenue in the Americas rose 37% from 167.6 billion yen in FY22 to 229.7 billion yen in FY25, parts and service business revenue rose 20% from 267.8 billion yen to 322.2 billion yen, adjusted operating income was 133.0 billion yen versus 136.6 billion yen in FY22, three-year cumulative operating cash flow rose 265% to 381.1 billion yen from 104.5 billion yen, and the net D/E ratio improved to 0.40 from 0.60, while global demand for hydraulic excavators fell 6% from 250,000 units in FY22 to an estimated 234,000 units in FY25. Revenue grew by 140.6 billion yen compared to FY22, primarily through the company’s own business in the Americas.
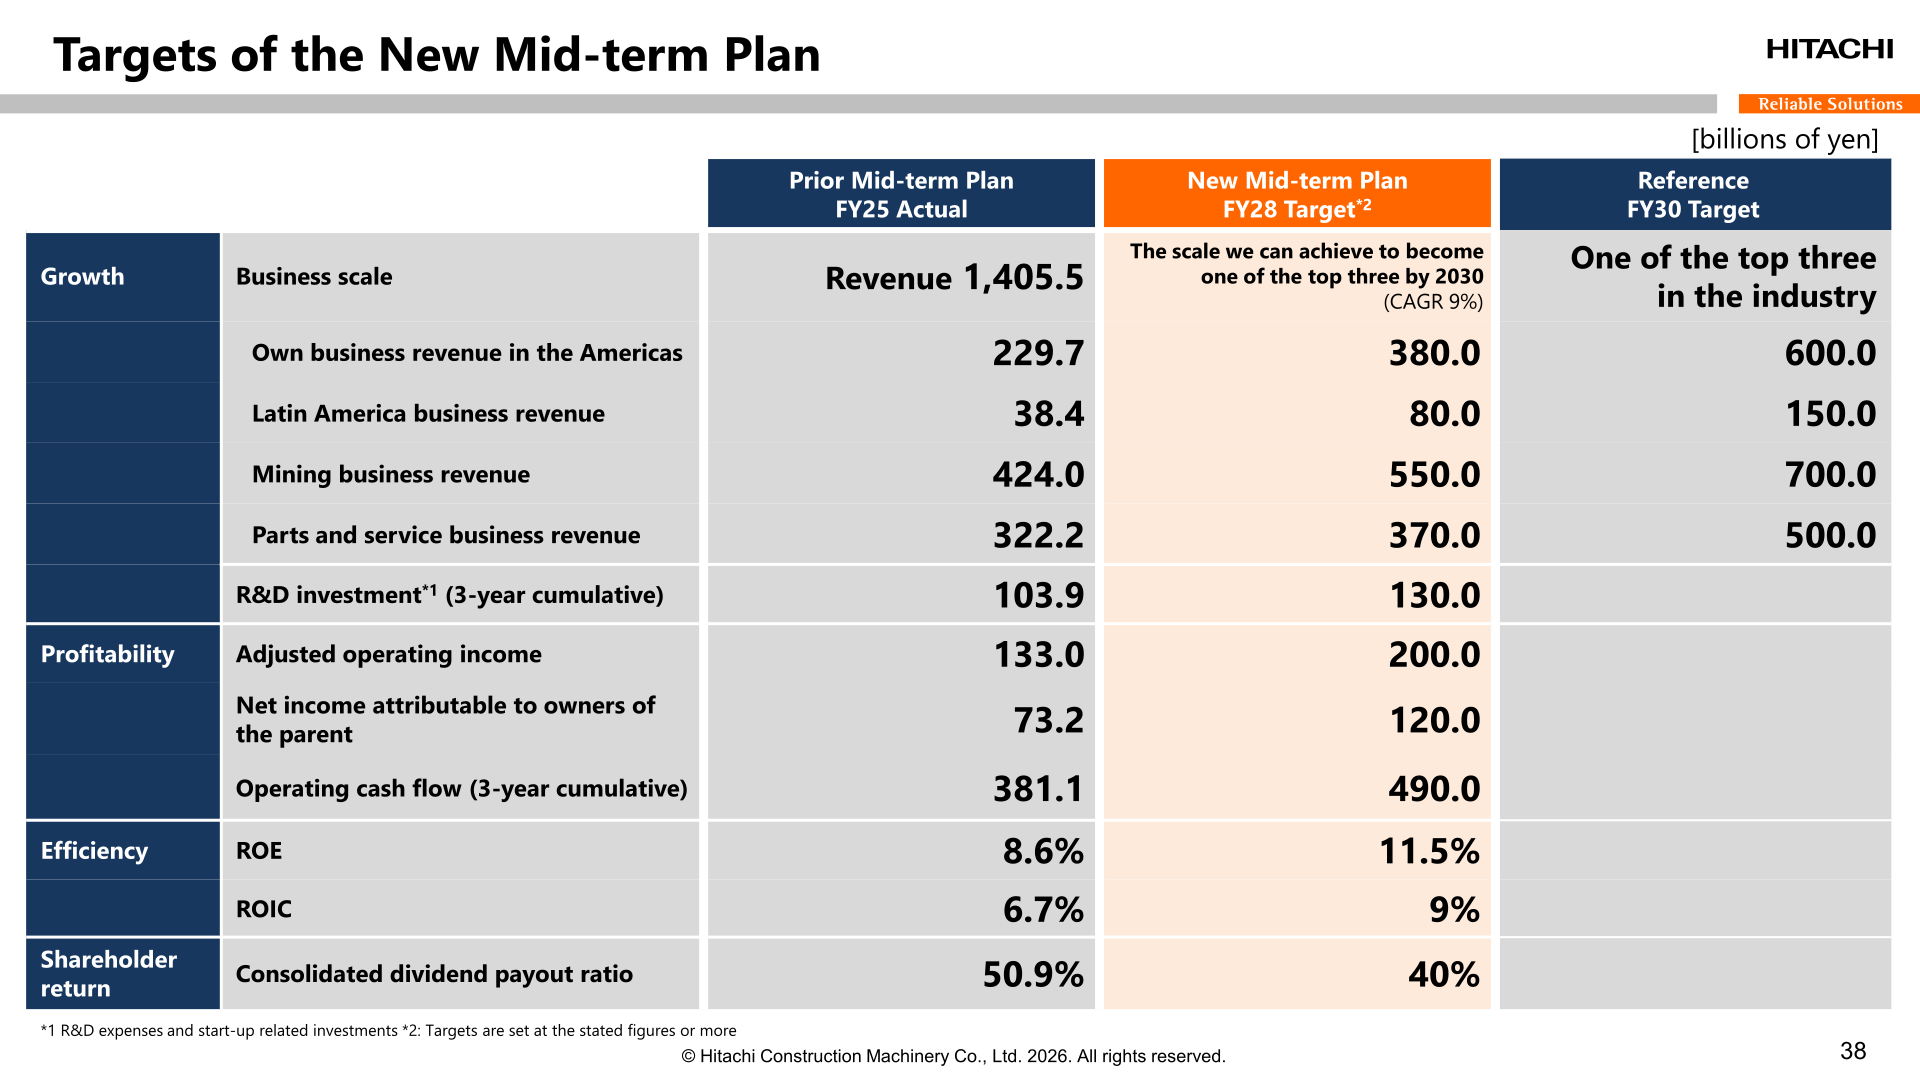
The new Mid-term Management Plan “LANDCROS 2028” positions the North American Business, Latin American Business, Mining Business and Parts and Service Business as priority businesses, together with an open strategy co-created with dealers and partners, strengthening of human capital and corporate capabilities, and growth investments and a business portfolio strategy toward becoming one of the top three in the industry by 2030. FY28 targets (stated figures or more) include own business revenue in the Americas of 380.0 billion yen, Latin America business revenue of 80.0 billion yen, mining business revenue of 550.0 billion yen, parts and service business revenue of 370.0 billion yen, adjusted operating income of 200.0 billion yen, net income attributable to owners of the parent of 120.0 billion yen, three-year cumulative operating cash flow of 490.0 billion yen, ROE of 11.5%, ROIC of 9% and a consolidated dividend payout ratio of 40%. As a reference, FY30 targets are 600.0 billion yen for own business in the Americas, 150.0 billion yen for Latin America, 700.0 billion yen for mining and 500.0 billion yen for parts and service, with revenue growth at a CAGR of 9% described as the scale needed to become one of the top three by 2030. Capital allocation assumptions for the three years include total growth investments of 500.0 billion yen funded by operating cash flow of 490.0 billion yen, cash on hand of 200.0 billion yen or more and bank borrowings, etc. of 300.0 billion yen (net D/E ratio: approx. 0.7). The presentation also notes that ITOCHU Corporation became the largest shareholder through the April 2026 shareholder composition change, and that the corporate name will change to LANDCROS Corporation in April 2027.
| Item (Billions of Yen) | FY25 Actual (Prior Mid-term Plan) | FY28 Target (New Mid-term Plan) | FY30 Target (Reference) |
|---|---|---|---|
| Revenue | 1,405.5 | – | CAGR 9% |
| Own business revenue in the Americas | 229.7 | 380.0 | 600.0 |
| Latin America business revenue | 38.4 | 80.0 | 150.0 |
| Mining business revenue | 424.0 | 550.0 | 700.0 |
| Parts and service business revenue | 322.2 | 370.0 | 500.0 |
| R&D investment (3-year cumulative) | 103.9 | 130.0 | – |
| Adjusted operating income | 133.0 | 200.0 | – |
| Net income attributable to owners of the parent | 73.2 | 120.0 | – |
| Operating cash flow (3-year cumulative) | 381.1 | 490.0 | – |
| ROE | 8.6% | 11.5% | – |
| ROIC | 6.7% | 9% | – |
| Consolidated dividend payout ratio | 50.9% | 40% | – |
This article is an analysis based on publicly available information and is not a recommendation to buy or sell any specific securities. Investment decisions are your own responsibility.
![[Obayashi] Investors’ Guide 2026 — The Complete 24-Article Breakdown](https://japan-equity.com/wp-content/uploads/2026/07/hub_cover-1024x1024.png)
![[Obayashi] IR & SR Policy — Feeding Dialogue Back into Management](https://japan-equity.com/wp-content/uploads/2026/07/p32_sq-1024x1024.jpg)
![[Obayashi] Domestic Civil Engineering — Resilience Spending Supports 9.6% Margin](https://japan-equity.com/wp-content/uploads/2026/07/p11_sq-1024x1024.jpg)
![[Obayashi] Overseas Construction — Orders Reach ¥1.2tn](https://japan-equity.com/wp-content/uploads/2026/07/p15_sq-1024x1024.jpg)
![[Obayashi] Share Price & External Ratings — vs TOPIX, ESG Index Inclusion](https://japan-equity.com/wp-content/uploads/2026/07/p40_sq-1024x1024.jpg)
![[Construction] ¥75.5tn Investment, Shrinking Workforce — Big-5 Market Share](https://japan-equity.com/wp-content/uploads/2026/07/p12_sq-1024x1024.jpg)



![[Obayashi] Capital Policy & Shareholder Returns — ROE 10%+, DOE ~5%, ¥100bn Buyback](https://japan-equity.com/wp-content/uploads/2026/07/p27_sq-1024x1024.jpg)
![[Obayashi] Reducing Cross-Shareholdings — ¥285.2bn Sold in Five Years](https://japan-equity.com/wp-content/uploads/2026/07/p29_sq-1024x1024.jpg)
![[Obayashi] ¥750bn Investment Plan — ¥300bn to Development, ¥190bn to Tech/DX](https://japan-equity.com/wp-content/uploads/2026/07/p30_sq-1024x1024.jpg)
![[Obayashi] MTP2022 KPIs — Operating Profit ~2x Target, ROE 14.4%](https://japan-equity.com/wp-content/uploads/2026/07/p25_sq-1024x1024.jpg)
![[Obayashi] Cash Allocation — ¥420bn Investment CF Over Five Years](https://japan-equity.com/wp-content/uploads/2026/07/p26_sq-1024x1024.jpg)
![[Obayashi] Green Energy — 44 Plants, 344MW, and the Green Hydrogen Challenge](https://japan-equity.com/wp-content/uploads/2026/07/p21_sq-1024x1024.jpg)
![[Obayashi] Tackling the Labor Shortage — Robotics Construction®](https://japan-equity.com/wp-content/uploads/2026/07/p14_sq-1024x1024.jpg)
