
This article is based on publicly available IR materials and is not a recommendation to buy or sell any specific securities.
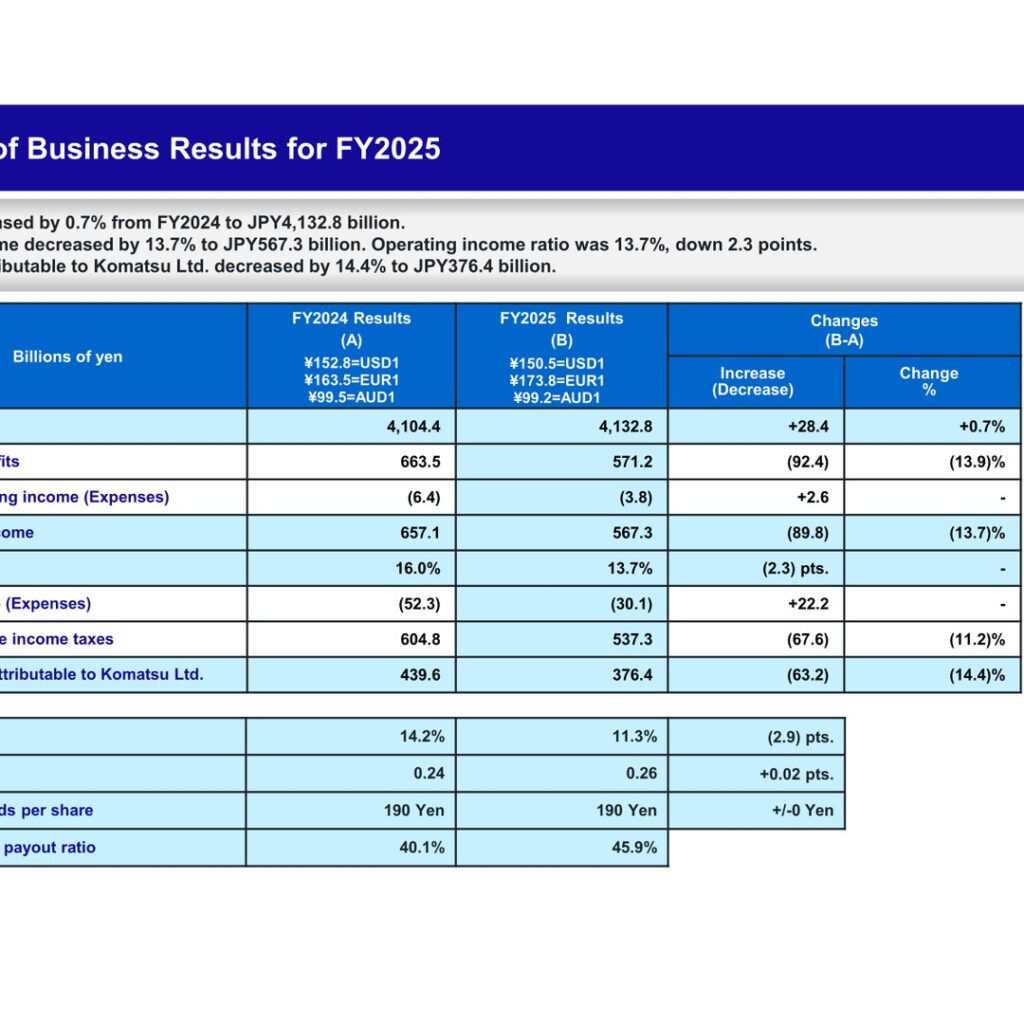
Komatsu Ltd. (6301) reported FY2025 (April 2025–March 2026) consolidated net sales of JPY4,132.8 billion, up 0.7% year on year, as higher selling prices offset lower sales volume. Operating income fell 13.7% to JPY567.3 billion (operating income ratio 13.7%, down 2.3 points), and net income attributable to Komatsu Ltd. declined 14.4% to JPY376.4 billion, mainly due to decreased sales volume, product mix, and higher production costs from tariffs in the core Construction, Mining & Utility Equipment segment. For FY2026, the company projects net sales of JPY4,118.0 billion (down 0.4%) and operating income of JPY508.0 billion (down 10.5%), reflecting the anticipated impact of the situation in the Middle East and expanded U.S. tariffs.
Consolidated Results (Full-Year Actual)
Segment profits for FY2025 totaled JPY571.2 billion, down 13.9% from JPY663.5 billion in FY2024. Income before income taxes decreased 11.2% to JPY537.3 billion. ROE was 11.3%, down 2.9 points from 14.2% in FY2024, while the Net D/E ratio was 0.26, up 0.02 points from 0.24. The cash dividend per share was maintained at 190 yen, and the consolidated payout ratio was 45.9%, versus 40.1% in FY2024.
| Item | FY2025 | FY2024 | Change |
|---|---|---|---|
| Net sales (Billions of yen) | 4,132.8 | 4,104.4 | +0.7% (+28.4) |
| Segment profits (Billions of yen) | 571.2 | 663.5 | (13.9)% (92.4) |
| Operating income (Billions of yen) | 567.3 | 657.1 | (13.7)% (89.8) |
| Operating income ratio | 13.7% | 16.0% | (2.3) pts. |
| Income before income taxes (Billions of yen) | 537.3 | 604.8 | (11.2)% (67.6) |
| Net income attributable to Komatsu Ltd. (Billions of yen) | 376.4 | 439.6 | (14.4)% (63.2) |
| ROE | 11.3% | 14.2% | (2.9) pts. |
| Net D/E ratio | 0.26 | 0.24 | +0.02 pts. |
| Cash dividends per share | 190 Yen | 190 Yen | +/-0 Yen |
| Consolidated payout ratio | 45.9% | 40.1% | – |
Segment Results
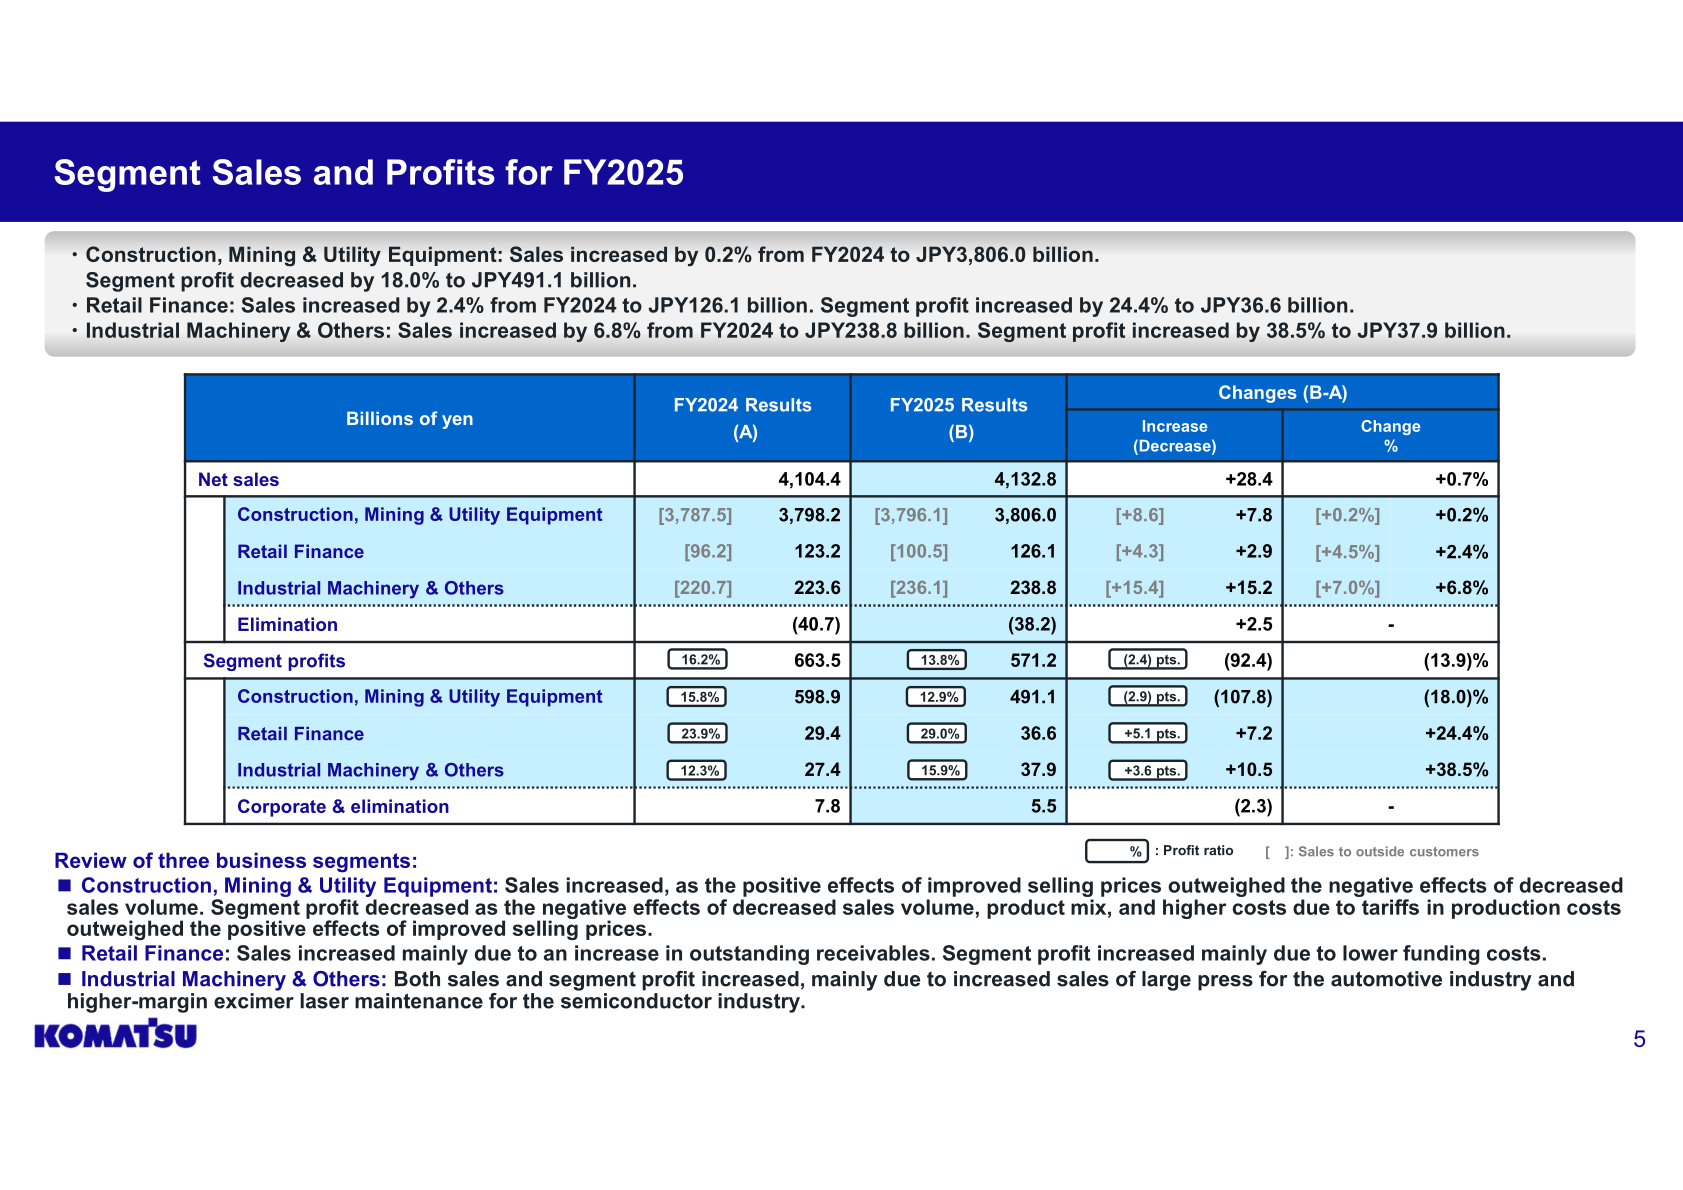
Construction, Mining & Utility Equipment sales increased 0.2% to JPY3,806.0 billion as improved selling prices outweighed lower sales volume, but segment profit fell 18.0% to JPY491.1 billion as decreased sales volume, product mix, and higher tariff-related production costs outweighed the benefit of higher prices; segment profit ratio was 12.9%, down 2.9 points. Retail Finance sales rose 2.4% to JPY126.1 billion and segment profit rose 24.4% to JPY36.6 billion, mainly due to an increase in outstanding receivables and lower funding costs. Industrial Machinery & Others sales rose 6.8% to JPY238.8 billion and segment profit rose 38.5% to JPY37.9 billion, driven by increased sales of large press equipment for the automotive industry and higher-margin excimer laser maintenance for the semiconductor industry.
| Segment | Metric | FY2025 | FY2024 |
|---|---|---|---|
| Construction, Mining & Utility Equipment | Net sales (Billions of yen) | 3,806.0 | 3,798.2 |
| Construction, Mining & Utility Equipment | Segment profit (Billions of yen) | 491.1 | 598.9 |
| Construction, Mining & Utility Equipment | Segment profit ratio | 12.9% | 15.8% |
| Retail Finance | Net sales (Billions of yen) | 126.1 | 123.2 |
| Retail Finance | Segment profit (Billions of yen) | 36.6 | 29.4 |
| Retail Finance | Segment profit ratio | 29.0% | 23.9% |
| Industrial Machinery & Others | Net sales (Billions of yen) | 238.8 | 223.6 |
| Industrial Machinery & Others | Segment profit (Billions of yen) | 37.9 | 27.4 |
| Industrial Machinery & Others | Segment profit ratio | 15.9% | 12.3% |
FY2026 Forecast
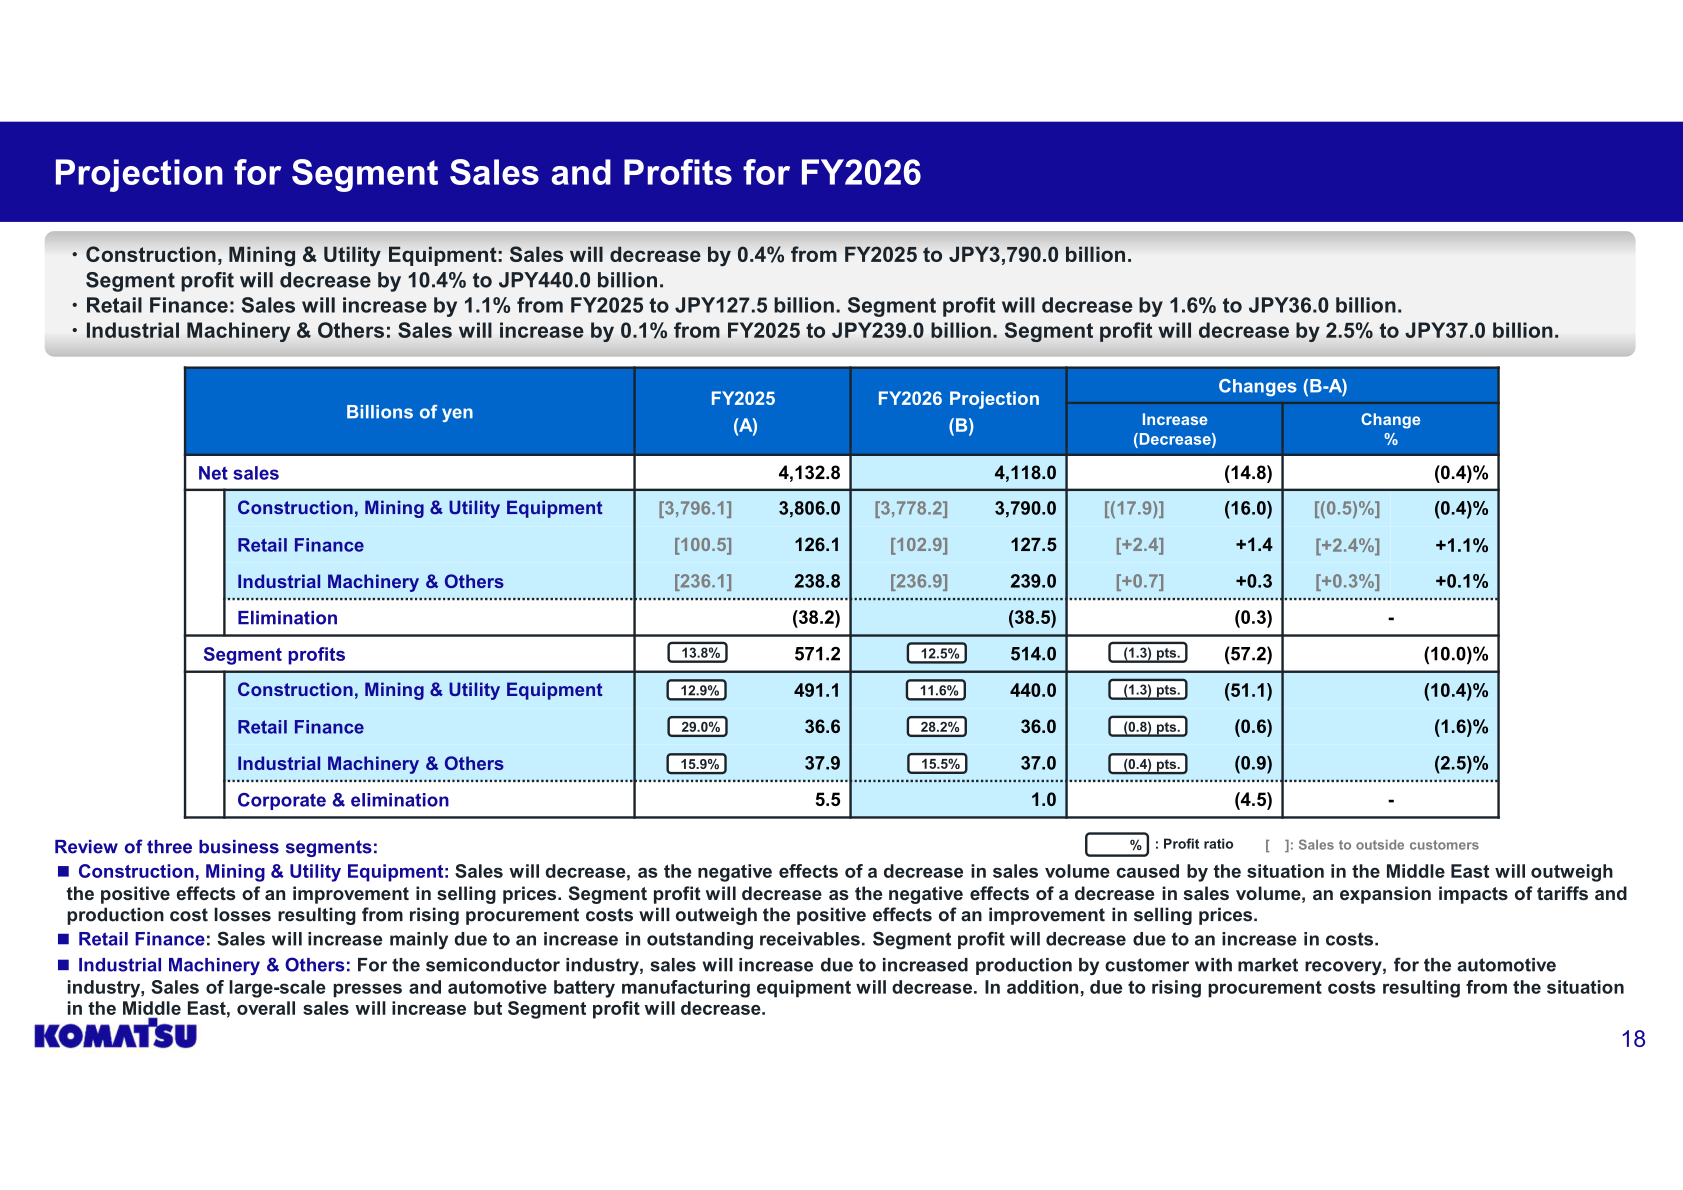
Komatsu projects FY2026 net sales of JPY4,118.0 billion, down 0.4% from FY2025, and operating income of JPY508.0 billion, down 10.5% (operating income ratio 12.3%, down 1.4 points). Net income attributable to Komatsu Ltd. is projected to decline 15.5% to JPY318.0 billion. The projection factors in an estimated JPY90.1 billion reduction in sales and a JPY18.8 billion increase in costs related to the situation in the Middle East, as well as a JPY37.8 billion increase in costs from U.S. tariffs (including the additional tariff under Section 122 and revised steel and aluminum tariffs), partly offset by a JPY30 billion refund related to IEEPA tariffs. By segment, Construction, Mining & Utility Equipment sales are projected to decrease 0.4% to JPY3,790.0 billion and segment profit to decrease 10.4% to JPY440.0 billion (profit ratio 11.6%, down 1.3 points), mainly due to lower sales volume from the situation in the Middle East and expanded tariff and production-cost impacts. Retail Finance sales are projected to increase 1.1% to JPY127.5 billion while segment profit is projected to decrease 1.6% to JPY36.0 billion due to higher costs. Industrial Machinery & Others sales are projected to increase 0.1% to JPY239.0 billion while segment profit is projected to decrease 2.5% to JPY37.0 billion, as increased semiconductor-related sales are offset by lower sales of large presses and automotive battery manufacturing equipment and rising procurement costs linked to the situation in the Middle East.
| Item | Forecast | FY2025 (Actual) |
|---|---|---|
| Net sales (Billions of yen) | 4,118.0 | 4,132.8 |
| Segment profits (Billions of yen) | 514.0 | 571.2 |
| Operating income (Billions of yen) | 508.0 | 567.3 |
| Operating income ratio | 12.3% | 13.7% |
| Income before income taxes (Billions of yen) | 466.0 | 537.3 |
| Net income attributable to Komatsu Ltd. (Billions of yen) | 318.0 | 376.4 |
| ROE (excl. share buyback effects) | 9.1% | 11.3% |
| Cash dividends per share | 190 Yen | 190 Yen |
| Consolidated payout ratio (excl. share buyback effects) | 53.8% | 45.9% |
Shareholder Returns
Komatsu maintained its cash dividend per share at 190 yen for FY2025 and forecasts an unchanged 190 yen per share for FY2026. The consolidated payout ratio was 45.9% for FY2025, above the company’s target of 40% or more (consolidated), and is projected at 53.8% for FY2026 (excluding share buyback effects). Under the Strategic Growth Plan, Komatsu conducted 100 billion yen of share buybacks in FY2025, with its policy being to conduct timely share buybacks based on an overall balance of financial soundness, the shareholders’ equity ratio, and other factors.
| Item | FY2025 | FY2026 Forecast |
|---|---|---|
| Cash dividend per share | 190 Yen | 190 Yen |
| Consolidated payout ratio | 45.9% | 53.8% (excl. share buyback effects) |
| Share buyback (FY2025 result) | 100 billion yen | – |
Medium-Term Plan / Topics
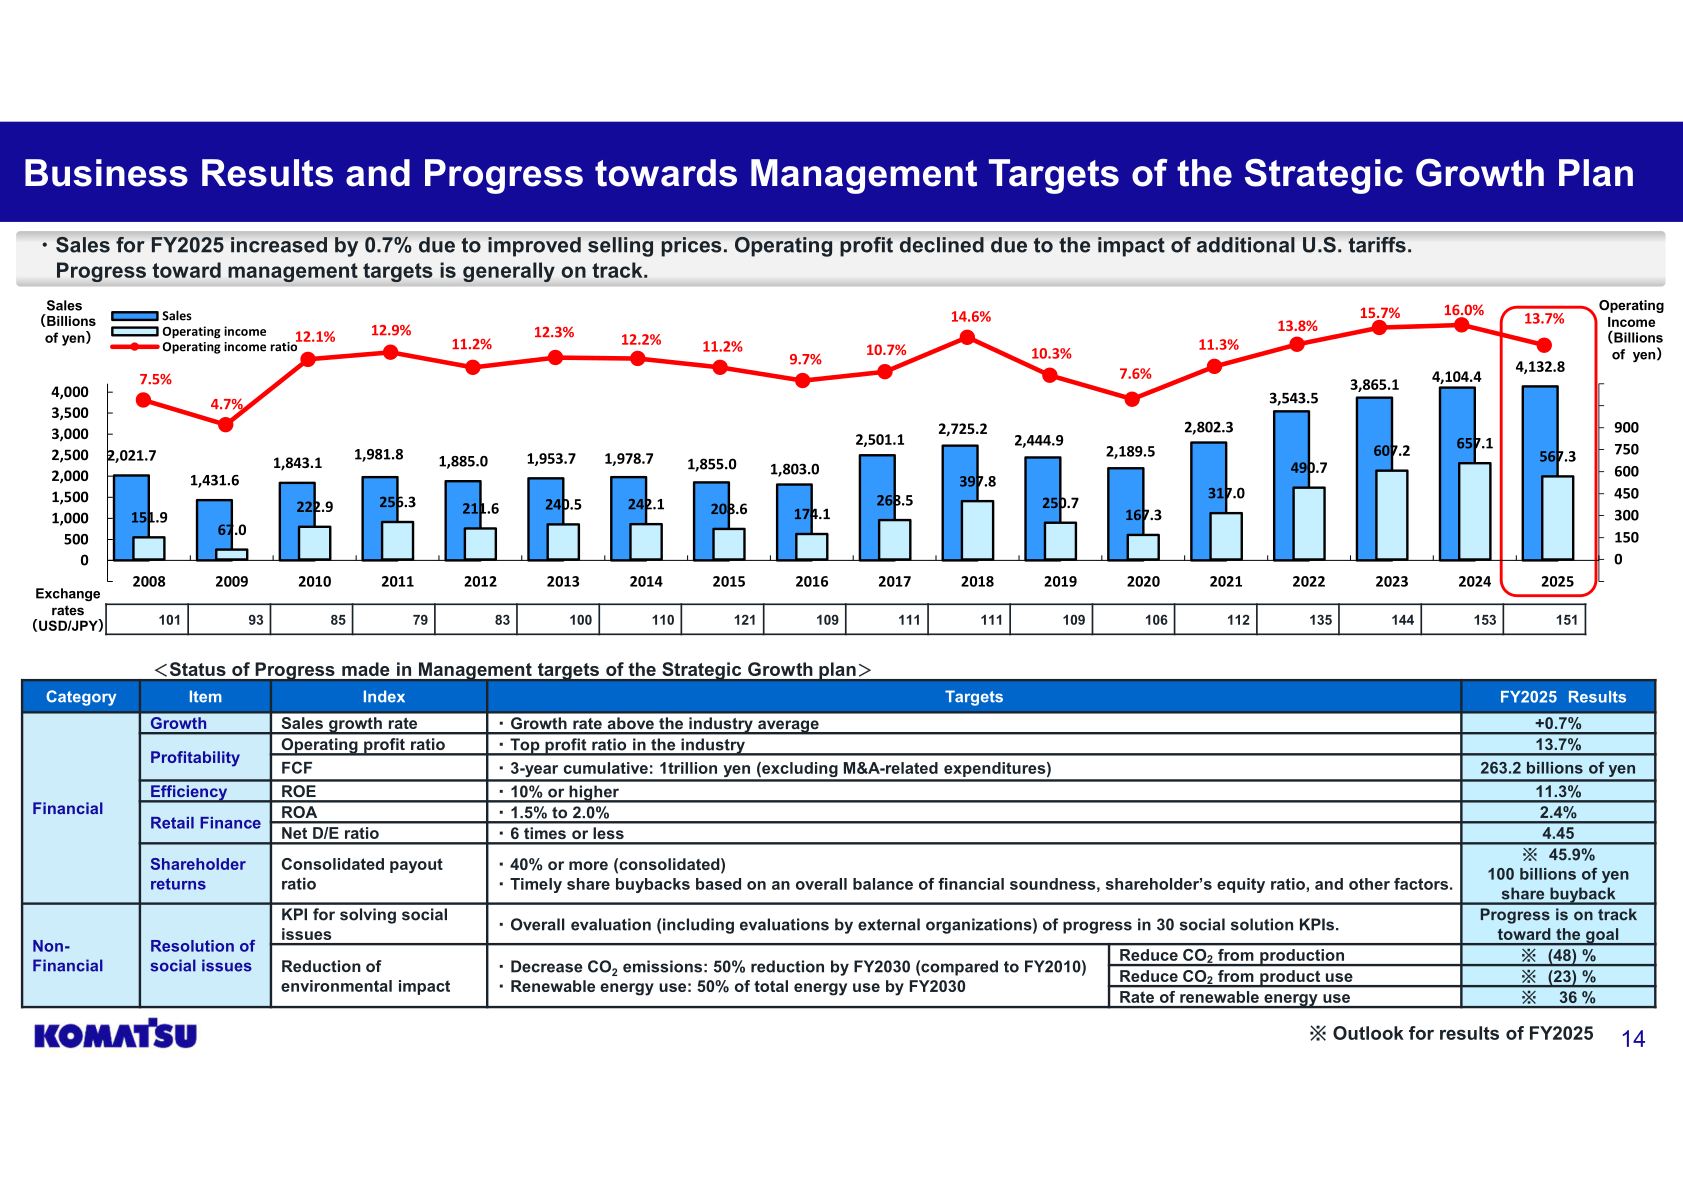
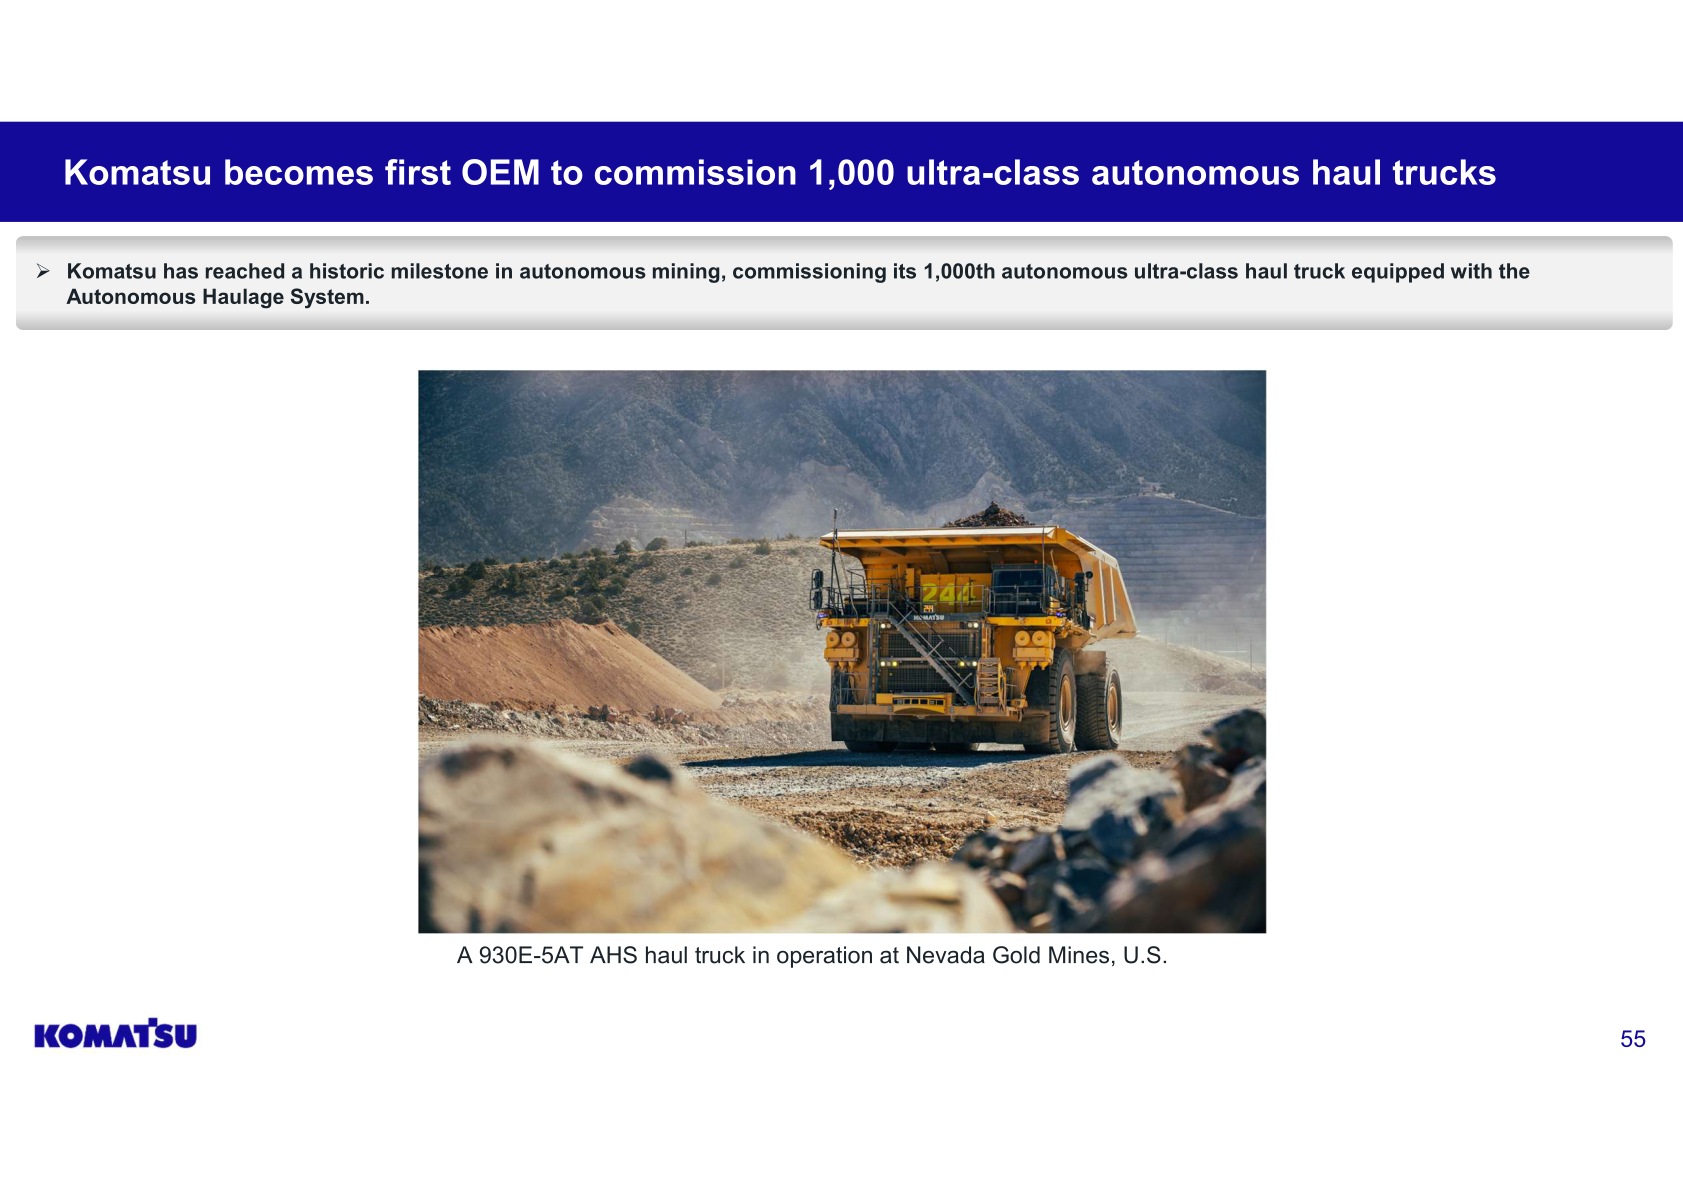
Progress toward the Strategic Growth Plan’s management targets was generally on track in FY2025: sales growth of +0.7% (target: growth rate above the industry average), operating profit ratio of 13.7% (target: top profit ratio in the industry), FCF of JPY263.2 billion (target: JPY1 trillion cumulative over 3 years, excluding M&A-related expenditures), ROE of 11.3% (target: 10% or higher), Retail Finance ROA of 2.4% (target: 1.5% to 2.0%), and Retail Finance Net D/E ratio of 4.45 times (target: 6 times or less). On non-financial KPIs, Komatsu reported a 48% reduction in CO2 from production and a 23% reduction in CO2 from product use (target: 50% reduction by FY2030 compared with FY2010), and a renewable energy use rate of 36% (target: 50% of total energy use by FY2030). Progress on the KPI for solving social issues was assessed as on track toward the goal. Key FY2025 initiatives included field testing of a diesel trolley power-agnostic truck at a copper mine in Sweden, a proof-of-concept test of a hydrogen fuel cell-powered hydraulic excavator, and collaboration with Applied Intuition on software-defined vehicle development and with TIER IV Inc. on autonomous construction equipment technology. Komatsu also acquired the remanufacturing business of SRC of Lexington, Inc. in the United States, acquired Malwa Forest AB (a Swedish forestry machinery manufacturer) through its subsidiary Komatsu Forest AB, and became the first OEM to commission 1,000 ultra-class autonomous haul trucks equipped with its Autonomous Haulage System.
This article is an analysis based on publicly available information and is not a recommendation to buy or sell any specific securities. Investment decisions are your own responsibility.
![[Obayashi] Investors’ Guide 2026 — The Complete 24-Article Breakdown](https://japan-equity.com/wp-content/uploads/2026/07/hub_cover-1024x1024.png)
![[Obayashi] IR & SR Policy — Feeding Dialogue Back into Management](https://japan-equity.com/wp-content/uploads/2026/07/p32_sq-1024x1024.jpg)
![[Obayashi] Real Estate Development — 18.7% Margin, ¥287.7bn Unrealized Gains](https://japan-equity.com/wp-content/uploads/2026/07/p20_sq-1024x1024.jpg)
![[Obayashi] Domestic Civil Engineering — Resilience Spending Supports 9.6% Margin](https://japan-equity.com/wp-content/uploads/2026/07/p11_sq-1024x1024.jpg)
![[Obayashi] Share Price & External Ratings — vs TOPIX, ESG Index Inclusion](https://japan-equity.com/wp-content/uploads/2026/07/p40_sq-1024x1024.jpg)
![[Construction] ¥75.5tn Investment, Shrinking Workforce — Big-5 Market Share](https://japan-equity.com/wp-content/uploads/2026/07/p12_sq-1024x1024.jpg)



![[Obayashi] Capital Policy & Shareholder Returns — ROE 10%+, DOE ~5%, ¥100bn Buyback](https://japan-equity.com/wp-content/uploads/2026/07/p27_sq-1024x1024.jpg)
![[Obayashi] Reducing Cross-Shareholdings — ¥285.2bn Sold in Five Years](https://japan-equity.com/wp-content/uploads/2026/07/p29_sq-1024x1024.jpg)
![[Obayashi] ¥750bn Investment Plan — ¥300bn to Development, ¥190bn to Tech/DX](https://japan-equity.com/wp-content/uploads/2026/07/p30_sq-1024x1024.jpg)
![[Obayashi] MTP2022 KPIs — Operating Profit ~2x Target, ROE 14.4%](https://japan-equity.com/wp-content/uploads/2026/07/p25_sq-1024x1024.jpg)
![[Obayashi] Cash Allocation — ¥420bn Investment CF Over Five Years](https://japan-equity.com/wp-content/uploads/2026/07/p26_sq-1024x1024.jpg)
![[Obayashi] Green Energy — 44 Plants, 344MW, and the Green Hydrogen Challenge](https://japan-equity.com/wp-content/uploads/2026/07/p21_sq-1024x1024.jpg)
![[Obayashi] Tackling the Labor Shortage — Robotics Construction®](https://japan-equity.com/wp-content/uploads/2026/07/p14_sq-1024x1024.jpg)
