
This article is based on publicly available IR materials and is not a recommendation to buy or sell any specific securities.
Note on fiscal-year labels: this article follows our site convention of classifying the most recently completed fiscal year as FY2025. Oiles Corporation’s presentation labels the same period “FYE March 2026” in its results sections and “FY2025” in its Medium-Term Management Plan sections; the labels used in the text, tables and segment data below are kept as they appear in the materials.
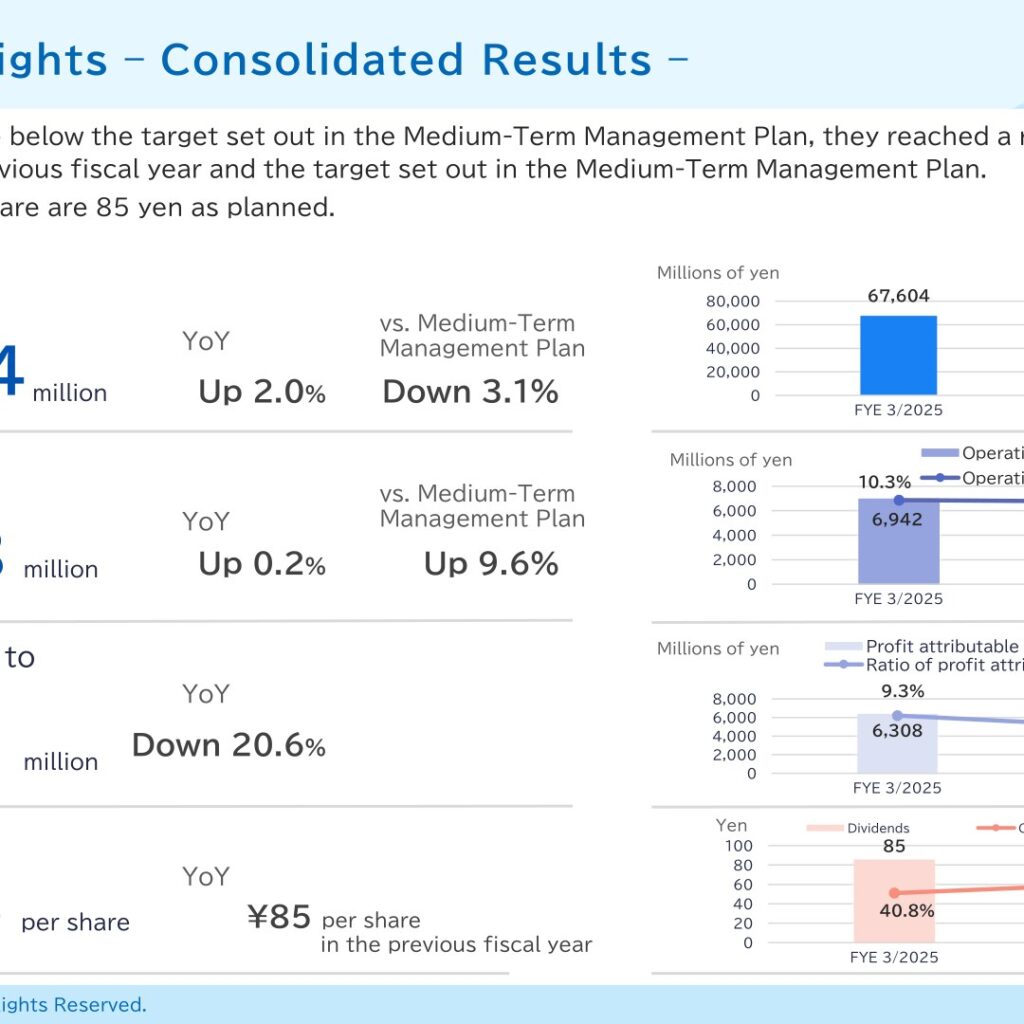
Oiles Corporation reported net sales of ¥68,964 million for the fiscal year ended March 31, 2026, up 2.0% year on year, and operating profit of ¥6,958 million, up 0.2%. The company states that although net sales were below the target set out in the Medium-Term Management Plan, they reached a record high, while operating profit exceeded both the previous fiscal year and the Medium-Term Management Plan target. Profit attributable to owners of parent fell 20.6% to ¥5,009 million. Annual dividends per share were ¥85 as planned, and the company forecasts ¥95 per share for the fiscal year ending March 2027.
Consolidated Results (Full-Year Actual)
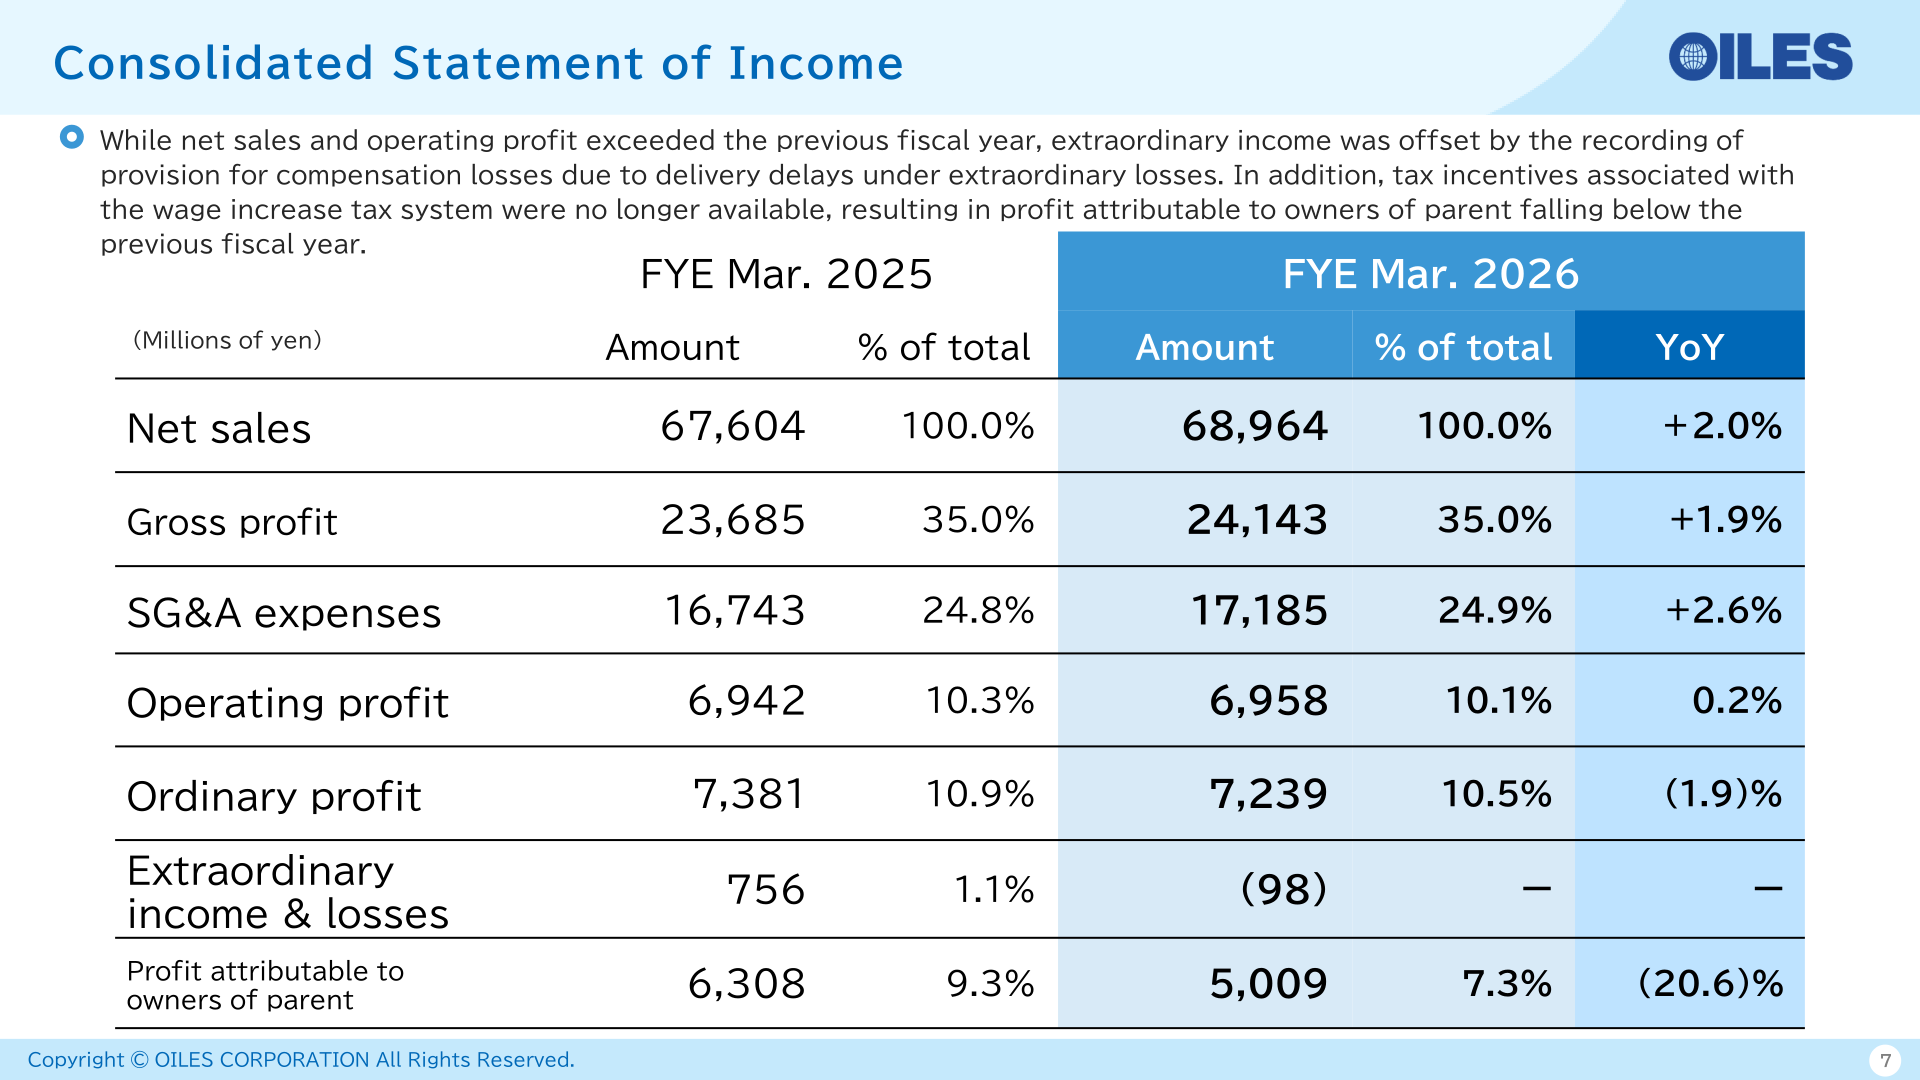
The presentation explains that while net sales and operating profit exceeded the previous fiscal year, extraordinary income was offset by the recording of provision for compensation losses due to delivery delays under extraordinary losses. In addition, tax incentives associated with the wage increase tax system were no longer available, resulting in profit attributable to owners of parent falling below the previous fiscal year. The operating profit margin was 10.1% (10.3% in the previous fiscal year) and the ratio of profit attributable to owners of parent was 7.3% (9.3%). Against the Medium-Term Management Plan, net sales were down 3.1% and operating profit was up 9.6%.
| Item (Millions of yen) | FYE Mar. 2025 | FYE Mar. 2026 | YoY |
|---|---|---|---|
| Net sales | 67,604 | 68,964 | +2.0% |
| Gross profit | 23,685 | 24,143 | +1.9% |
| SG&A expenses | 16,743 | 17,185 | +2.6% |
| Operating profit | 6,942 | 6,958 | 0.2% |
| Ordinary profit | 7,381 | 7,239 | (1.9)% |
| Extraordinary income & losses | 756 | (98) | — |
| Profit attributable to owners of parent | 6,308 | 5,009 | (20.6)% |
On the balance sheet, total assets stood at ¥99,429 million as of March 31, 2026, up ¥6,067 million, with net assets of ¥80,616 million and an equity ratio of 80.6% (81.6% a year earlier). Cash flows from operating activities were ¥10,651 million, up ¥1,877 million year on year, while cash flows from investing activities were an outflow of ¥4,468 million, giving free cash flow of ¥6,183 million. Cash and cash equivalents at the end of the period were ¥28,389 million.
Segment Results
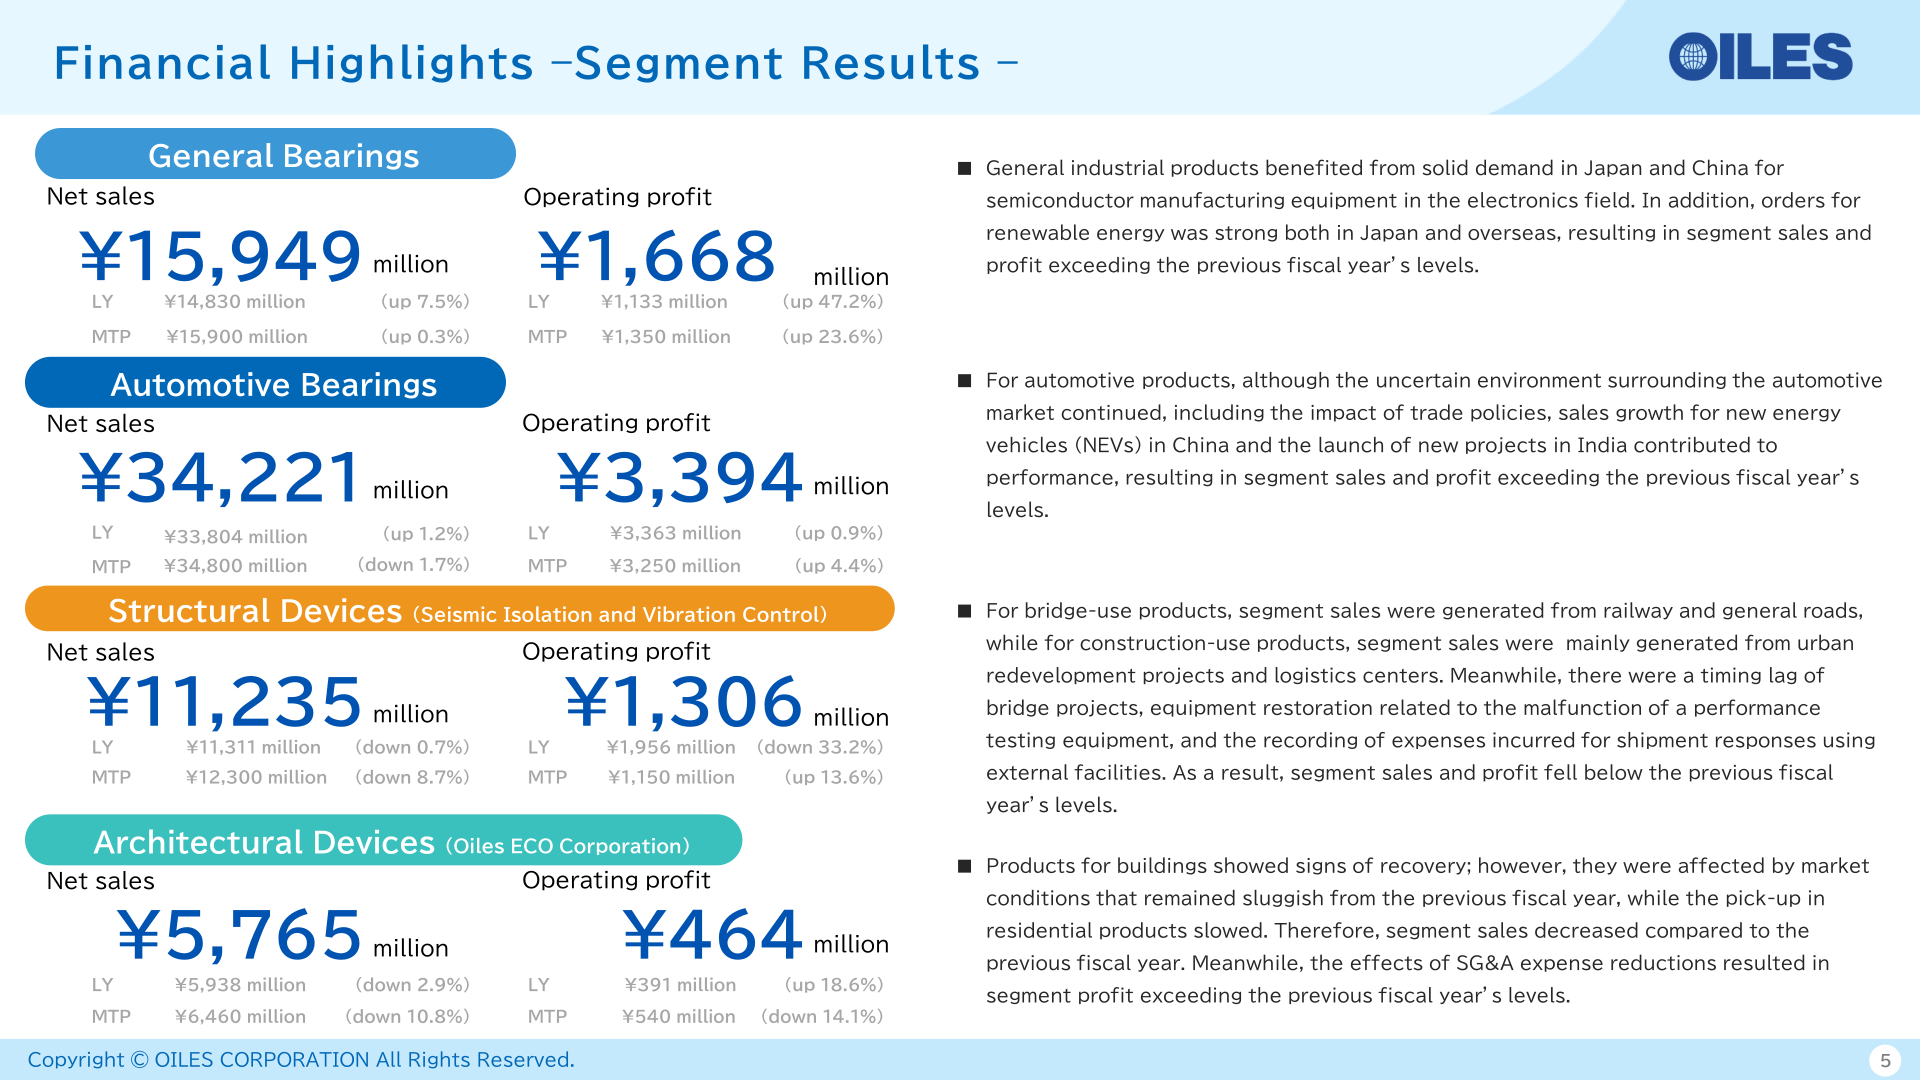
General Bearings sales and profit exceeded the previous fiscal year, as general industrial products benefited from solid demand in Japan and China for semiconductor manufacturing equipment in the electronics field and orders for renewable energy were strong both in Japan and overseas. Automotive Bearings also exceeded the previous fiscal year, with sales growth for new energy vehicles (NEVs) in China and the launch of new projects in India contributing to performance despite the uncertain environment surrounding the automotive market, including the impact of trade policies. Structural Devices sales and profit fell below the previous fiscal year, reflecting a timing lag of bridge projects, equipment restoration related to the malfunction of a performance testing equipment, and expenses incurred for shipment responses using external facilities. In Architectural Devices, segment sales decreased on sluggish market conditions and a slower pick-up in residential products, while the effects of SG&A expense reductions lifted segment profit above the previous fiscal year.
| Segment (Millions of yen) | Net sales FYE Mar. 2026 | Net sales FYE Mar. 2025 (LY) | Operating profit FYE Mar. 2026 | Operating profit FYE Mar. 2025 (LY) |
|---|---|---|---|---|
| General Bearings | ¥15,949 million | ¥14,830 million (up 7.5%) | ¥1,668 million | ¥1,133 million (up 47.2%) |
| Automotive Bearings | ¥34,221 million | ¥33,804 million (up 1.2%) | ¥3,394 million | ¥3,363 million (up 0.9%) |
| Structural Devices (Seismic Isolation and Vibration Control) | ¥11,235 million | ¥11,311 million (down 0.7%) | ¥1,306 million | ¥1,956 million (down 33.2%) |
| Architectural Devices (Oiles ECO Corporation) | ¥5,765 million | ¥5,938 million (down 2.9%) | ¥464 million | ¥391 million (up 18.6%) |
Forecast for the FYE March 2027
For the fiscal year ending March 2027, Oiles forecasts net sales of ¥72,300 million (up 4.8%), operating profit of ¥7,150 million (up 2.8%) and profit attributable to owners of parent of ¥5,050 million (up 0.8%). Against the Medium-Term Management Plan, net sales are ▲3.6% and operating profit is ▲2.7%. The forecast operating profit margin is 9.9% and the ratio of profit attributable to owners of parent is 7.0%. Annual dividends per share are forecast at ¥95 (interim ¥47, year-end ¥48).
| Item | FYE Mar. 2027 (Forecast) | FYE Mar. 2026 (Actual) | YoY |
|---|---|---|---|
| Net sales | 72,300 million yen | 68,964 million yen | Up 4.8% |
| Operating profit | 7,150 million yen | 6,958 million yen | Up 2.8% |
| Ratio of operating profit to net sales | 9.9% | 10.1% | — |
| Profit attributable to owners of parent | 5,050 million yen | 5,009 million yen | Up 0.8% |
| Annual dividends per share | ¥95 | ¥85 | — |
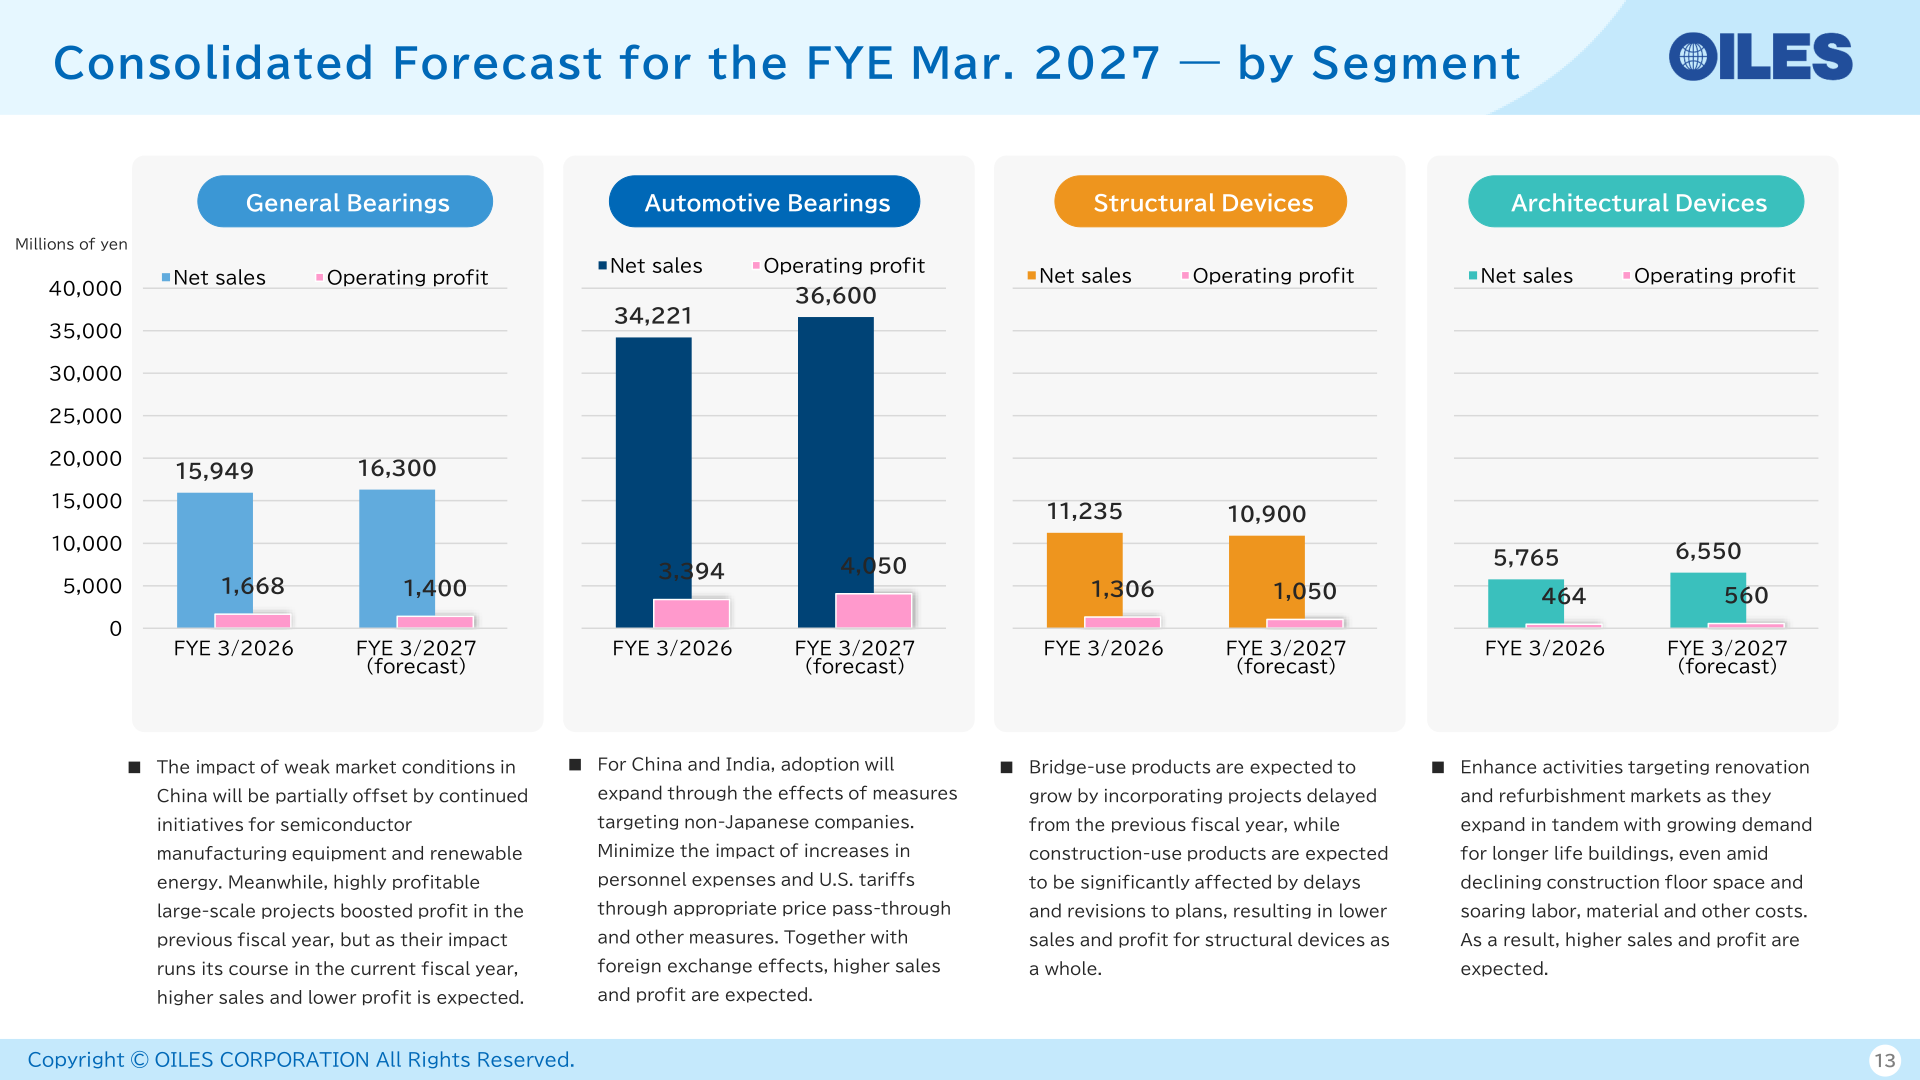
| Segment (Millions of yen) | Net sales FYE 3/2026 | Net sales FYE 3/2027 (forecast) | Operating profit FYE 3/2026 | Operating profit FYE 3/2027 (forecast) |
|---|---|---|---|---|
| General Bearings | 15,949 | 16,300 | 1,668 | 1,400 |
| Automotive Bearings | 34,221 | 36,600 | 3,394 | 4,050 |
| Structural Devices | 11,235 | 10,900 | 1,306 | 1,050 |
| Architectural Devices | 5,765 | 6,550 | 464 | 560 |
By segment, the company expects higher sales and lower profit in General Bearings, as weak market conditions in China are partially offset by continued initiatives for semiconductor manufacturing equipment and renewable energy while the impact of highly profitable large-scale projects that boosted profit in the previous fiscal year runs its course. Automotive Bearings is expected to post higher sales and profit on expanded adoption in China and India, appropriate price pass-through against personnel expense increases and U.S. tariffs, and foreign exchange effects. Structural Devices is expected to see lower sales and profit overall, as bridge-use products grow by incorporating projects delayed from the previous fiscal year while construction-use products are significantly affected by delays and revisions to plans. Architectural Devices is expected to post higher sales and profit through enhanced activities targeting renovation and refurbishment markets.
Shareholder Returns
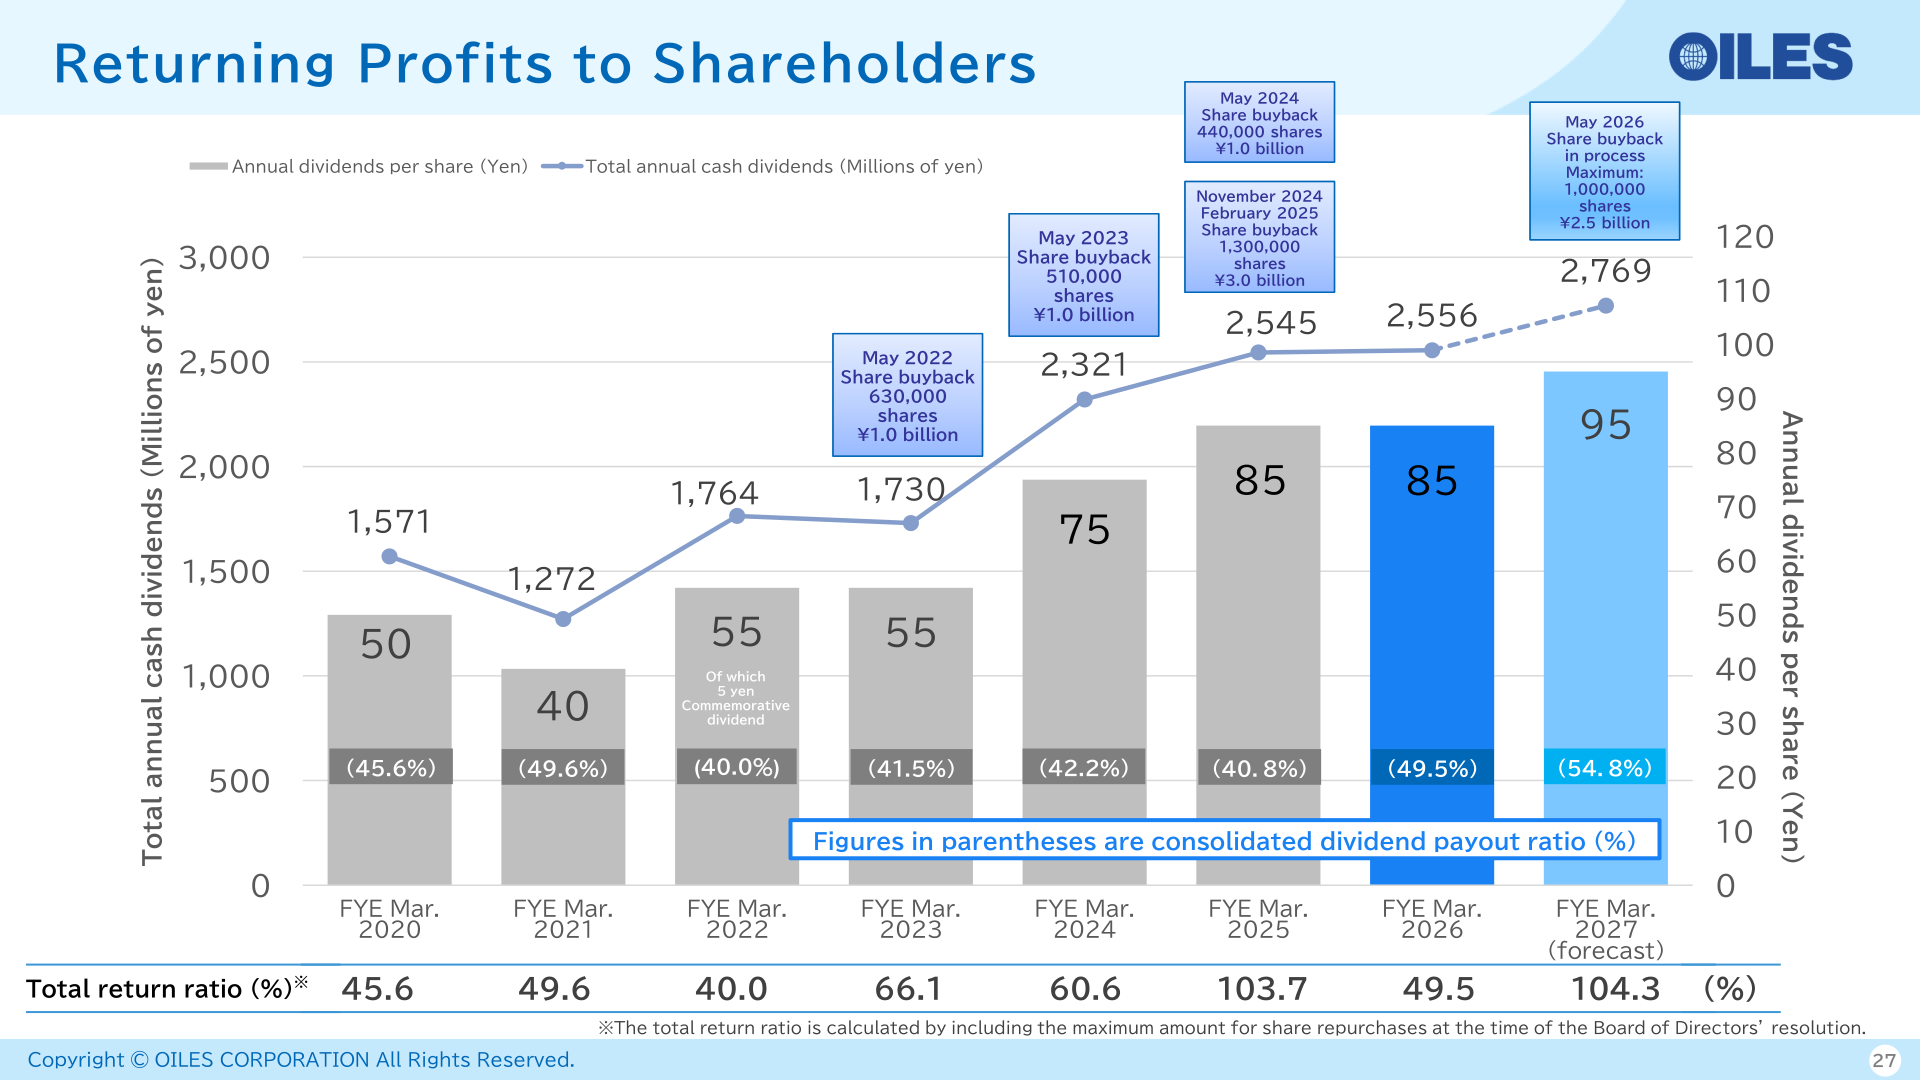
Annual dividends per share for the fiscal year ended March 2026 were ¥85 (interim ¥42, year-end ¥43), unchanged from ¥85 in the previous fiscal year and in line with plan, with a consolidated dividend payout ratio of 49.5%. For the fiscal year ending March 2027 the company forecasts ¥95 per share, a consolidated dividend payout ratio of 54.8% and a total return ratio of 104.3%. A share buyback resolved in May 2026 is in process, with a maximum of 1,000,000 shares and ¥2.5 billion. The presentation notes that the total return ratio is calculated by including the maximum amount for share repurchases at the time of the Board of Directors’ resolution.
| Item | FYE Mar. 2025 | FYE Mar. 2026 | FYE Mar. 2027 (forecast) |
|---|---|---|---|
| Annual dividends per share (Yen) | 85 | 85 | 95 |
| Total annual cash dividends (Millions of yen) | 2,545 | 2,556 | 2,769 |
| Consolidated dividend payout ratio | 40.8% | 49.5% | 54.8% |
| Total return ratio | 103.7% | 49.5% | 104.3% |
Medium-Term Management Plan and Capital Policy
Under the Medium-Term Management Plan 2024–2026, the quantitative indicators are net sales of ¥67.7 billion in FY2024, ¥71.2 billion in FY2025 and ¥75.0 billion in FY2026, with operating profit of ¥5.7 billion, ¥6.35 billion and ¥7.35 billion respectively, and ROE of 8.0% or more in FY2026. Achievements were net sales of ¥67.6 billion in FY2024, ¥68.9 billion in FY2025 and a forecast of ¥72.3 billion in FY2026, with operating profit of ¥6.94 billion, ¥6.95 billion and a forecast of ¥7.15 billion (core earnings, defined as operating profit plus depreciation, of ¥10.41 billion, ¥10.39 billion and ¥10.85 billion). ROE was 8.4% in FY2024 and 6.4% in FY2025. The management goals of the OILES 2030 VISION are a ratio of operating profit to net sales of 15% or more and ROE of 10% or more.
In its disclosure on action to implement management that is conscious of the cost of capital and the stock price, the company cites annual dividends of ¥85 in FY2024, ¥85 in FY2025 and a forecast of ¥95 in FY2026, share buybacks of ¥3.4 billion in FY2024, ¥0.6 billion in FY2025 and a plan of ¥2.5 billion for FY2026, and an expected FY2024–FY2026 total payout ratio of 88% based on the May disclosure. The total market value of strategically held listed shares at the end of March 2026 was down 6.6% year on year. The three-year cash flow estimate for 2024–2026 comprises accumulated profit of approximately ¥16.4 billion and depreciation of approximately ¥10.6 billion as inflows, against capital investment of approximately ¥18.3 billion and returning profits to shareholders of approximately ¥14.4 billion as outflows.
This article is an analysis based on publicly available information and is not a recommendation to buy or sell any specific securities. Investment decisions are your own responsibility.
![[Obayashi] Investors’ Guide 2026 — The Complete 24-Article Breakdown](https://japan-equity.com/wp-content/uploads/2026/07/hub_cover-1024x1024.png)
![[Obayashi] IR & SR Policy — Feeding Dialogue Back into Management](https://japan-equity.com/wp-content/uploads/2026/07/p32_sq-1024x1024.jpg)
![[Obayashi] Real Estate Development — 18.7% Margin, ¥287.7bn Unrealized Gains](https://japan-equity.com/wp-content/uploads/2026/07/p20_sq-1024x1024.jpg)
![[Obayashi] Domestic Civil Engineering — Resilience Spending Supports 9.6% Margin](https://japan-equity.com/wp-content/uploads/2026/07/p11_sq-1024x1024.jpg)
![[Obayashi] Share Price & External Ratings — vs TOPIX, ESG Index Inclusion](https://japan-equity.com/wp-content/uploads/2026/07/p40_sq-1024x1024.jpg)
![[Construction] ¥75.5tn Investment, Shrinking Workforce — Big-5 Market Share](https://japan-equity.com/wp-content/uploads/2026/07/p12_sq-1024x1024.jpg)



![[Obayashi] Capital Policy & Shareholder Returns — ROE 10%+, DOE ~5%, ¥100bn Buyback](https://japan-equity.com/wp-content/uploads/2026/07/p27_sq-1024x1024.jpg)
![[Obayashi] Reducing Cross-Shareholdings — ¥285.2bn Sold in Five Years](https://japan-equity.com/wp-content/uploads/2026/07/p29_sq-1024x1024.jpg)
![[Obayashi] ¥750bn Investment Plan — ¥300bn to Development, ¥190bn to Tech/DX](https://japan-equity.com/wp-content/uploads/2026/07/p30_sq-1024x1024.jpg)
![[Obayashi] MTP2022 KPIs — Operating Profit ~2x Target, ROE 14.4%](https://japan-equity.com/wp-content/uploads/2026/07/p25_sq-1024x1024.jpg)
![[Obayashi] Cash Allocation — ¥420bn Investment CF Over Five Years](https://japan-equity.com/wp-content/uploads/2026/07/p26_sq-1024x1024.jpg)
![[Obayashi] Green Energy — 44 Plants, 344MW, and the Green Hydrogen Challenge](https://japan-equity.com/wp-content/uploads/2026/07/p21_sq-1024x1024.jpg)
![[Obayashi] Tackling the Labor Shortage — Robotics Construction®](https://japan-equity.com/wp-content/uploads/2026/07/p14_sq-1024x1024.jpg)
