
This article is based on publicly available IR materials and is not a recommendation to buy or sell any specific securities.
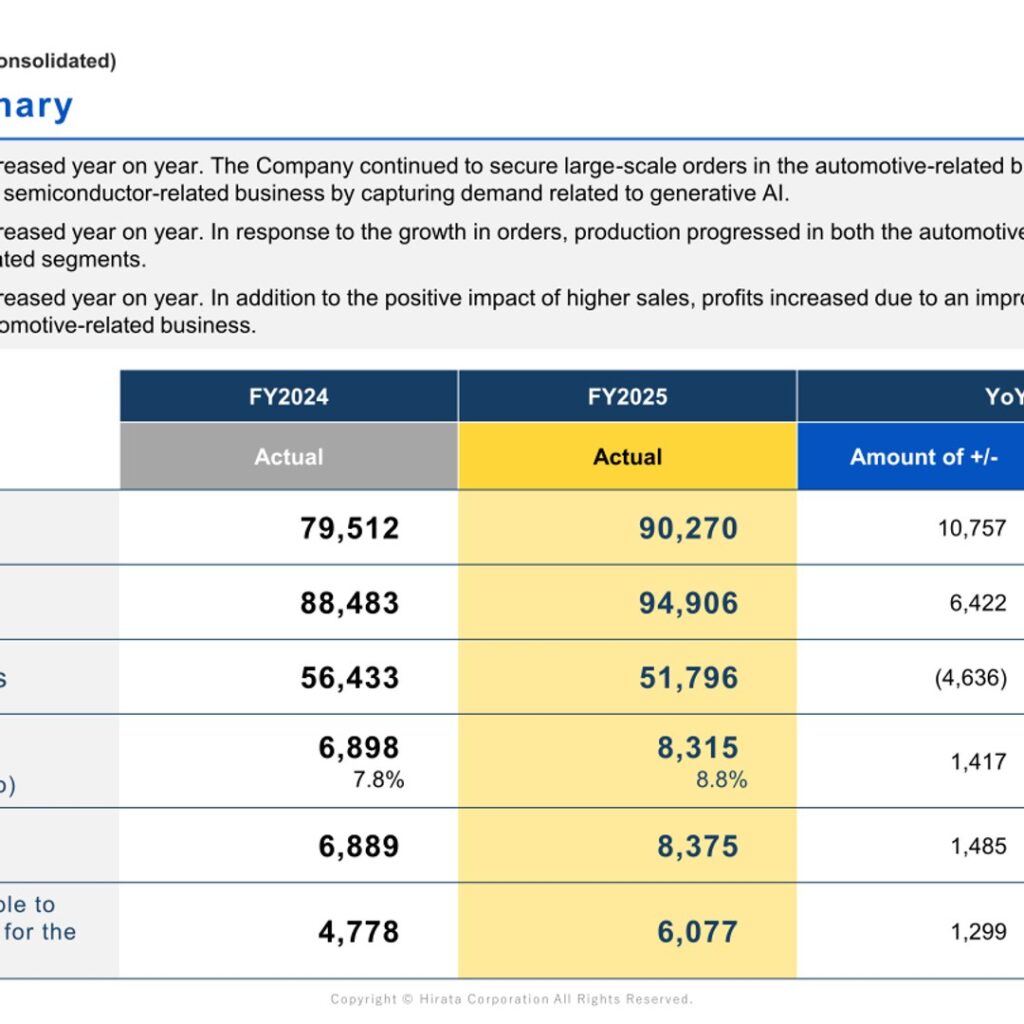
Hirata Corporation, a Kumamoto-based maker of production systems, industrial robots and logistics equipment, reported higher orders, sales and profits for FY2025. The materials state that FY2025 represents the fiscal year ended March 31, 2026, and FY2026 the fiscal year ending March 31, 2027. Orders received rose 13.5% year on year to ¥90,270 million, net sales rose 7.3% to ¥94,906 million, and operating profit rose 20.5% to ¥8,315 million. For FY2026 the company forecasts net sales of ¥100.0 billion and operating profit of ¥9.0 billion.
Consolidated Results (Full-Year Actual)
The company attributes the increase in orders received to continued large-scale orders in the automotive-related business, together with growth in the semiconductor-related business from demand related to generative AI. Sales increased as production progressed in both the automotive-related and semiconductor-related segments. Operating profit increased on the positive impact of higher sales and an improved cost ratio in the automotive-related business. The consolidated cost ratio improved from 78.6% to 78.1%, while SG&A expenses rose on increased personnel costs from wage hikes and headcount growth.
| Item (¥ million) | FY2024 Actual | FY2025 Actual | Amount of +/- | Change (%) |
|---|---|---|---|---|
| Order Received | 79,512 | 90,270 | 10,757 | 13.5% |
| Net Sales | 88,483 | 94,906 | 6,422 | 7.3% |
| Backlog of Orders | 56,433 | 51,796 | (4,636) | (8.2%) |
| Operating Profit | 6,898 | 8,315 | 1,417 | 20.5% |
| (Operating profit ratio) | 7.8% | 8.8% | – | – |
| Ordinary Profit | 6,889 | 8,375 | 1,485 | 21.6% |
| Net income attributable to owners of the parent for the interim period | 4,778 | 6,077 | 1,299 | 27.2% |
Segment Results
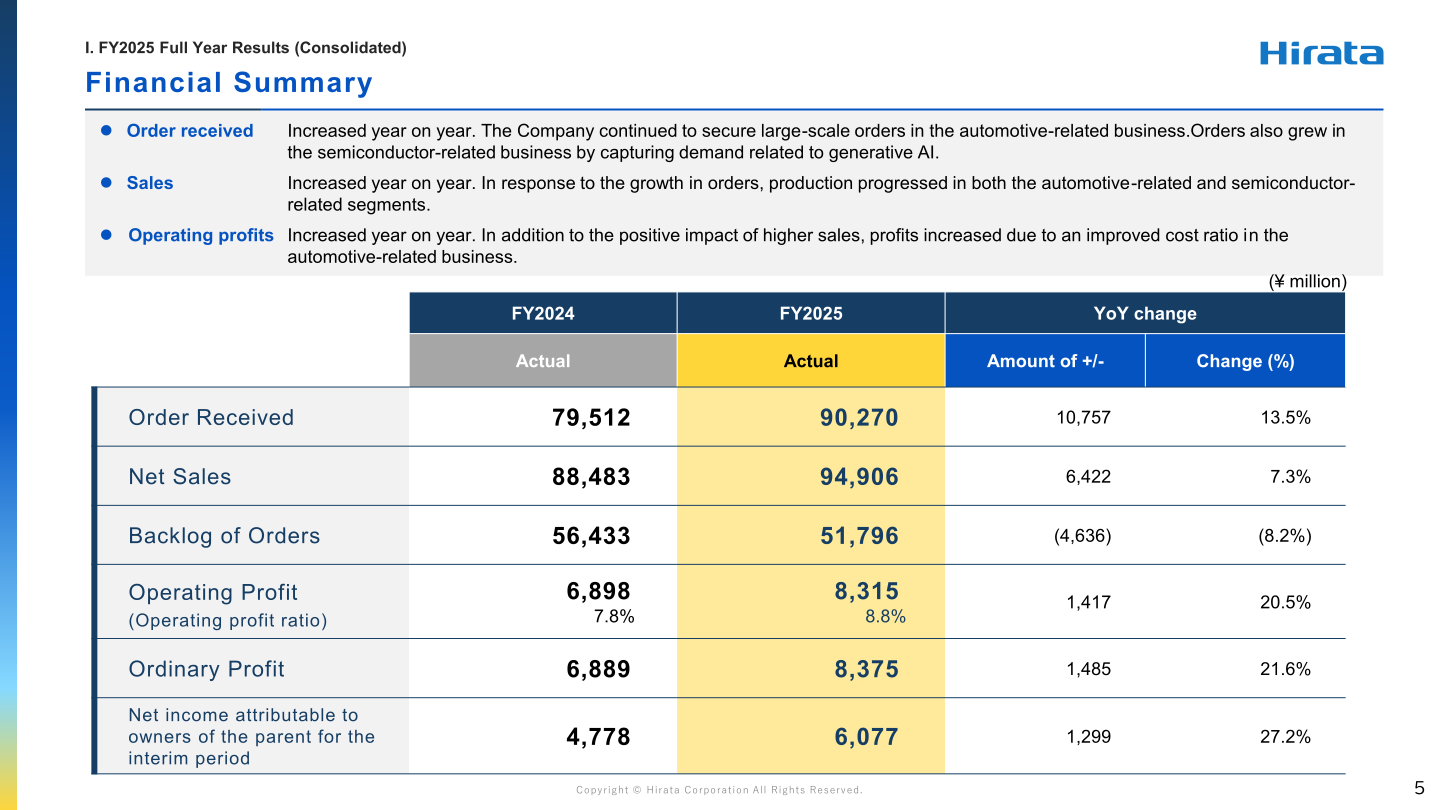
Hirata reports four categories: automotive, semiconductor, other automatic labor-saving equipment, and other. Inter-segment transaction eliminations are included in “Other.” Automotive orders received increased 24.1% to ¥42,341 million, driven by growth in North American ICE-related and HV projects; within automotive orders, EV (inc./HV) fell to ¥16,218 million (38.3% composition) while ICE etc. rose to ¥26,123 million (61.7%). Automotive net sales were on par with the previous fiscal year at ¥43,478 million, and the segment operating profit ratio improved to 11.8% from 9.7%. Semiconductor orders received rose 16.9% to ¥34,762 million on generative AI-related demand, particularly from foundry customers, and net sales rose 19.6% to ¥36,106 million, of which wafer transfer accounted for ¥25,909 million (71.8%). Semiconductor operating profit declined 15.4% to ¥2,418 million, with the operating profit ratio falling to 6.7% from 9.5%, as rising material costs and delayed price pass-through worsened the cost ratio. In other automatic labor-saving equipment, orders received fell 24.1% on a decline in OLED-related projects, while operating profit turned to ¥669 million from a loss of ¥(101) million on the elimination of loss-making projects and higher sales of high-margin OLED-related products.
| Metric | Segment | FY2024 | FY2025 | Amount of +/- | Change (%) |
|---|---|---|---|---|---|
| Order Received | Total | 79,512 | 90,270 | 10,757 | 13.5% |
| Order Received | Automotive | 34,111 | 42,341 | 8,230 | 24.1% |
| Order Received | Semiconductor | 29,730 | 34,762 | 5,032 | 16.9% |
| Order Received | Other Automatic Labor-saving equipment | 13,351 | 10,131 | (3,219) | (24.1%) |
| Order Received | Other | 2,319 | 3,034 | 714 | 30.8% |
| Net Sales | Total | 88,483 | 94,906 | 6,422 | 7.3% |
| Net Sales | Automotive | 43,059 | 43,478 | 419 | 1.0% |
| Net Sales | Semiconductor | 30,186 | 36,106 | 5,919 | 19.6% |
| Net Sales | Other Automatic Labor-saving equipment | 13,096 | 12,572 | (524) | (4.0%) |
| Net Sales | Other | 2,141 | 2,749 | 608 | 28.4% |
| Backlog of Orders | Total | 56,433 | 51,796 | (4,636) | (8.2%) |
| Backlog of Orders | Automotive | 30,202 | 29,065 | (1,136) | (3.8%) |
| Backlog of Orders | Semiconductor | 19,013 | 17,670 | (1,343) | (7.1%) |
| Backlog of Orders | Other Automatic Labor-saving equipment | 6,549 | 4,109 | (2,440) | (37.3%) |
| Backlog of Orders | Other | 667 | 951 | 284 | 42.6% |
| Operating Profit | Total | 6,898 | 8,315 | 1,417 | 20.5% |
| Operating Profit | Automotive | 4,194 | 5,142 | 948 | 22.6% |
| Operating Profit | Semiconductor | 2,857 | 2,418 | (438) | (15.4%) |
| Operating Profit | Other Automatic Labor-saving equipment | (101) | 669 | 771 | - |
| Operating Profit | Other | (52) | 84 | 136 | - |
FY2026 Forecast
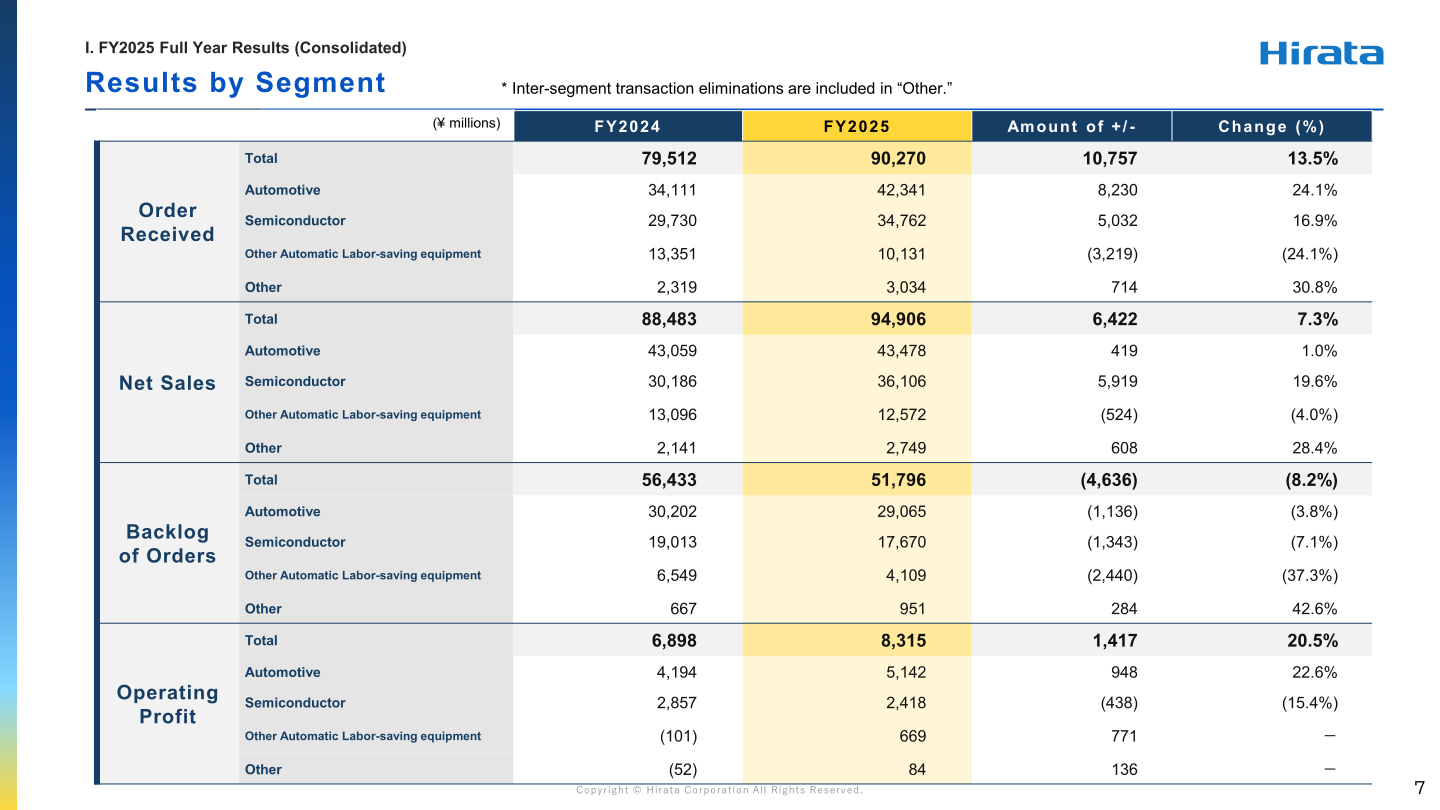
For FY2026 (year ending March 2027), the company forecasts net sales of ¥100.0 billion and operating profit of ¥9.0 billion, representing increases in both sales and profit. The materials describe the net sales figure as marking a record high for the second consecutive fiscal year. Automotive-related sales are expected to decline by ¥6.4 billion to ¥37 billion due to the loss of initially planned EV-related projects, with the company maintaining its mid-term strategy of prioritizing profitability over top-line growth. Semiconductor-related sales are expected to increase by ¥9.8 billion to ¥46 billion as production capacity is strengthened to capture expanding demand driven by generative AI and as unit price increases from price pass-through contribute fully from FY2026. Other automated labor-saving equipment is expected to rise by ¥1.4 billion to ¥14 billion on large-scale logistics-related projects. The cost ratio is assumed to improve from 78.1% to 77.2%.
| Item (¥ million) | FY2025 Actual | FY2026 Full year forecast | Amount of +/- | Change (%) |
|---|---|---|---|---|
| Net sales | 94,906 | 100,000 | 5,093 | 5.4% |
| automotive-related | 43,478 | 37,000 | (6,478) | (14.9%) |
| Semiconductor-related | 36,106 | 46,000 | 9,893 | 27.4% |
| Other Automatic labor-saving Equipment | 12,572 | 14,000 | 1,427 | 11.4% |
| Others | 2,749 | 3,000 | 250 | 9.1% |
| Operating profit (margin) | 8,315 (8.8%) | 9,000 (9.0%) | 684 | 8.2% |
| Ordinary profit (margin) | 8,375 (8.8%) | 8,900 (8.9%) | 524 | 6.3% |
| Profit attributable to owners of parent (margin) | 6,077 (6.4%) | 6,500 (6.5%) | 422 | 7.0% |
Shareholder Returns
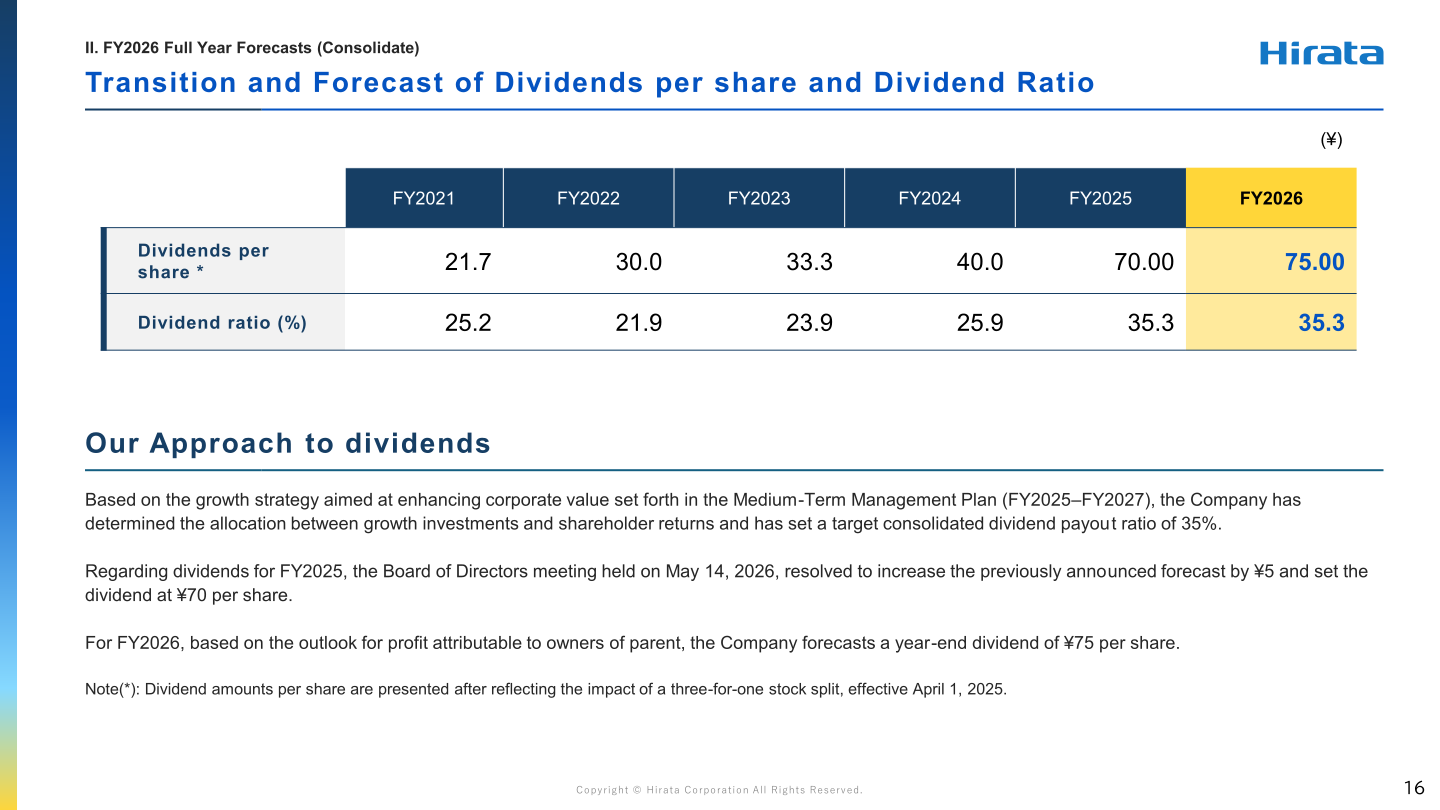
Based on the growth strategy set forth in the Medium-Term Management Plan (FY2025–FY2027), the company has determined the allocation between growth investments and shareholder returns and has set a target consolidated dividend payout ratio of 35%. For FY2025, the Board of Directors meeting held on May 14, 2026 resolved to increase the previously announced forecast by ¥5 and set the dividend at ¥70 per share. For FY2026, based on the outlook for profit attributable to owners of parent, the company forecasts a year-end dividend of ¥75 per share. The materials note that dividend amounts per share are presented after reflecting the impact of a three-for-one stock split effective April 1, 2025.
| Item (¥) | FY2021 | FY2022 | FY2023 | FY2024 | FY2025 | FY2026 |
|---|---|---|---|---|---|---|
| Dividends per share * | 21.7 | 30.0 | 33.3 | 40.0 | 70.00 | 75.00 |
| Dividend ratio (%) | 25.2 | 21.9 | 23.9 | 25.9 | 35.3 | 35.3 |
Medium-Term Management Plan
FY2025 was the first year of the three-year Mid-Term Management Plan, and the company states that performance has been generally on track with no changes made to the numerical targets set for the final year. Net sales rose to 94.9bn from 88.4bn, with a FY2026 forecast of 100.0bn against a FY2027 net sales CAGR target of 6-8%; the company states that the CAGR for net sales from FY2024 to FY2026 is 6.3%. Operating profit rose to 8.3bn from 6.8bn, against a FY2027 target of 10bn or more, and the operating profit margin improved to 8.8% from 7.8%. ROE improved to 8.4% from 7.2%, against a FY2027 target of 9.3% or more.
| Item | FY2024 Actual | FY2025 Actual | FY2026 Forecast | FY2027 Target |
|---|---|---|---|---|
| Net sales | 88.4bn | 94.9bn | 100.0bn | – |
| Net sales CAGR | 6.8% | 7.3% | 5.4% | 6-8% |
| Operating profit | 6.8bn | 8.3bn | 9.0bn | 10bn + |
| Operating profit margin | 7.8% | 8.8% | 9.0% | – |
| ROE | 7.2% | 8.4% | – | 9.3% + |
The plan sets out five key strategies. In the semiconductor-related business, the company aims to increase production capacity by 50% and add two overseas production sites; production and sales structures were strengthened with capacity up 20% year on year, and two overseas cleanrooms were completed in China and Malaysia. In the made-to-order business, the target is an operating profit margin of 10% or higher in the automotive-related business and a 20% reduction in CCC; the automotive-related operating profit margin reached 11.8% in FY2025 and CCC shortened by approximately 20% compared with FY2024. To further strengthen the earnings base, the company targets an equity ratio of 45-50% and reported an equity ratio of 58.4% alongside capital expenditures including the acquisition of a new factory. The remaining strategies cover expanding the mass production business and transforming new businesses into business divisions, with a target of sales of ¥5.0 bn or more in each new business field.
Topics
The company established new organizations reporting directly to the President — the Corporate Planning Unit, DX Promotion Unit and Business Development Center — to enable faster decision-making on high-priority initiatives. To strengthen profitability in the semiconductor-related business, initiatives include completing rules for accurate cost identification and pricing, integrating sales functions with centralized customer information, consolidating semiconductor-related operations at the head office factory starting May 2026, upgrading sites in China and Malaysia with new cleanroom construction, and optimizing inventory levels while establishing a company-wide quality management framework. On the balance sheet, total assets stood at ¥131,276 million at FY2025 year-end versus ¥130,278 million a year earlier, with trade receivables down ¥(8,082) million on cash collections, tangible fixed assets up ¥1,571 million on the acquisition of a new factory, and total equity up ¥8,066 million to ¥76,905 million.
This article is an analysis based on publicly available information and is not a recommendation to buy or sell any specific securities. Investment decisions are your own responsibility.
![[Obayashi] Investors’ Guide 2026 — The Complete 24-Article Breakdown](https://japan-equity.com/wp-content/uploads/2026/07/hub_cover-1024x1024.png)
![[Obayashi] IR & SR Policy — Feeding Dialogue Back into Management](https://japan-equity.com/wp-content/uploads/2026/07/p32_sq-1024x1024.jpg)
![[Obayashi] Domestic Civil Engineering — Resilience Spending Supports 9.6% Margin](https://japan-equity.com/wp-content/uploads/2026/07/p11_sq-1024x1024.jpg)
![[Obayashi] Overseas Construction — Orders Reach ¥1.2tn](https://japan-equity.com/wp-content/uploads/2026/07/p15_sq-1024x1024.jpg)
![[Obayashi] Share Price & External Ratings — vs TOPIX, ESG Index Inclusion](https://japan-equity.com/wp-content/uploads/2026/07/p40_sq-1024x1024.jpg)
![[Construction] ¥75.5tn Investment, Shrinking Workforce — Big-5 Market Share](https://japan-equity.com/wp-content/uploads/2026/07/p12_sq-1024x1024.jpg)



![[Obayashi] Capital Policy & Shareholder Returns — ROE 10%+, DOE ~5%, ¥100bn Buyback](https://japan-equity.com/wp-content/uploads/2026/07/p27_sq-1024x1024.jpg)
![[Obayashi] Reducing Cross-Shareholdings — ¥285.2bn Sold in Five Years](https://japan-equity.com/wp-content/uploads/2026/07/p29_sq-1024x1024.jpg)
![[Obayashi] ¥750bn Investment Plan — ¥300bn to Development, ¥190bn to Tech/DX](https://japan-equity.com/wp-content/uploads/2026/07/p30_sq-1024x1024.jpg)
![[Obayashi] MTP2022 KPIs — Operating Profit ~2x Target, ROE 14.4%](https://japan-equity.com/wp-content/uploads/2026/07/p25_sq-1024x1024.jpg)
![[Obayashi] Cash Allocation — ¥420bn Investment CF Over Five Years](https://japan-equity.com/wp-content/uploads/2026/07/p26_sq-1024x1024.jpg)
![[Obayashi] Green Energy — 44 Plants, 344MW, and the Green Hydrogen Challenge](https://japan-equity.com/wp-content/uploads/2026/07/p21_sq-1024x1024.jpg)
![[Obayashi] Tackling the Labor Shortage — Robotics Construction®](https://japan-equity.com/wp-content/uploads/2026/07/p14_sq-1024x1024.jpg)
