
This article is based on publicly available IR materials and is not a recommendation to buy or sell any specific securities.
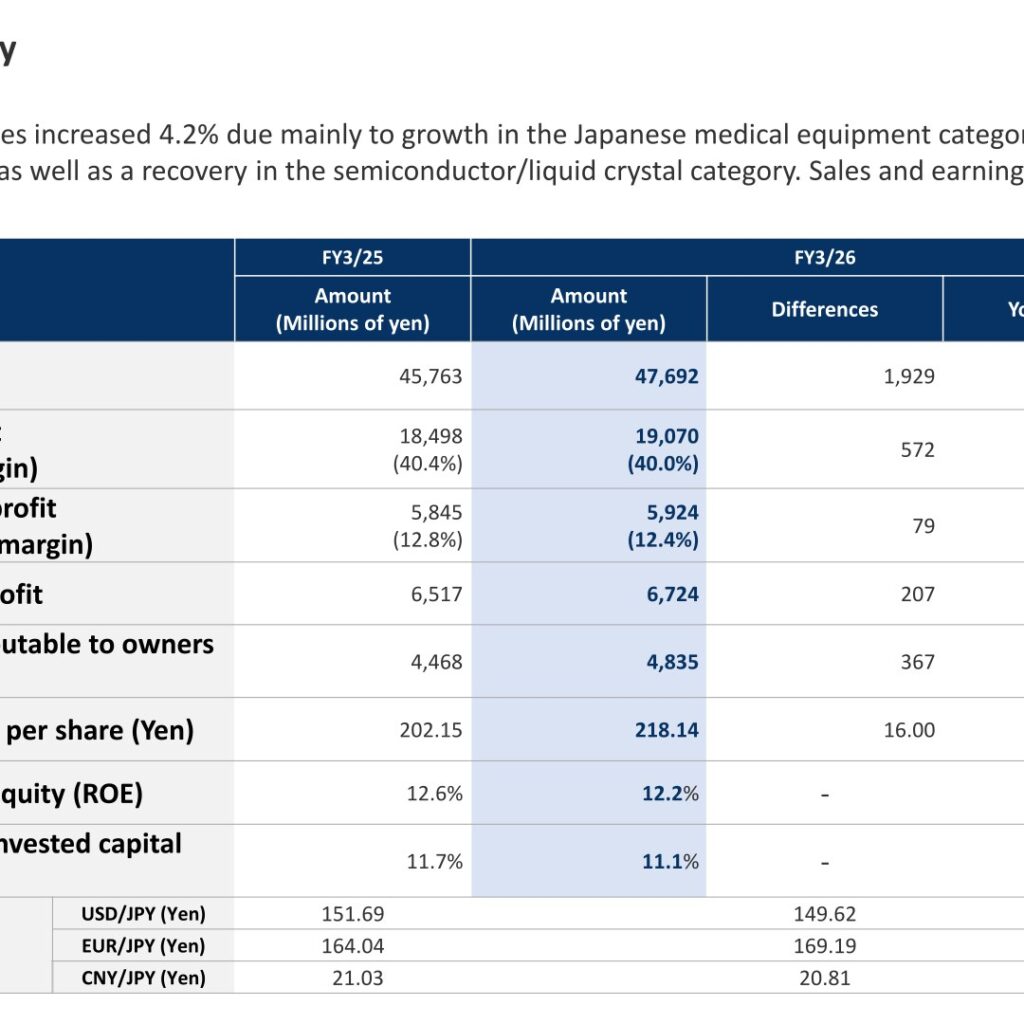
Note: IWAKI’s most recent completed fiscal year ended March 31, 2026, and the company labels it “FY3/26” in its presentation; this article keeps the presentation’s own year labels in the text, tables and segment data, while the site classifies the most recent completed fiscal year as FY2025. IWAKI CO.,LTD. (stock code 6237, trade name Iwaki Pump) is a manufacturer of a broad line of chemical pumps and other fluid control devices. Consolidated net sales for FY3/26 increased 4.2% to 47,692 million yen, and the presentation states that sales and earnings were up with earnings higher at all levels. Growth came mainly from the Japanese medical equipment category and the U.S. water treatment category, as well as a recovery in the semiconductor/liquid crystal category.
Consolidated Results (Full-Year Actual)
Net sales rose 4.2% year on year to 47,692 million yen and operating profit rose 1.4% to 5,924 million yen. Gross profit increased 3.1% to 19,070 million yen although the cost of sales slightly increased due to inventory withdrawals and subsequent production adjustments, and the gross margin edged down to 40.0% from 40.4%. SG&A expenses increased 3.9% in part because of higher R&D expenses. Profit attributable to owners of parent increased 8.2% to 4,835 million yen, which the presentation attributes to equity-method income – which increased primarily because of the strong performance of the semiconductor/liquid crystal category in Taiwan – and to foreign exchange gains.
| Item | FY3/25 (Millions of yen) | FY3/26 (Millions of yen) | Differences | YoY change |
|---|---|---|---|---|
| Net sales | 45,763 | 47,692 | 1,929 | +4.2% |
| Gross profit (Gross margin) | 18,498 (40.4%) | 19,070 (40.0%) | 572 | +3.1% |
| Operating profit (Operating margin) | 5,845 (12.8%) | 5,924 (12.4%) | 79 | +1.4% |
| Ordinary profit | 6,517 | 6,724 | 207 | +3.2% |
| Profit attributable to owners of parent | 4,468 | 4,835 | 367 | +8.2% |
| Net income per share (Yen) | 202.15 | 218.14 | 16.00 | +7.9% |
| Return on equity (ROE) | 12.6% | 12.2% | – | (-0.4pt) |
| Return on invested capital (ROIC) | 11.7% | 11.1% | – | (-0.6pt) |
| Exchange rate (average) USD/JPY (Yen) | 151.69 | 149.62 | – | – |
| Exchange rate (average) EUR/JPY (Yen) | 164.04 | 169.19 | – | – |
| Exchange rate (average) CNY/JPY (Yen) | 21.03 | 20.81 | – | – |
Market Category and Regional Sales
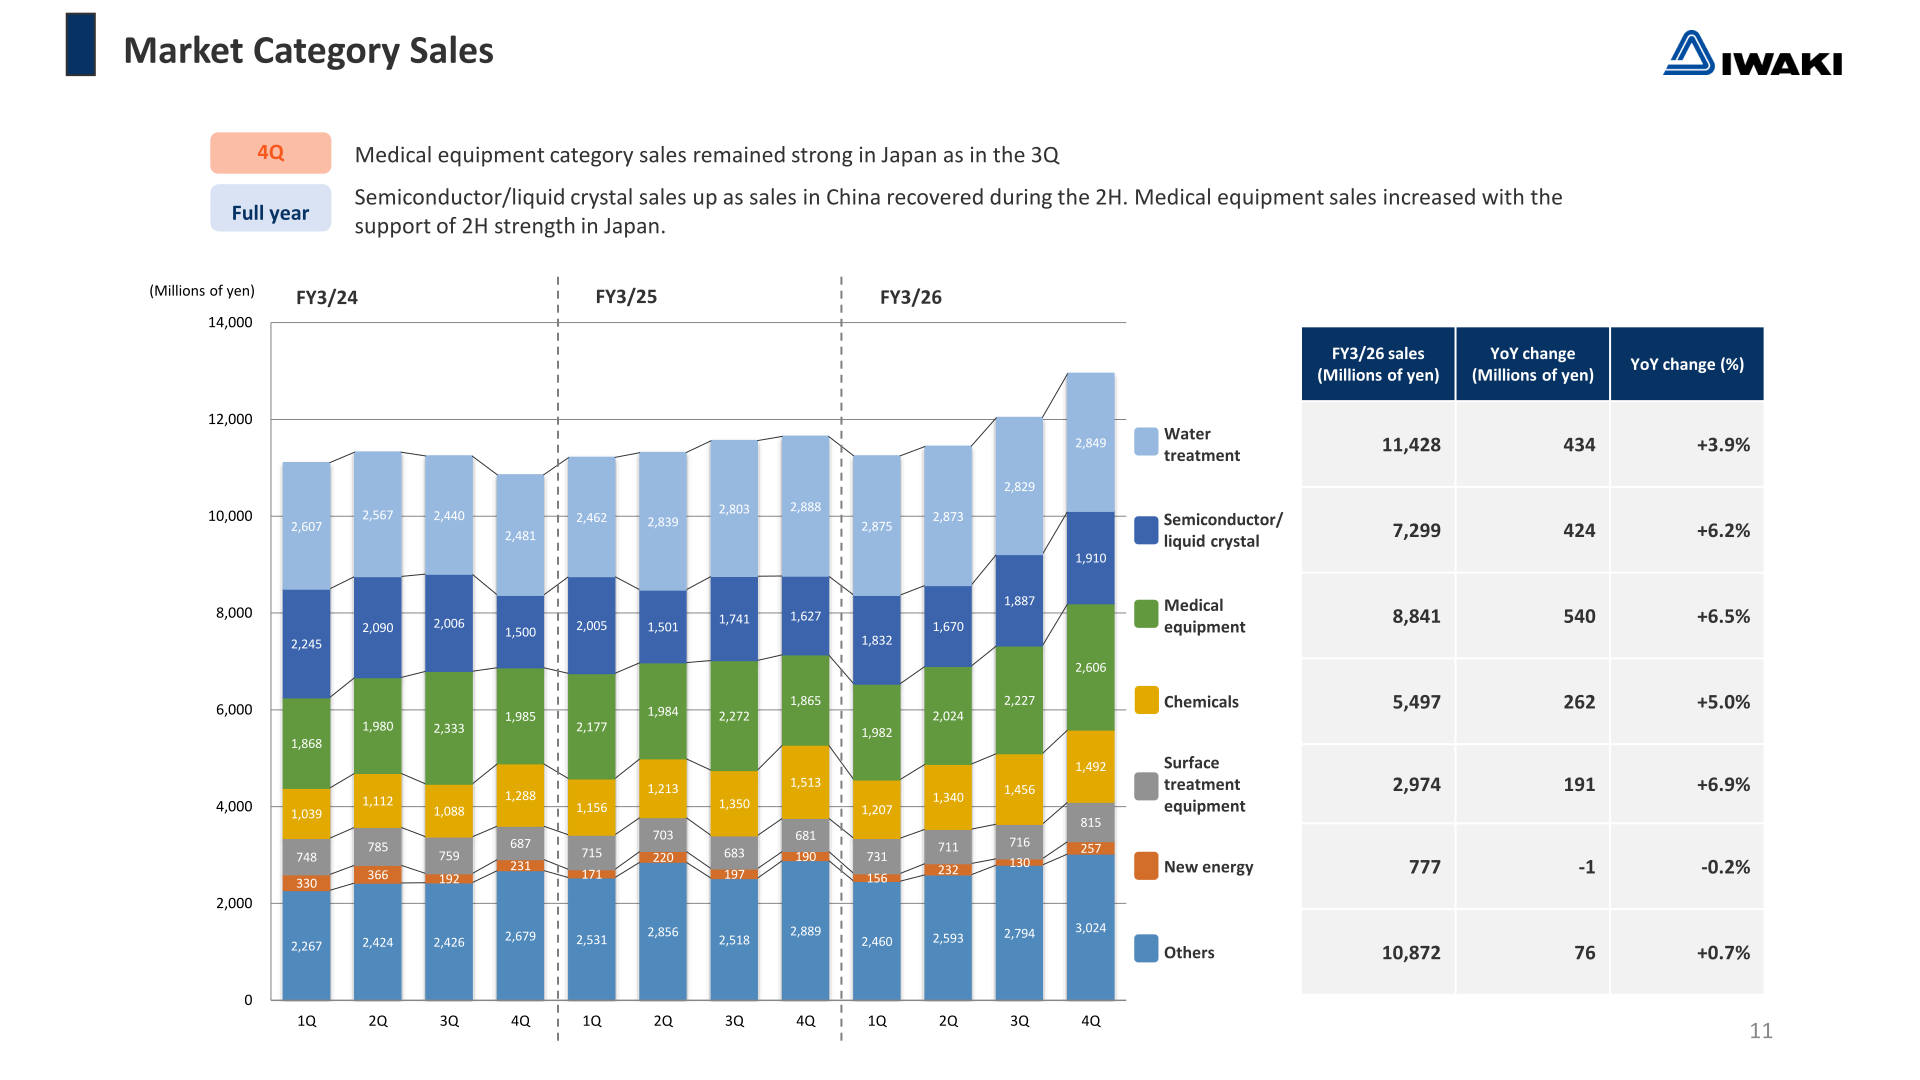
Sales increased by 20.2% year on year in the medical equipment category in Japan and by 7.2% in the water treatment category in the U.S. Performance was strong in the chemicals category, resulting in a 7.7% year-on-year increase for Europe. The presentation states that sales in the Japanese medical equipment category, the U.S. water treatment category and the chemicals category in Europe increased to all-time highs, and that sales of magnetic drive pumps and metering pumps increased to record highs since the company’s listing. Semiconductor/liquid crystal category sales increased by 6.2% as sales began to recover in Taiwan, South Korea and China.
| Market category | FY3/26 sales (Millions of yen) | YoY change (Millions of yen) | YoY change (%) |
|---|---|---|---|
| Water treatment | 11,428 | 434 | +3.9% |
| Semiconductor/liquid crystal | 7,299 | 424 | +6.2% |
| Medical equipment | 8,841 | 540 | +6.5% |
| Chemicals | 5,497 | 262 | +5.0% |
| Surface treatment equipment | 2,974 | 191 | +6.9% |
| New energy | 777 | -1 | -0.2% |
| Others | 10,872 | 76 | +0.7% |
By region, sales in Japan rose 4.0% to 22,568 million yen with the medical equipment category making a big contribution, and U.S. sales rose 8.4% to 7,849 million yen with performance firm primarily in the water treatment category. Overseas sales totalled 25,123 million yen, up 4.4%, for an overseas sales ratio of 52.7%.
| Region | FY3/26 sales (Millions of yen) | YoY change (Millions of yen) | YoY change (%) |
|---|---|---|---|
| Japan | 22,568 | 864 | +4.0% |
| U.S.A | 7,849 | 608 | +8.4% |
| Europe | 6,096 | 74 | +1.2% |
| Asia | 2,872 | 93 | +3.4% |
| China | 5,790 | 170 | +3.0% |
| Others | 2,514 | 116 | +4.9% |
| Overseas total (Overseas sales ratio) | 25,123 (52.7%) | 1,064 | +4.4% |
FY3/27 Forecast
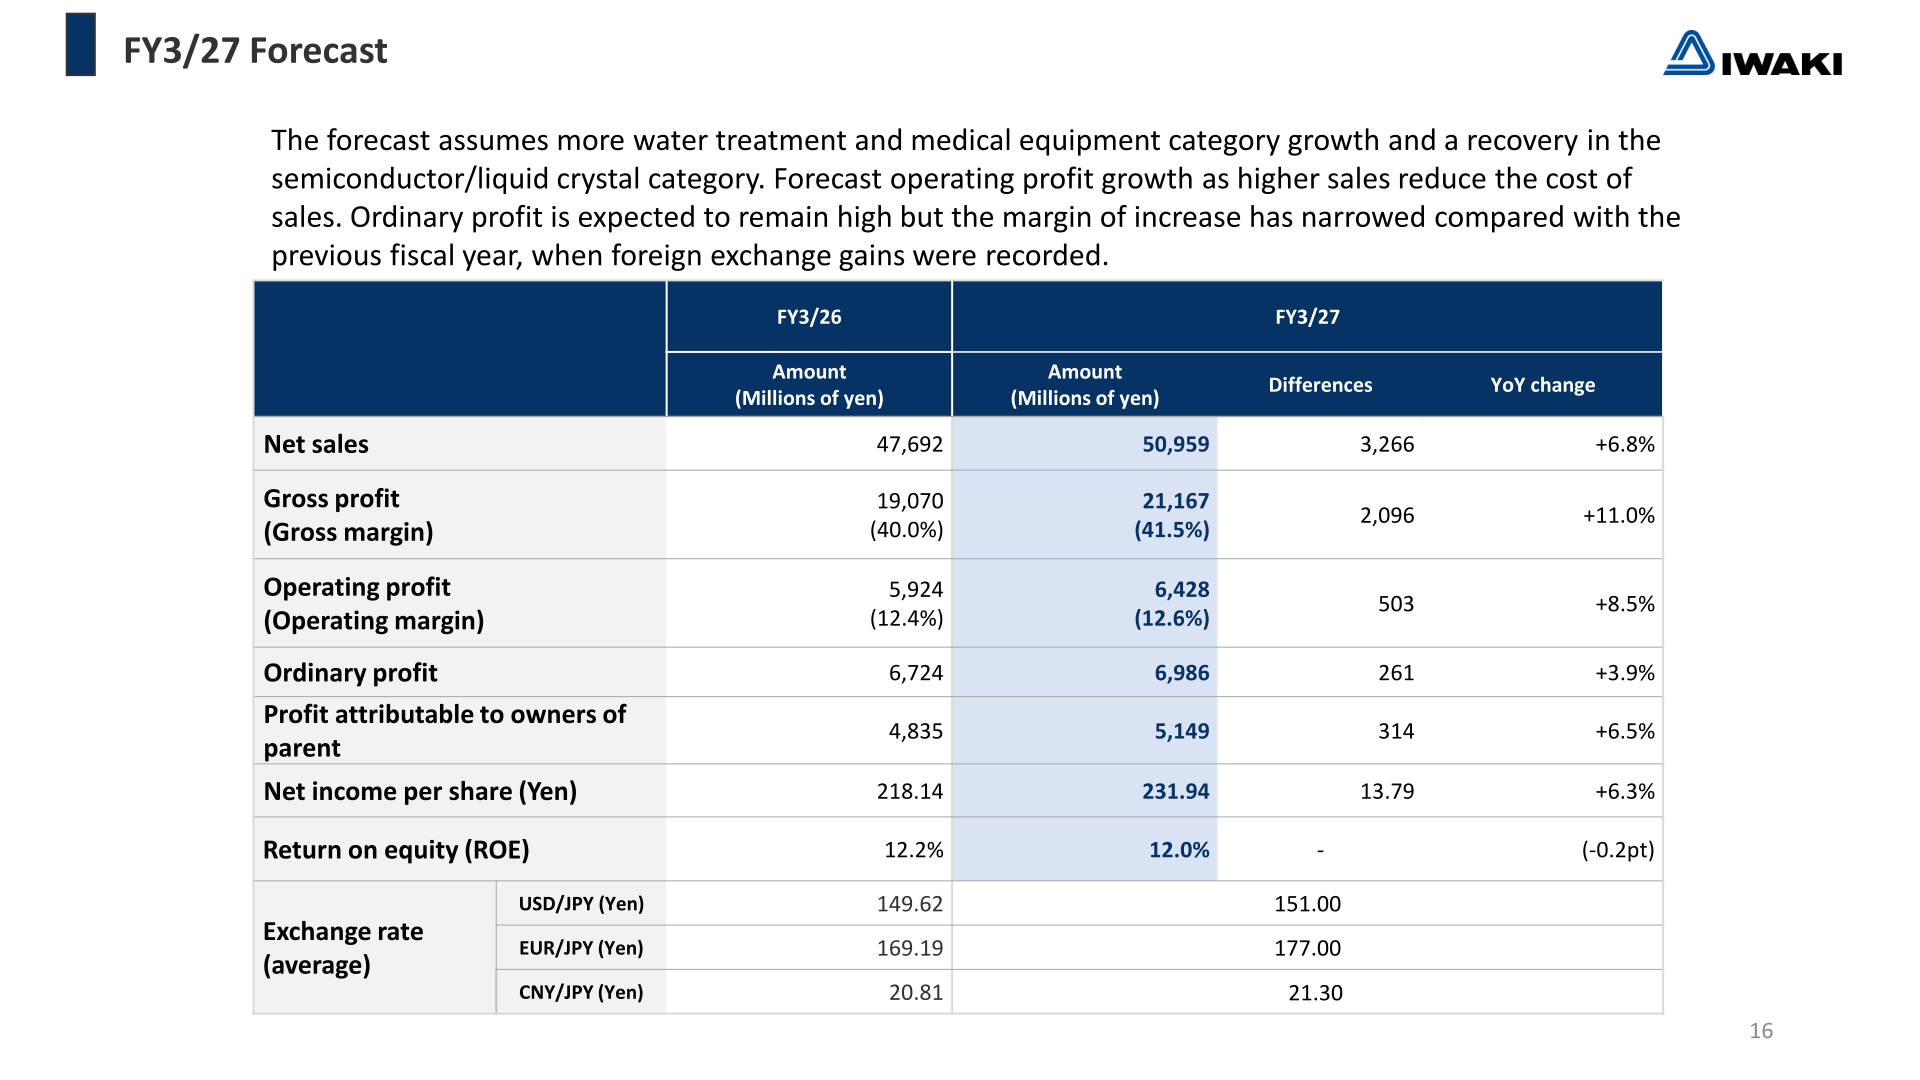
For FY3/27 the company forecasts net sales of 50,959 million yen (+6.8%) and operating profit of 6,428 million yen (+8.5%). The presentation states that the forecast assumes more water treatment and medical equipment category growth and a recovery in the semiconductor/liquid crystal category, with operating profit growth as higher sales reduce the cost of sales. Ordinary profit is expected to remain high but the margin of increase has narrowed compared with the previous fiscal year, when foreign exchange gains were recorded. Assumed average exchange rates are 151.00 yen to the U.S. dollar, 177.00 yen to the euro and 21.30 yen to the Chinese yuan.
| Item | FY3/26 (Millions of yen) | FY3/27 Forecast (Millions of yen) | Differences | YoY change |
|---|---|---|---|---|
| Net sales | 47,692 | 50,959 | 3,266 | +6.8% |
| Gross profit (Gross margin) | 19,070 (40.0%) | 21,167 (41.5%) | 2,096 | +11.0% |
| Operating profit (Operating margin) | 5,924 (12.4%) | 6,428 (12.6%) | 503 | +8.5% |
| Ordinary profit | 6,724 | 6,986 | 261 | +3.9% |
| Profit attributable to owners of parent | 4,835 | 5,149 | 314 | +6.5% |
| Net income per share (Yen) | 218.14 | 231.94 | 13.79 | +6.3% |
| Return on equity (ROE) | 12.2% | 12.0% | – | (-0.2pt) |
By market category, the FY3/27 forecast calls for water treatment sales of 12,230 million yen (+7.9%), medical equipment of 9,528 million yen (+7.8%), chemicals of 5,994 million yen (+9.0%) and semiconductor/liquid crystal of 7,693 million yen (+5.4%). Regarding the effect of exchange rates, the presentation shows that a 1 yen change moves net sales by 75 million yen for the U.S. dollar, 39 million yen for the euro and 301 million yen for the Chinese yuan, and moves operating profit by 20 million yen, 15 million yen and 143 million yen respectively.
Shareholder Returns
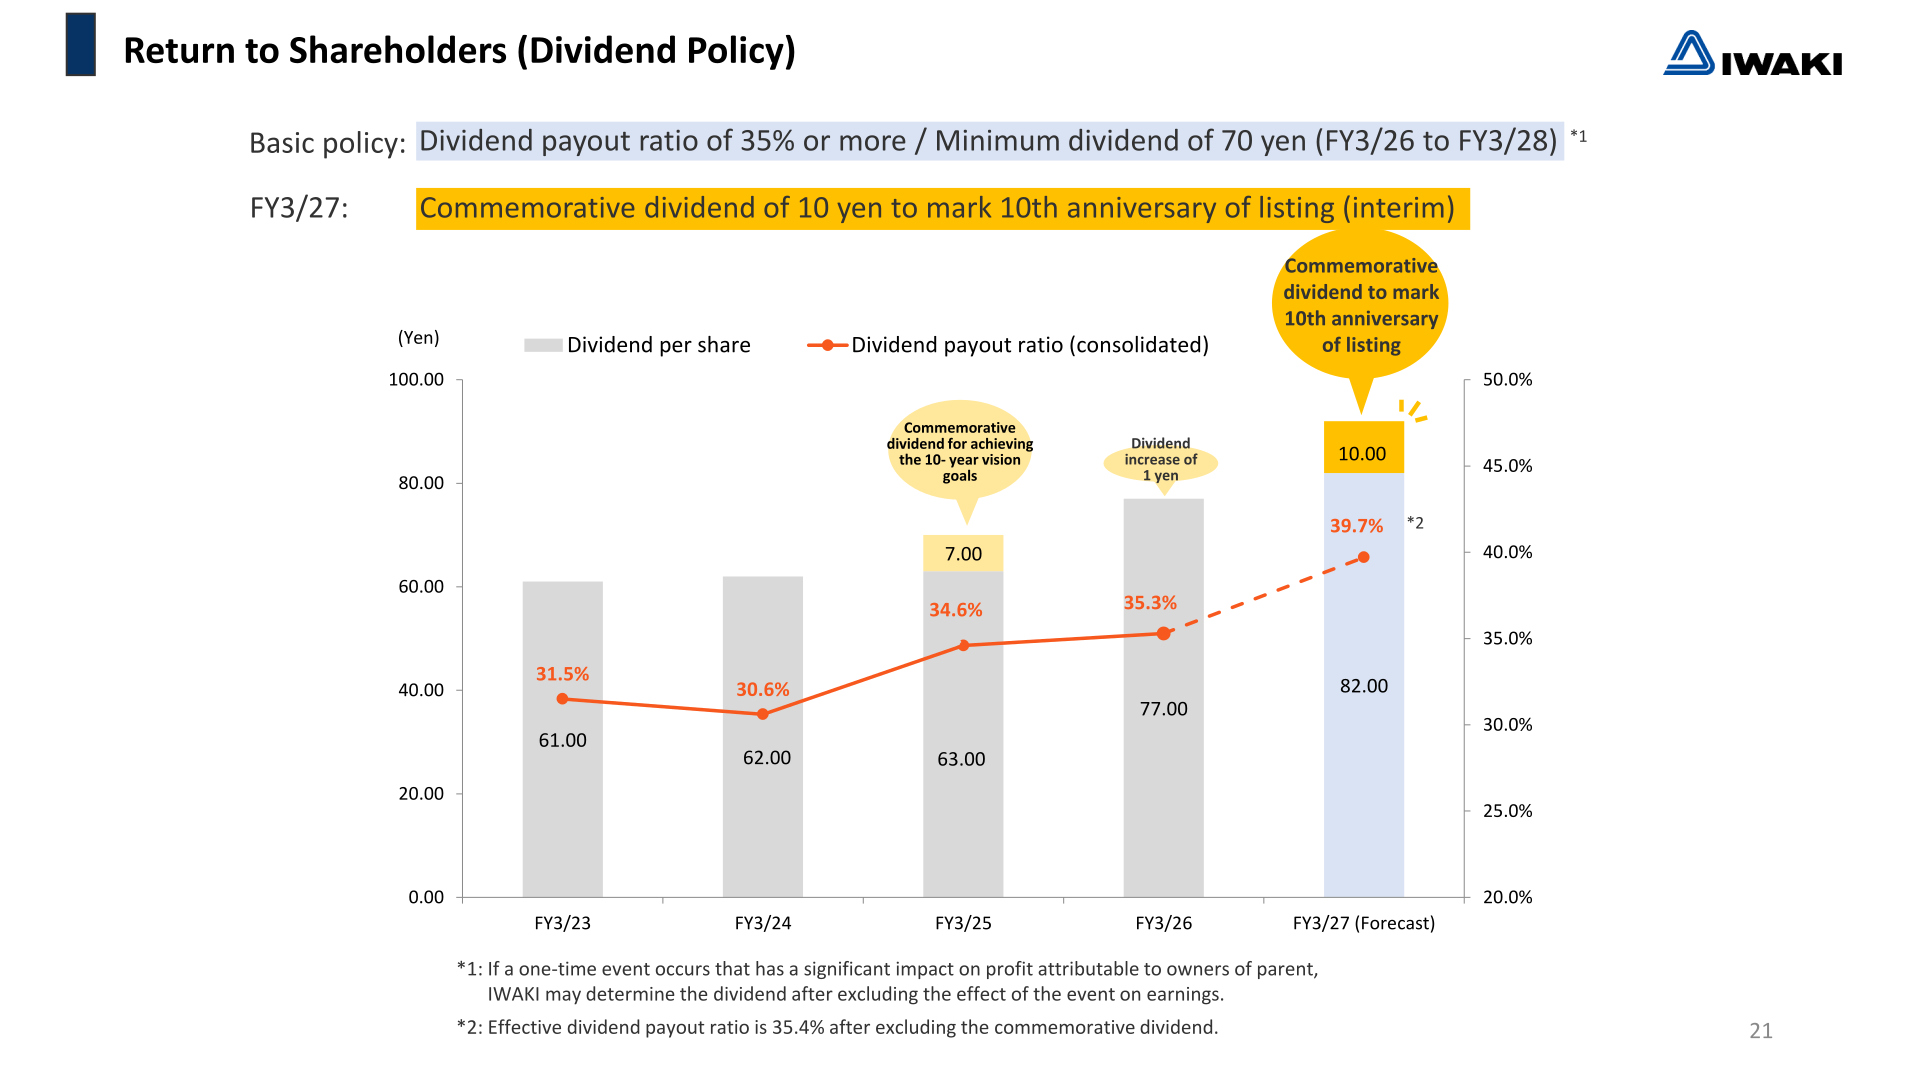
The basic dividend policy is a dividend payout ratio of 35% or more and a minimum dividend of 70 yen for FY3/26 to FY3/28. The presentation notes that if a one-time event occurs that has a significant impact on profit attributable to owners of parent, IWAKI may determine the dividend after excluding the effect of the event on earnings. For FY3/27 the company plans a commemorative dividend of 10 yen to mark the 10th anniversary of listing (interim); the effective dividend payout ratio is 35.4% after excluding the commemorative dividend.
| Fiscal year | Dividend per share (Yen) | Commemorative dividend (Yen) | Dividend payout ratio (consolidated) |
|---|---|---|---|
| FY3/23 | 61.00 | – | 31.5% |
| FY3/24 | 62.00 | – | 30.6% |
| FY3/25 | 63.00 | 7.00 | 34.6% |
| FY3/26 | 77.00 | – | 35.3% |
| FY3/27 (Forecast) | 82.00 | 10.00 | 39.7% |
Medium-Term Management Plan 2027
Under Medium-term Management Plan 2027, the FY3/28 targets are net sales of 53.0 billion yen (Japan 23.5 billion yen, overseas 29.5 billion yen), operating profit of 6.9 billion yen, an operating margin of 13%, ROE maintained at 12%+, and inventory turnover of 150 days. The corresponding FY3/26 results were net sales of 47.6 billion yen (Japan 22.5 billion yen, overseas 25.1 billion yen), operating profit of 5.9 billion yen, an operating margin of 12.4%, ROE of 12.2% and inventory turnover of 164.8 days.
| Financial target | FY3/26 Results | FY3/28 Targets |
|---|---|---|
| Net sales | ¥47.6 billion | ¥53.0 billion |
| Net sales – Japan | ¥22.5 billion | ¥23.5 billion |
| Net sales – Overseas | ¥25.1 billion | ¥29.5 billion |
| Operating profit | ¥5.9 billion | ¥6.9 billion |
| Operating margin | 12.4% | 13% |
| ROE | 12.2% | Maintain 12%+ |
| Inventory turnover | 164.8 days | 150 days |
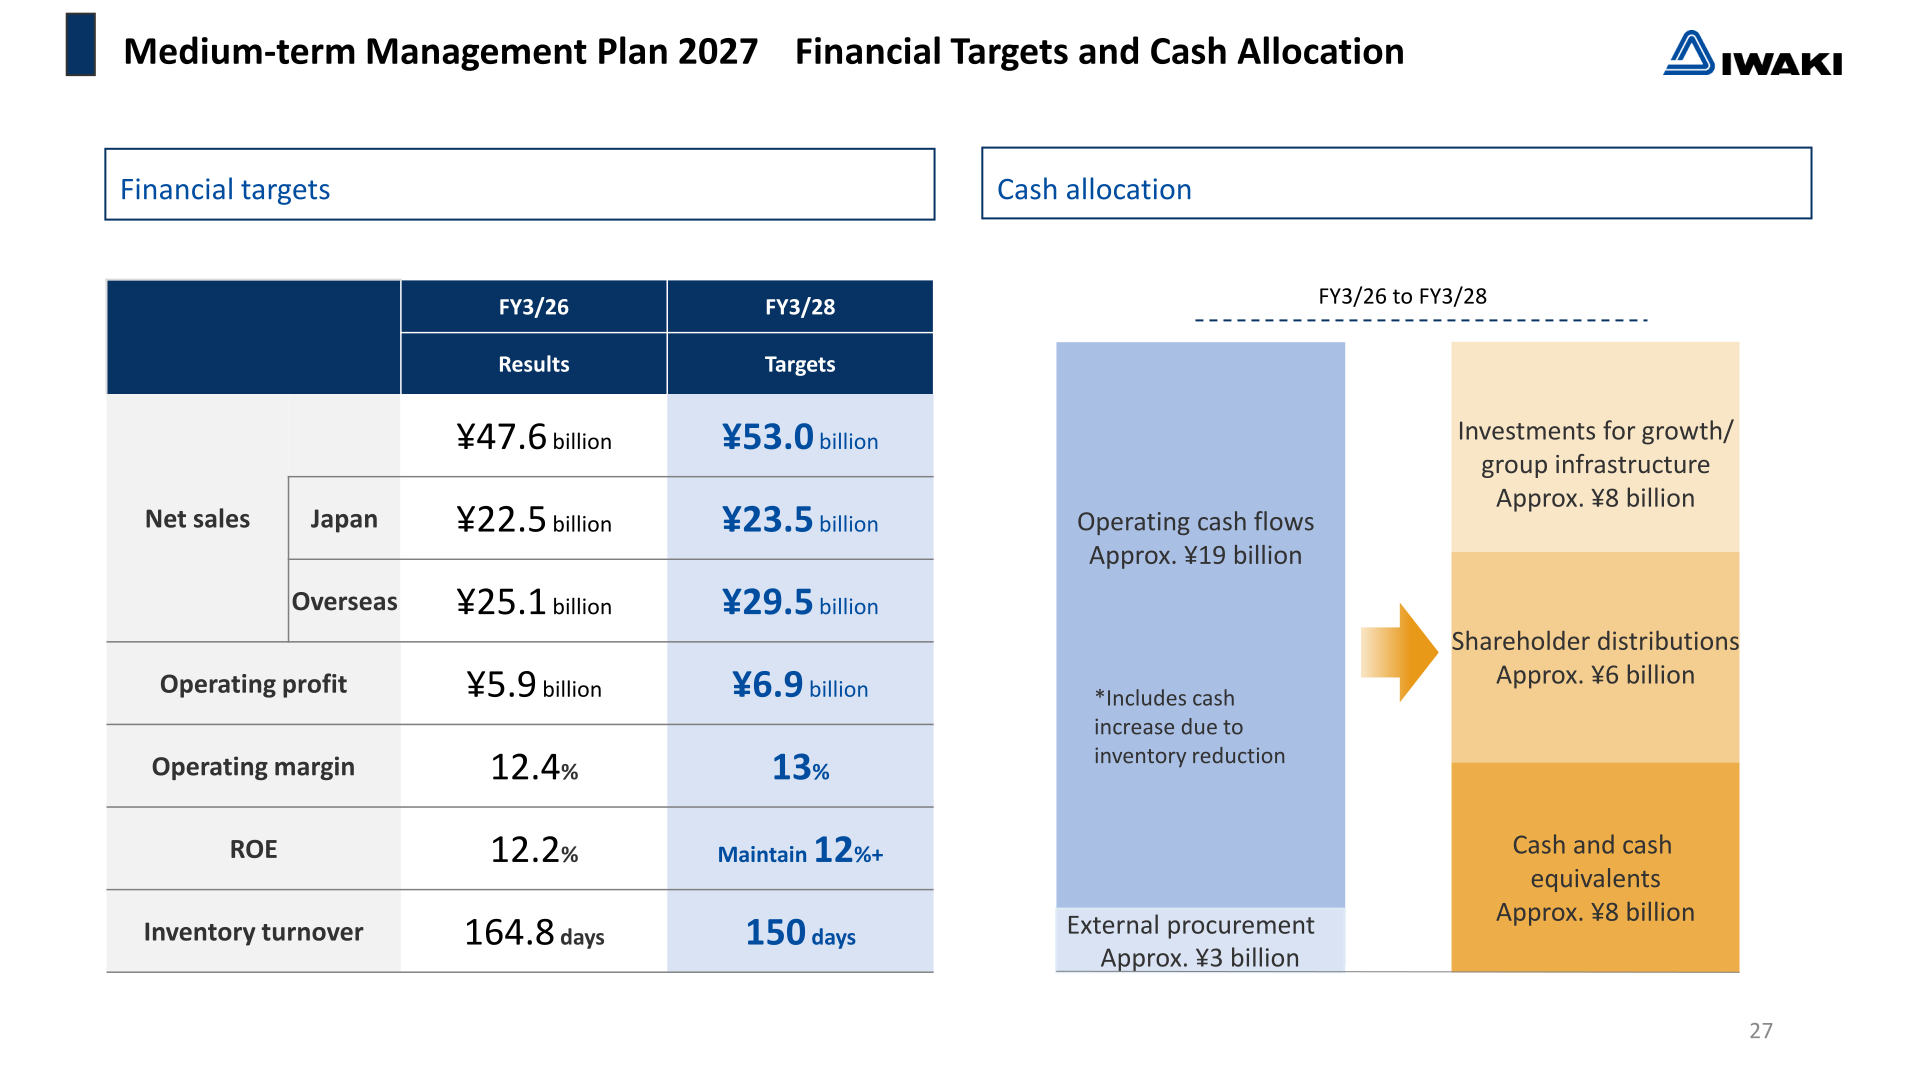
For cash allocation over FY3/26 to FY3/28, the plan shows operating cash flows of approximately 19 billion yen (including a cash increase due to inventory reduction) plus external procurement of approximately 3 billion yen, to be applied to investments for growth and group infrastructure of approximately 8 billion yen, shareholder distributions of approximately 6 billion yen, and cash and cash equivalents of approximately 8 billion yen.
Inventory optimization is positioned as one of the top priorities, with inventory turnover days established as a key performance indicator. Consolidated inventories fell to 12,926 million yen at FY3/26 from 14,473 million yen at FY3/25, and inventory turnover days improved to 164.8 days from 193.8 days, against a FY3/28 target of 150.0 days. The plan’s six priority themes are an even greater role in meeting overseas water treatment market needs; new challenges for hydrogen and other next-generation energy sources; designing and producing global products; increasing procurement on a global scale; using the digital transformation for higher productivity and ease of doing jobs; and an emphasis on ESG management.
This article is an analysis based on publicly available information and is not a recommendation to buy or sell any specific securities. Investment decisions are your own responsibility.
![[Obayashi] Investors’ Guide 2026 — The Complete 24-Article Breakdown](https://japan-equity.com/wp-content/uploads/2026/07/hub_cover-1024x1024.png)
![[Obayashi] IR & SR Policy — Feeding Dialogue Back into Management](https://japan-equity.com/wp-content/uploads/2026/07/p32_sq-1024x1024.jpg)
![[Obayashi] Real Estate Development — 18.7% Margin, ¥287.7bn Unrealized Gains](https://japan-equity.com/wp-content/uploads/2026/07/p20_sq-1024x1024.jpg)
![[Obayashi] Domestic Civil Engineering — Resilience Spending Supports 9.6% Margin](https://japan-equity.com/wp-content/uploads/2026/07/p11_sq-1024x1024.jpg)
![[Obayashi] Share Price & External Ratings — vs TOPIX, ESG Index Inclusion](https://japan-equity.com/wp-content/uploads/2026/07/p40_sq-1024x1024.jpg)
![[Construction] ¥75.5tn Investment, Shrinking Workforce — Big-5 Market Share](https://japan-equity.com/wp-content/uploads/2026/07/p12_sq-1024x1024.jpg)



![[Obayashi] Capital Policy & Shareholder Returns — ROE 10%+, DOE ~5%, ¥100bn Buyback](https://japan-equity.com/wp-content/uploads/2026/07/p27_sq-1024x1024.jpg)
![[Obayashi] Reducing Cross-Shareholdings — ¥285.2bn Sold in Five Years](https://japan-equity.com/wp-content/uploads/2026/07/p29_sq-1024x1024.jpg)
![[Obayashi] ¥750bn Investment Plan — ¥300bn to Development, ¥190bn to Tech/DX](https://japan-equity.com/wp-content/uploads/2026/07/p30_sq-1024x1024.jpg)
![[Obayashi] MTP2022 KPIs — Operating Profit ~2x Target, ROE 14.4%](https://japan-equity.com/wp-content/uploads/2026/07/p25_sq-1024x1024.jpg)
![[Obayashi] Cash Allocation — ¥420bn Investment CF Over Five Years](https://japan-equity.com/wp-content/uploads/2026/07/p26_sq-1024x1024.jpg)
![[Obayashi] Green Energy — 44 Plants, 344MW, and the Green Hydrogen Challenge](https://japan-equity.com/wp-content/uploads/2026/07/p21_sq-1024x1024.jpg)
![[Obayashi] Tackling the Labor Shortage — Robotics Construction®](https://japan-equity.com/wp-content/uploads/2026/07/p14_sq-1024x1024.jpg)
