
This article is based on publicly available IR materials and is not a recommendation to buy or sell any specific securities.
Note: NS TOOL labels the fiscal year ended March 31, 2026 as FY3/26 and the following year as FY3/27; this article follows our site convention of classifying the most recently completed fiscal year as FY2025, while all figures, tables, headers and labels below are kept exactly as presented in the company’s materials.
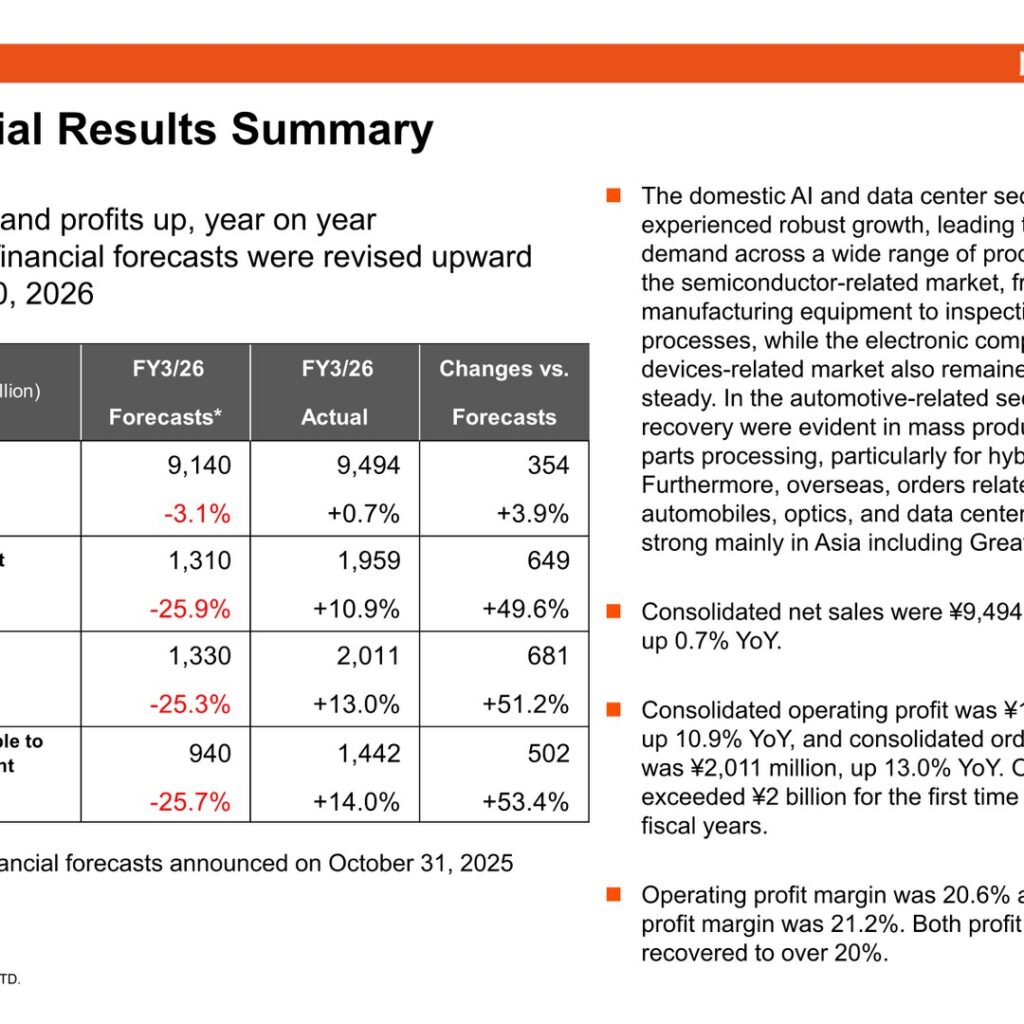
NS TOOL CO., LTD. released its financial results for the fiscal year ended March 31, 2026 (FY3/26) on May 14, 2026. Consolidated net sales were ¥9,494 million, up 0.7% YoY, while consolidated operating profit was ¥1,959 million, up 10.9% YoY, and consolidated ordinary profit was ¥2,011 million, up 13.0% YoY. According to the company, ordinary profit exceeded ¥2 billion for the first time in three fiscal years. Operating profit margin was 20.6% and ordinary profit margin was 21.2%, with both profit margins recovering to over 20%.
Consolidated Results (Full-Year Actual)
The company states that the domestic AI and data center sectors experienced robust growth, leading to strong demand across a wide range of products in the semiconductor-related market, from manufacturing equipment to inspection processes, while the electronic components and devices-related market also remained generally steady. In the automotive-related sector, signs of recovery were evident in mass production and parts processing, particularly for hybrid vehicles. Overseas, orders related to automobiles, optics and data centers were strong mainly in Asia including Greater China.
Gross profit was ¥5,261 million, up 5.6% YoY due to the decrease in cost of sales, and gross profit margin was 55.4%, up 2.6 pp YoY. SG&A expenses increased by 2.7% YoY in line with the rise in personnel expenses, and the SG&A expenses ratio was 34.8%, up 0.7 pp YoY. Capital expenditures were ¥486 million due to renewal of production facilities, while depreciation decreased by 6.1% YoY on lower capital expenditures in the previous fiscal year.
| Item (Unit: ¥ million) | FY3/25 | FY3/26 | YoY Changes |
|---|---|---|---|
| Net Sales | 9,431 | 9,494 | +0.7% |
| Gross profit | 4,983 | 5,261 | +5.6% |
| Gross profit ratio to net sales | 52.8% | 55.4% | |
| SG&A expenses | 3,215 | 3,301 | +2.7% |
| SG&A expenses ratio to net sales | 34.1% | 34.8% | |
| Operating profit | 1,767 | 1,959 | +10.9% |
| Operating profit ratio to net sales | 18.7% | 20.6% | |
| Ordinary profit | 1,779 | 2,011 | +13.0% |
| Ordinary profit ratio to net sales | 18.9% | 21.2% | |
| Profit attributable to owners of parent | 1,264 | 1,442 | +14.0% |
| Ratio to net sales | 13.4% | 15.2% | |
| Capital investment | 111 | 486 | +337.6% |
| Depreciation | 644 | 605 | -6.1% |
| No. of employees (persons) | 358 | 364 | +1.7% |
Full-year financial forecasts were revised upward on April 20, 2026. Against the full-year forecasts announced on October 31, 2025 of net sales of ¥9,140 million, operating profit of ¥1,310 million, ordinary profit of ¥1,330 million and profit attributable to owners of parent of ¥940 million, actual results came in higher by ¥354 million (+3.9%), ¥649 million (+49.6%), ¥681 million (+51.2%) and ¥502 million (+53.4%) respectively.
On the balance sheet, total assets were ¥19,595 million at the end of FY3/26, down 1.7% from the end of the previous fiscal year. Current assets decreased by 2.4% due to a decrease in cash and deposits resulting from the acquisition of treasury shares and the payment of income taxes, and non-current assets decreased by 0.2% as depreciation exceeded new capital expenditures. Total liabilities increased by 14.3% due to increases in accounts payable-other and income taxes payable, while net assets decreased by 3.1% mainly due to the acquisition of treasury shares. The equity-to-asset ratio was 90.1%, down 1.3 pp from the end of the previous fiscal year.
Net Sales by Product
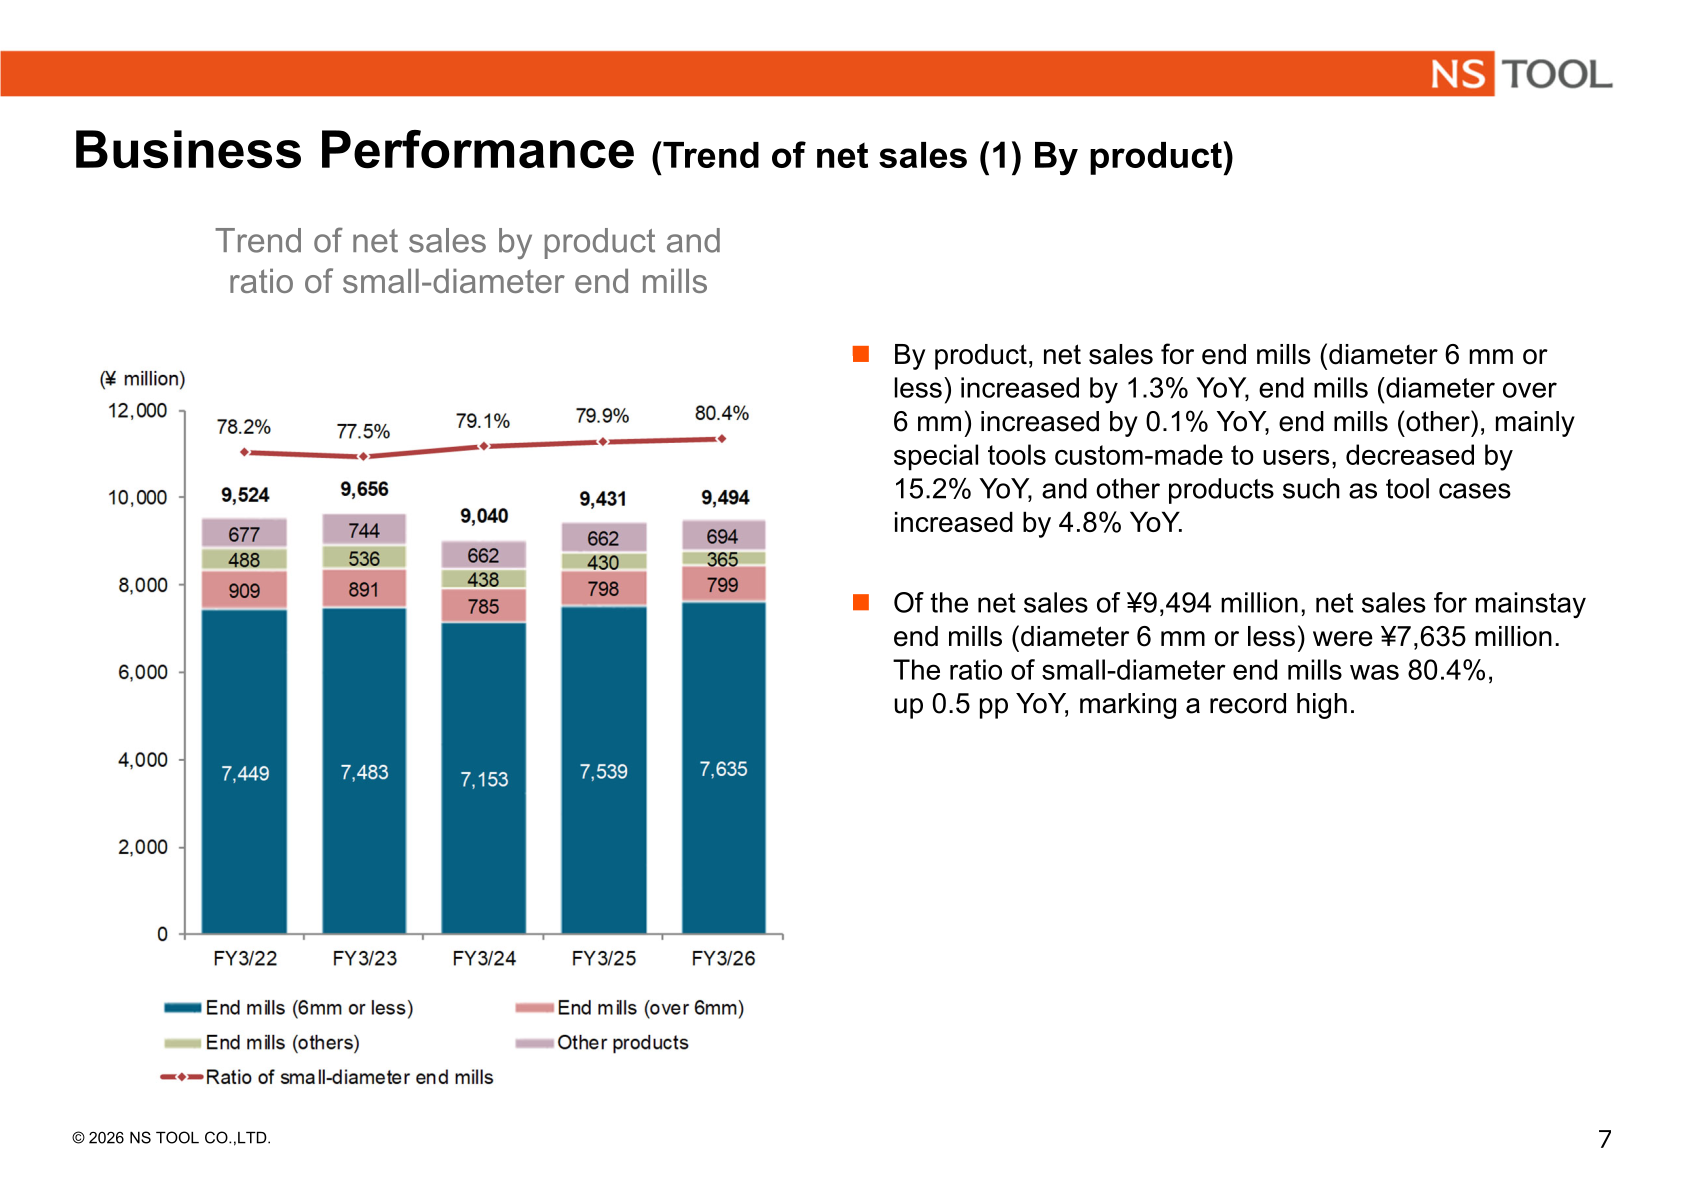
By product, net sales for end mills (diameter 6 mm or less) increased by 1.3% YoY, end mills (diameter over 6 mm) increased by 0.1% YoY, end mills (other), mainly special tools custom-made to users, decreased by 15.2% YoY, and other products such as tool cases increased by 4.8% YoY. Of the net sales of ¥9,494 million, net sales for mainstay end mills (diameter 6 mm or less) were ¥7,635 million. The ratio of small-diameter end mills was 80.4%, up 0.5 pp YoY, marking a record high.
| Product (Unit: ¥ million) | FY3/25 | FY3/26 | YoY Changes |
|---|---|---|---|
| End mills (6mm or less) | 7,539 | 7,635 | +1.3% |
| End mills (over 6mm) | 798 | 799 | +0.1% |
| End mills (others) | 430 | 365 | -15.2% |
| Other products | 662 | 694 | +4.8% |
| Ratio of small-diameter end mills | 79.9% | 80.4% | +0.5 pp |
Domestic and Overseas Net Sales
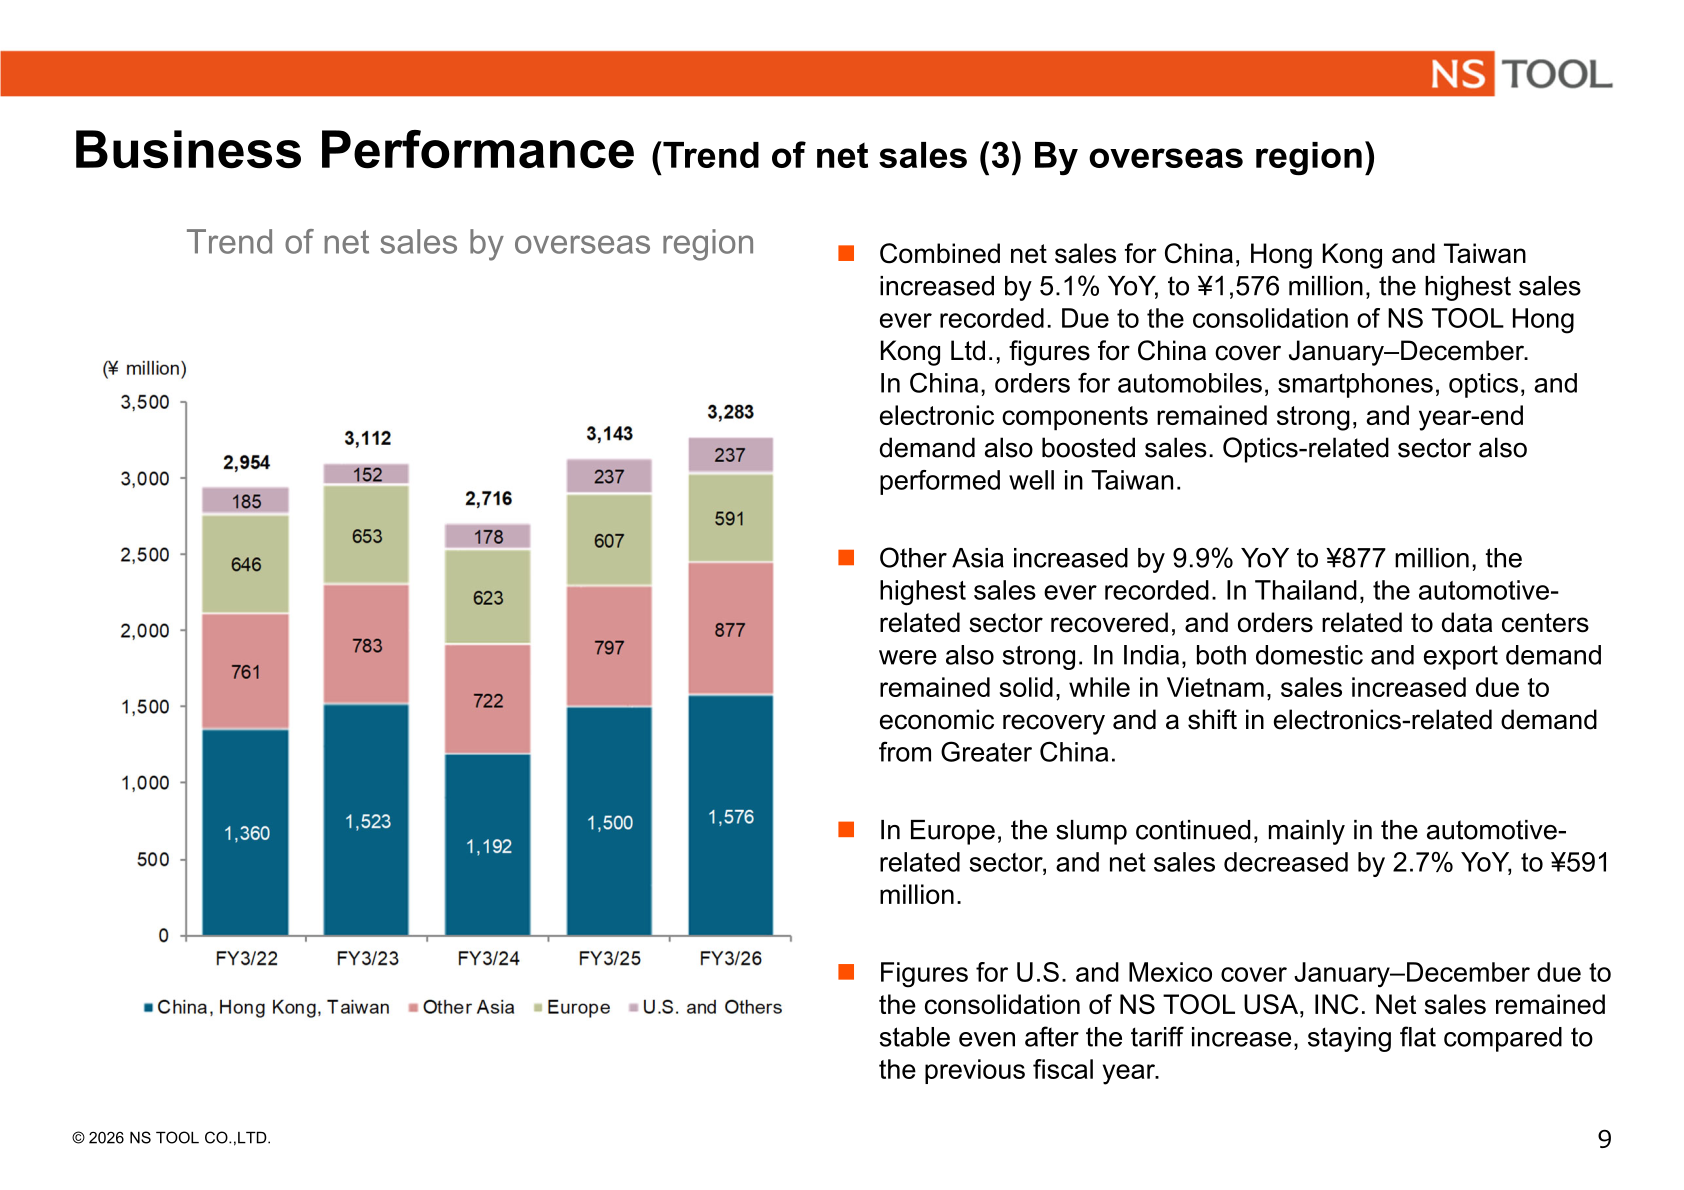
Domestic net sales decreased by ¥76 million, down 1.2% YoY, to ¥6,210 million, while overseas net sales increased by ¥139 million, up 4.4% YoY, to ¥3,283 million, making a record high. The company notes that while the domestic automotive industry experienced a temporary slump due to the U.S. tariff issue, AI-related demand remained strong, and overseas performance was strong in Greater China and in Asian countries such as Thailand, India and Vietnam. The overseas net sales ratio increased by 1.3 pp YoY to 34.6%, marking a record high on a full-year basis.
By overseas region, combined net sales for China, Hong Kong and Taiwan increased by 5.1% YoY to ¥1,576 million, the highest sales ever recorded; due to the consolidation of NS TOOL Hong Kong Ltd., figures for China cover January–December. Other Asia increased by 9.9% YoY to ¥877 million, also the highest sales ever recorded, supported by a recovery in the automotive-related sector and strong data center-related orders in Thailand, solid domestic and export demand in India, and economic recovery plus a shift in electronics-related demand from Greater China in Vietnam. In Europe, the slump continued mainly in the automotive-related sector and net sales decreased by 2.7% YoY to ¥591 million. Figures for U.S. and Mexico cover January–December due to the consolidation of NS TOOL USA, INC.; net sales remained stable even after the tariff increase, staying flat compared to the previous fiscal year.
| Region (Unit: ¥ million) | FY3/25 | FY3/26 | YoY Changes |
|---|---|---|---|
| Domestic net sales | 6,287 | 6,210 | -1.2% |
| Overseas net sales | 3,143 | 3,283 | +4.4% |
| Overseas net sales ratio | 33.3% | 34.6% | +1.3 pp |
| China, Hong Kong, Taiwan | 1,500 | 1,576 | +5.1% |
| Other Asia | 797 | 877 | +9.9% |
| Europe | 607 | 591 | -2.7% |
| U.S. and Others | 237 | 237 | Flat |
FY3/27 Forecast
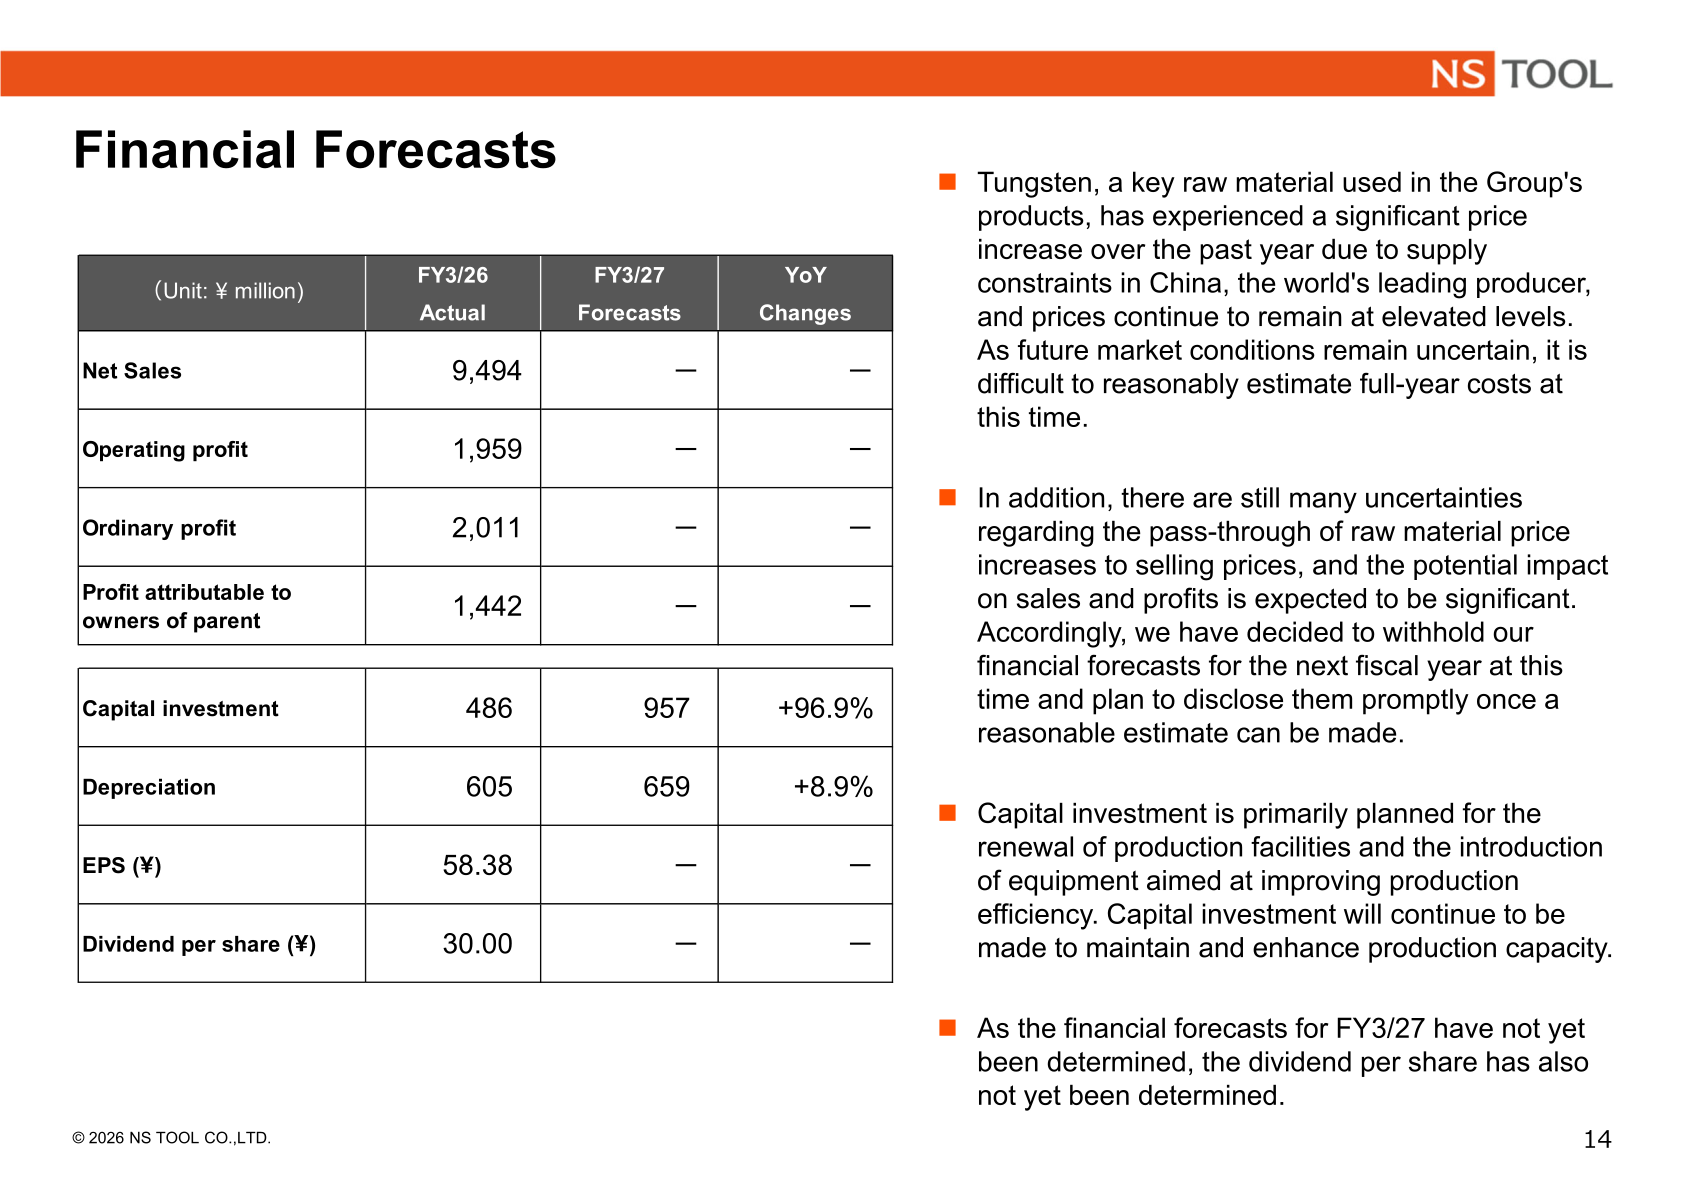
NS TOOL has withheld its earnings forecasts for the next fiscal year. The company explains that tungsten, a key raw material used in the Group’s products, has experienced a significant price increase over the past year due to supply constraints in China, the world’s leading producer, and prices continue to remain at elevated levels; as future market conditions remain uncertain, it is difficult to reasonably estimate full-year costs at this time. In addition, there are still many uncertainties regarding the pass-through of raw material price increases to selling prices, and the potential impact on sales and profits is expected to be significant. Accordingly, the company decided to withhold its financial forecasts for the next fiscal year and plans to disclose them promptly once a reasonable estimate can be made.
Capital investment is primarily planned for the renewal of production facilities and the introduction of equipment aimed at improving production efficiency, and the company states that capital investment will continue to be made to maintain and enhance production capacity.
| Item (Unit: ¥ million) | FY3/26 Actual | FY3/27 Forecasts | YoY Changes |
|---|---|---|---|
| Net Sales | 9,494 | — | — |
| Operating profit | 1,959 | — | — |
| Ordinary profit | 2,011 | — | — |
| Profit attributable to owners of parent | 1,442 | — | — |
| Capital investment | 486 | 957 | +96.9% |
| Depreciation | 605 | 659 | +8.9% |
| EPS (¥) | 58.38 | — | — |
| Dividend per share (¥) | 30.00 | — | — |
Shareholder Returns
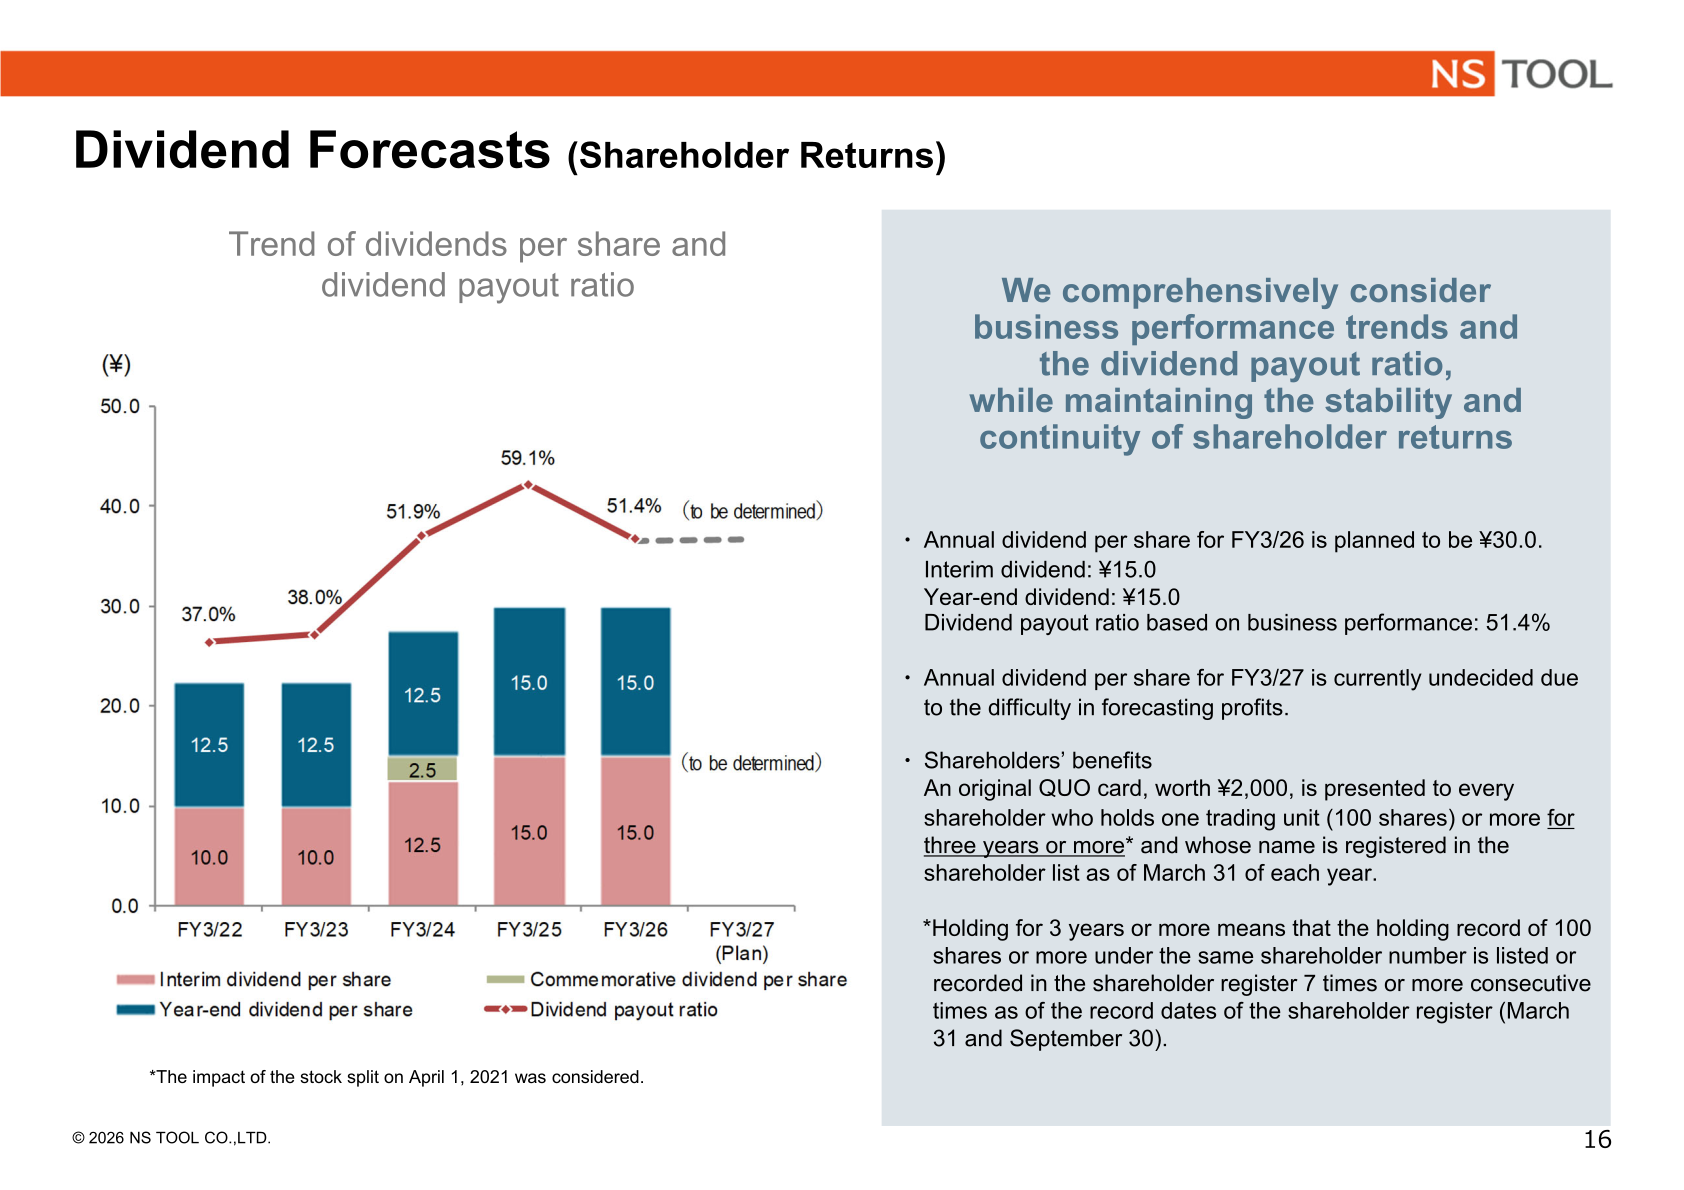
The company states that it comprehensively considers business performance trends and the dividend payout ratio while maintaining the stability and continuity of shareholder returns. The annual dividend per share for FY3/26 is planned to be ¥30.0, consisting of an interim dividend of ¥15.0 and a year-end dividend of ¥15.0, with a dividend payout ratio based on business performance of 51.4% (59.1% in FY3/25). The annual dividend per share for FY3/27 is currently undecided due to the difficulty in forecasting profits.
As a shareholder benefit, an original QUO card worth ¥2,000 is presented to every shareholder who holds one trading unit (100 shares) or more for three years or more and whose name is registered in the shareholder list as of March 31 of each year. Holding for three years or more means that the holding record of 100 shares or more under the same shareholder number is listed or recorded in the shareholder register seven times or more consecutive times as of the record dates of the shareholder register (March 31 and September 30).
| Item | FY3/26 | FY3/27 (Plan) |
|---|---|---|
| Interim dividend per share (¥) | 15.0 | To be determined |
| Year-end dividend per share (¥) | 15.0 | To be determined |
| Annual dividend per share (¥) | 30.0 | To be determined |
| Dividend payout ratio based on business performance | 51.4% | To be determined |
Topics: Cost Structure and Capital Investment
On the cost side, the company reports that as production increased driven by higher sales, material costs increased by 4.2% YoY, outsourcing expenses increased by 12.6% YoY partly due to pricing revisions, and labor costs increased by 5.0% YoY, while manufacturing expenses decreased by 12.7% YoY due to a reduction in factory supplies expenses and manufacturing repair costs. Cost of sales decreased by 4.8% YoY, reflecting lower manufacturing costs driven by economies of scale from increased production and cost reduction efforts across the Group, including subsidiaries.
Within SG&A, advertising expenses and exhibition costs decreased mainly as costs for revising product catalogues and exhibiting at large-scale exhibitions were higher in the previous fiscal year, so selling expenses decreased by 10.1% YoY to ¥448 million, while personnel expenses increased by 4.7% YoY to ¥1,911 million mainly reflecting higher salaries associated with wage increases. Non-operating income was ¥58 million, partly due to increased gain from the sales of scraps resulting from a rise in metal scrap prices, while non-operating expenses were ¥6 million.
Regarding capital investment, the company notes that in FY3/26, in addition to the renewal of production facilities, investments in equipment for development and sales support were also made, and that for FY3/27 it plans to continue renewing production facilities and introducing equipment to improve production efficiency, with depreciation expected to increase.
This article is an analysis based on publicly available information and is not a recommendation to buy or sell any specific securities. Investment decisions are your own responsibility.
![[Obayashi] Investors’ Guide 2026 — The Complete 24-Article Breakdown](https://japan-equity.com/wp-content/uploads/2026/07/hub_cover-1024x1024.png)
![[Obayashi] IR & SR Policy — Feeding Dialogue Back into Management](https://japan-equity.com/wp-content/uploads/2026/07/p32_sq-1024x1024.jpg)
![[Obayashi] Domestic Civil Engineering — Resilience Spending Supports 9.6% Margin](https://japan-equity.com/wp-content/uploads/2026/07/p11_sq-1024x1024.jpg)
![[Obayashi] Overseas Construction — Orders Reach ¥1.2tn](https://japan-equity.com/wp-content/uploads/2026/07/p15_sq-1024x1024.jpg)
![[Obayashi] Share Price & External Ratings — vs TOPIX, ESG Index Inclusion](https://japan-equity.com/wp-content/uploads/2026/07/p40_sq-1024x1024.jpg)
![[Construction] ¥75.5tn Investment, Shrinking Workforce — Big-5 Market Share](https://japan-equity.com/wp-content/uploads/2026/07/p12_sq-1024x1024.jpg)



![[Obayashi] Capital Policy & Shareholder Returns — ROE 10%+, DOE ~5%, ¥100bn Buyback](https://japan-equity.com/wp-content/uploads/2026/07/p27_sq-1024x1024.jpg)
![[Obayashi] Reducing Cross-Shareholdings — ¥285.2bn Sold in Five Years](https://japan-equity.com/wp-content/uploads/2026/07/p29_sq-1024x1024.jpg)
![[Obayashi] ¥750bn Investment Plan — ¥300bn to Development, ¥190bn to Tech/DX](https://japan-equity.com/wp-content/uploads/2026/07/p30_sq-1024x1024.jpg)
![[Obayashi] MTP2022 KPIs — Operating Profit ~2x Target, ROE 14.4%](https://japan-equity.com/wp-content/uploads/2026/07/p25_sq-1024x1024.jpg)
![[Obayashi] Cash Allocation — ¥420bn Investment CF Over Five Years](https://japan-equity.com/wp-content/uploads/2026/07/p26_sq-1024x1024.jpg)
![[Obayashi] Green Energy — 44 Plants, 344MW, and the Green Hydrogen Challenge](https://japan-equity.com/wp-content/uploads/2026/07/p21_sq-1024x1024.jpg)
![[Obayashi] Tackling the Labor Shortage — Robotics Construction®](https://japan-equity.com/wp-content/uploads/2026/07/p14_sq-1024x1024.jpg)
